© 2018, IRJET | Impact Factor value: 6.171 | ISO 9001:2008 Certified Journal | Page 4169
ESTIMATION OF SEISMIC PERFORMANCE OF IRREGULAR STRUCTURES
USING RESPONSE SPECTRUM METHOD
Ann Vincent
1, Mariamol Kuriakose
21MTech Student, Dept. of Civil Engineering, St Joseph’s College of Engineering and Technology, Palai, Kerala, India
2Assistant Professor, Dept. of Civil Engineering, St Joseph’s College of Engineering and Technology, Palai, Kerala, India
---***--- Abstract- Structures with easy and same configurations are subjected to much less damage during earthquake. Many buildings in the current state have abnormal configuration. This may subject to damaging earthquake in destiny. To examine which is the most unfavourable case, a seismic evaluation is executed. On this reinforced concrete framed buildings of abnormal plan such as L form, W form, I form are analysed and are compared with rectangular plan. These systems are g+15 storied. The goal is to perform response spectrum evaluation over rectangular and abnormal fashioned RC building frame. The building frames are analysed using ETABS 2015 software. Comparative evaluation on the maximum displacement, storey drift and storey shear of different buildings has been explored.
Key Words:Irregular structure, ETABS, storey drift, displacement, storey shear
1. INTRODUCTION
Natural disasters are ineluctable and it's not possible to manage them. The history of human civilization shows that man has been braving with natural disasters like earthquakes, cyclones, floods, volcanic eruptions from the origin itself that not solely disturbed the conventional lifetime of human however conjointly causes vast losses to life and property and obstructs the event method. With the event of technology man tried to resist these natural disasters through varied ways like early warning systems, adopting new preventive measures, correct relief and rescue measures. However sadly it's not correct for all natural disasters. Earthquakes are one amongst such natural disaster connected with tectonic method that suddenly happens for seconds and causes vast loss of life and property. Therefore earthquake disaster hindrance and reduction policy could be a worldwide agitation nowadays. Structures are the principal indicator of social growth of a rustic. Today most of the buildings are designed as irregular structures. Irregularities are one amongst the key reasons for the failure of structures throughout earthquakes. The feature of the regularity and symmetry within the overall form of the building each in plan and elevation enormously have an effect on the response of the building beneath static and dynamic loading. The necessity and demand of contemporary age and growing population has created the architects and structural engineers forced towards designing of irregular structures that desires extra careful structural analysis, so satisfactory behaviour of structures is ensured throughout a damaging earthquake. So earthquake analysis is important for normal and irregular medium to high rise buildings. To own an authentic estimate of structures, advanced analysis tools are necessary. Because of the simplicity structural engineers has been using response spectrum analysis. It’s the foremost correct technique out there for the analysis of buildings subjected to earthquake. By acting seismic analysis we will realize the weak points within the structures.
2. OBJECTIVES
To confirm seismic capability of concrete framed buildings with regular structure (rectangular) and irregular
plans with G+15 level by using ETABS 2015 software.
Estimation of storey drifts and its distribution on the peak.
Determination of storey displacements.
Evaluation of storey shear.
To attain the seismic performances of various irregular buildings placed in zone III and conjointly confirm most
© 2018, IRJET | Impact Factor value: 6.171 | ISO 9001:2008 Certified Journal | Page 4170
3. METHODOLOGY
3.1 Modelling of structures
The ETABS 2015 software has been used for modelling of structures. ETABS is very developed, special purpose analysis and design orient program developed for building systems. ETABS is quick and simple for easy structures. It may handle huge and most complicated building models together with big selection of geometrical nonlinear behaviours. So it makes the most effective tool of selection for the structural engineers within the industry. It yields the structural engineers with all tools necessary to make, modify, analyse, style and optimize building models.
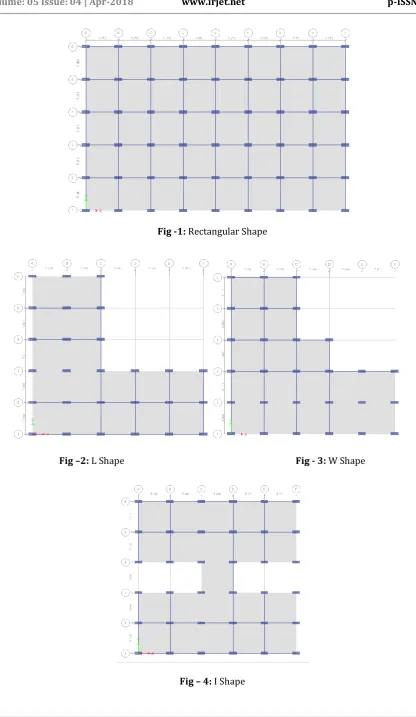
3.2 Building plan and dimension details
The models that are used for study are G+15 storied buildings. For analysis rectangular formed, L formed, W formed and I formed models were evaluated. The spacing between the frames are 5m on x and y direction. Following knowledge is employed within the analysis of RC building models.
Support conditions: Fixed
Grade of concrete: M 30
Grade of steel: Fe 500
Storey height: 3m
Depth of foundation:1.5m
Slab thickness: 150mm
Size of column: 450mm x 1200mm
Size of beams: 300mm x 450mm
Seismic zone: III
Soil condition: Medium
Importance factor: 1
Wall thickness: 230mm
3.3 Load details
Live load: 2kN/m²
Floor finishes: 1kN/m²
Wall load: 13.8kN/m
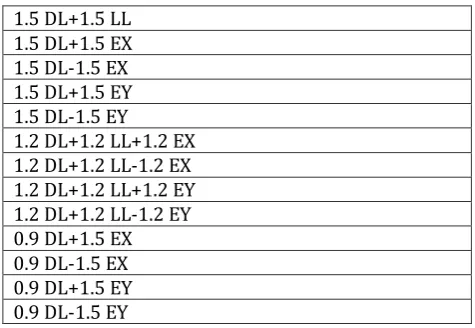
[image:2.595.179.417.560.724.2]3.4 Load combinations
Table -1: Load combinations considered
1.5 DL+1.5 LL 1.5 DL+1.5 EX 1.5 DL-1.5 EX 1.5 DL+1.5 EY 1.5 DL-1.5 EY
© 2018, IRJET | Impact Factor value: 6.171 | ISO 9001:2008 Certified Journal | Page 4171 Fig -1: Rectangular Shape
[image:3.595.85.502.57.775.2]Fig –2: L Shape Fig - 3: W Shape
© 2018, IRJET | Impact Factor value: 6.171 | ISO 9001:2008 Certified Journal | Page 4172
3.5 Response spectrum analysis
This concept permits multiple modes of vibration of a structure. Response spectrographic analysis is required in most building codes for all apart from terribly simple or terribly composite structures. The building vibration is that the combination of the many modes. Computer analysis is employed to spot the modes of the structures. A response is obtained from the design spectrum for every modes resembling the modal frequency and modal mass and that they are combined to get the entire response of the structure. Modal responses are combined make use of square root of sum of squares (SRSS), complete quadratic combination (CQC) and absolute (ABS) strategies.
4. RESULT AND DISCUSSION
Chart-1: Displacement vs storey for earthquake load in X direction
Above chart 1 shows that maximum storey displacement in X direction increases with increase in storey height.
Displacement is less for rectangular shaped building compared to other shapes.
Chart -2: Displacement vs storey for earthquake load in Y direction 0 5 10 15 20 25 30 35 40 45
B A S E 1 2 3 4 5 6 7 8 9 1 0 1 1 1 2 1 3 1 4 1 5 1 6 1 7
D IS PL AC EM EN T ( m m ) STOREY
STOREY DISPLACEMENT
Rectangle L Shape W Shape I Shape
0 5 10 15 20 25 30 35 40 45 50
B A S E 1 2 3 4 5 6 7 8 9 1 0 1 1 1 2 1 3 1 4 1 5 1 6 1 7
D IS PL AC EM EN T (m m ) STOREY
STOREY DISPLACEMENT
© 2018, IRJET | Impact Factor value: 6.171 | ISO 9001:2008 Certified Journal | Page 4173
Above chart 2 shows that maximum storey displacement in Y direction increases with increase in storey height.
Displacement is less for rectangular shape compared to other shapes.
Chart -3: Drift vs storey for earthquake load in X direction
From the chart 3 it is observed that the drift index increases with height from bottom storey up to the 5th storey
reaching the maximum value and then gradually decreases. From the chart it can also be seen that minimum drift is for rectangular shaped building.
Chart -4: Drift vs storey for earthquake load in Y direction
From the chart 4 it is observed that drift index increases with height from bottom storey up to the 5th storey
reaching the maximum value and then gradually decreases. It can also be seen that drift is minimum for
rectangular shaped structure.
0 0.0002 0.0004 0.0006 0.0008 0.001 0.0012 0.0014
B A S E 1 2 3 4 5 6 7 8 9 1 0 1 1 1 2 1 3 1 4 1 5 1 6 1 7
D
RI
FT
STOREY
STOREY DRIFT
Rectangle L Shape W Shape I Shape
0 0.0002 0.0004 0.0006 0.0008 0.001 0.0012 0.0014
B A S E 1 2 3 4 5 6 7 8 9 1 0 1 1 1 2 1 3 1 4 1 5 1 6 1 7
D
RI
FT
STOREY
STOREY DRIFT
© 2018, IRJET | Impact Factor value: 6.171 | ISO 9001:2008 Certified Journal | Page 4174 Chart -5: Storey shear vs storey for earthquake load in X direction
From the chart 5 it is clear that storey shear is maximum at the bottom storey and minimum at the top storey.
Storey shear is maximum for rectangular shape and minimum for L shape when earthquake load is applied in X direction. Rectangular shape has a maximum storey shear of 1055.578kN compared to other shapes.
Chart -6: Storey shear vs storey for earthquake load in Y direction
It is evident that storey shear is maximum for rectangular shape compared to other structures when earthquake
load is applied in Y direction. Storey shear increases from top storey and it reaches its maximum value at the bottom storey. L shape has minimum storey shear value. The maximum value of storey shear for rectangular shape is 1151.6478kN.
5. CONCLUSION
Response spectrum method provides a clear interpretation of the contributions of different modes of vibration. It
is useful for the seismic evaluation of structures. 0
200 400 600 800 1000 1200
1 2 3 4 5 6 7 8 9 1 0 1 1 1 2 1 3 1 4 1 5 1 6 1 7
ST
O
RE
Y S
HE
AR(
kN)
STOREY
STOREY SHEAR
Rectangle L Shape W Shape I Shape
0 200 400 600 800 1000 1200
1 2 3 4 5 6 7 8 9 1 0 1 1 1 2 1 3 1 4 1 5 1 6 1 7
ST
O
RE
Y S
HE
AR(
kN
)
STOREY
STOREY SHEAR
© 2018, IRJET | Impact Factor value: 6.171 | ISO 9001:2008 Certified Journal | Page 4175
During analysis parameters such as displacement, storey drift and shear were considered.
Maximum displacement for irregular structures and minimum for regular structures. Rectangular building have
minimum displacement and L shaped building have maximum displacement compared to other shapes. The reason is the presence of re-entrant corners. L shaped buildings produce distinctive motions between different wings of the building. Because of the stiff elements located in this region will results in local stress concentrations at the re-entrant corners. Most of the building codes recognize re-entrant corners are one of the serious irregularities.
Storey drift is maximum for L shape and minimum for rectangular shape. For all the structures storey drift follows
a parabolic path along height of building with maximum value lying almost near the middle storey. From the following graphs it can be conventionally states that drift ratio in upper storey is generally more, less in lower stories and maximum at the middle stories.
Storey shear is maximum at the bottom of all the structures. If the structure is heavy storey shear is maximum.
Rectangular buildings have large storey shear compared to other structures.
From the analysis it is clear that Irregular shapes are severely attacked.
REFERENCES:
[1] Kusuma B 2017, “Seismic analysis of a high-rise RC framed structure with irregularities” (International Research
Journal of Engineering and Technology (IRJET), Volume 4, Issue 7)
[2] Guruprasad G and Srikanth G 2017, “Seismic evaluation of irregular structures” (International Journal of Research, Volume 6, Issue 2)
[3] Ravindra N. Shelke and Ansari U.S 2017, “Seismic analysis of vertically irregular RC building frames” (International Journal of Civil Engineering and Technology (IJCIET), Volume 8, Issue 1)
[4] Soleimania S, Aziminejada A and Moghadam A.S 2016, “Extending the concept of energy-based pushover analysis to asses seismic demands of asymmetric-plan buildings” (Soil Dynamics and Earthquake Engineering)
[5] Mohaiminul Haque, Sourav Ray, Amit Chakraborty, Mohammad Elias and Iftekharul Alam 2016, “Seismic performance analysis of RCC multi-storeyed buildings with plan irregularity” (American Journal of Civil Engineering, Volume 4, No.3)
[6] Suchita K. Hirde and Rahul A. Aher 2016, “Seismic Evaluation of irregular Structures” (International Journal of Current Engineering and Technology, Volume 6, No.5)
[7] Govind M, Kiran K Shetty and K. Anil Hedge 2015, “Seismic evaluation of high rise regular and irregular structure using pushover analysis” (IOSR Journal of Mechanical and Civil Engineering, Page 14-19)
[8] IS code 1893 (part 1):2002