OPTIMIZATION OF PROCESS PARAMETERS USING TAGUCHI’S DESIGN
OF EXPERIMENT IN WIRE CUT ELECTRICAL DISCHARGE MACHINING
Jayaraj .M
1, Arun Prasath .P
21Assistant Professor, P.A College of Engineering and Technology, Pollachi, Coimbatore -642002 2Assistant Professor, KGISL Institute of Technology, Coimbatore-641035.
---***---Abstract -
Nowadays globalization forces the industries to concentrate more on quality of products and process in order to survive in the market. In the current scenario, non-traditional machining processes are replacing the non-traditional machining process. The wire cut EDM (WEDM) is very important among the non-traditional machining processes. To achieve good surface finish on the tool as well as in the component, optimum process parameter setting is a crucial factor. Process parameters are optimized by using different techniques for improving the quality. In the present study, Taguchi’s Design of Experiment technique is used to optimize the WEDM parameters so as to improve the surface finish of the components produced out of these manufacturing methods. A key component of Taguchi’s philosophy is reduction of variability and the quality characteristics as a target or nominal value. The experiments have been designed by using Taguchi’s orthogonal array. The Analysis of Variance (ANOVA) has been carried out to determine the significant parameters which are having more influence on surface finish. The critical parameters via, pulse on time, pulse off time, peak current, wire tension, wire feed, fluid rate and fluid pressure are being used in WEDM machine. Each sample was measured for surface roughness using surface roughness tester equipment. The quality characteristic “smaller is better” is used. Applying Qualitek-4, Minitab 18 and ANOVA analysis techniques, the factors influencing the surface roughness were identified. The difference between expected result and confirmation experiment result of surface finish was found to be minimum.1.INTRODUCTION
In view of improvement in wire cut electric discharge machining (WEDM) process performance, optimization of process parameters assumes significant importance. This research article deals with the investigation on optimization of the process parameters of the wire cut EDM of mild steel and stainless steel. material removal rate, surface roughness, were studied against the wire cut EDM process parameters, such as pulse on, voltage and wire feed rate. The obtained results show that the Taguchi’s robust design analysis is being an effective technique to optimize the machining parameters for the WEDM process [1]. In WEDM process rough machining gives lesser accuracy and finish machining gives fine surface finish, but it reduces the machining speed. Hence we have to improve the MRR and reduce the Ra as the objective, which is done by taguchi method [2].The objective of the present work is to investigate the effects of the various WEDM process parameters on the machining quality and to
(T-ON), pulse off time (T-OFF), peak current (IP), wire feed (WF), wire tension (WT),fluid rate(FR),fluid pressure(FP). Taguchi’s orthogonal array (L8) used to conduct experiments on randomly chosen materials. The objective is about the surface finish of the material.
2. EXPERIMENTAL PROCEDURE
In this experimental study, 7 factors and 2 levels are used and L8 orthogonal array suitable for this experimental design was selected. The experimental runs were performed based on the basis of mixed orthogonal array, L8 (2ʌ 7). A total of 4 (4*4) experimental runs were performed. The process parameters considered are pulse on-time, pulse off-time, peak current, wire tension, wire feed, fluid rate, and fluid pressure and their levels are shown in table-1.
Table-1:Design Factors and their levels
Factors Level-1 Level-2
Pulse on-time (µs) 125 130 Pulse off-time (µs) 35 40 Peak current (Amps) 11 12 Wire tension (Grams) 1000 1200 Wire feed (M/Min) 7 8 Fluid rate (LPM) 8 9 Fluid pressure (Kg/cm2) 13 15
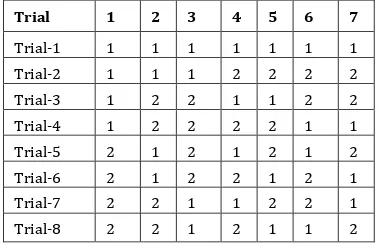
Table-2: Orthogonal array
The L8 orthogonal array used for experiment is shown in the Table-2
Trial 1 2 3 4 5 6 7
Trial-1 1 1 1 1 1 1 1 Trial-2 1 1 1 2 2 2 2 Trial-3 1 2 2 1 1 2 2 Trial-4 1 2 2 2 2 1 1 Trial-5 2 1 2 1 2 1 2 Trial-6 2 1 2 2 1 2 1 Trial-7 2 2 1 1 2 2 1 Trial-8 2 2 1 2 1 1 2
Experiments were carried out based on mixed orthogonal array L8 (2ʌ 7). The experiments were performed on ELEKTRA wire-cut electric discharge machine by taking Mild steel as work material and zinc chromium as tool electrode material. A total of 8 experimental runs were performed.
3.RESULT AND DISCUSSION
[image:2.595.360.508.105.239.2]The experiments were performed on each work pieces based on the orthogonal array method. The surface roughness values are measured by using surface roughness tester on the work pieces. The measured values are tabulated in the Table -3.
Table -3: Surface Roughness Values
Trials Surface roughness ( µm )
Trial-1 2.5275 Trial-2 2.3520 Trial-3 2.2540 Trial-4 2.4650 Trial-5 2.7000 Trial-6 2.8125 Trial-7 2.3500 Trial-8 2.2875 Average 2.468
[image:2.595.328.539.319.428.2]The main effect from the qualitek-4 software was shown in Table -4.The study of the main effects indicates some interaction between the factors.
Table -4: Main Effects
Column Factors Level-1 Level-2 L2-L1
1 Pulse on-time 2.399 2.537 .137 2 Pulse off-time 2.597 2.338 -.259 3 Peak current 2.378 2.557 .178 4 Wire tension 2.457 2.478 .021 5 Wire feed 2.47 2.466 -.005 6 Fluid rate 2.494 2.441 -.054 7 Fluid pressure 2.538 2.398 -.14
[image:2.595.67.258.486.609.2]Analysis of variance for Mild steel materials was shown in Table 5.3
Table-5:Anova Value
Column Factors DOF Sum of Variance Percent 1 Pulse
on-time 1 .037 .037 13.472 2 Pulse
off-time 1 .133 .133 47.537
3 Peak
current 1 .063 .063 22.686
4 Wire
tension 1 0 0 .318
5 Wire feed 1 0 0 .009
6 Fluid rate 1 .005 .005 1.974 7 Fluid
pressure 1 .039 .039 13.968 Other Error 0
Total 7 100%
variance) and should be approximately equal magnitude. In other words the ratio should be close to 1.
[image:3.595.315.557.76.217.2]The significant factor, which is having more influence for surface finish is obtained, and optimum conditions and performance shown in Table-6.
Table -6: Optimum conditions and performance
Column Factors Level Description
Level Contribution
1 Pulse on-time 125 1 -.069 2 Pulse off-time 40 2 -.13 3 Peak current 11 1 -.09 4 Wire tension 1000 1 -.011
5 Wire feed 8 1 -.002
6 Fluid rate 9 2 -.027
7 Fluid pressure 15 2 -.071
Total contribution from all factors = -.397 Current grand average of performance = 2.468 Expected results at optimum condition = 2.071
The significant factor and interaction influences shown in the pie chart figure-1.
Figure- 1: significant factor and interaction influences 43
[image:3.595.41.284.185.346.2]The performance distribution of the experiment is shown in the figure -2, in this figure the performance of the current condition and the improved condition is showed.
Figure-2: performance of distribution
Figure-3: Main effects plot for means
Comparison of current & improved condition Signal to noise ratio in current condition= -7.874 Signal to noise ratio in improved condition= -6.339 The average mean of the RA = 2.468
Standard deviation in current condition= 0.187 Standard deviation in improved condition= 0.157
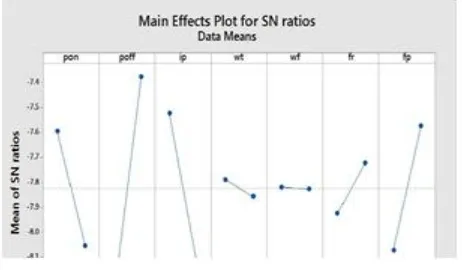
[image:3.595.50.278.390.518.2]By using the qualitek-4 software we can improve the performance and also we can increase the accuracy of the surface roughness. The optimum value is obtained by using the qualitek-4 software. By using Minitab 18 software, main effect plots and signal to noise ratio plots for Mild steel was found and shown in Figure 3 and 4.
Figure-4: main effects plots for SN ratio
[image:3.595.318.549.440.575.2]Respected means and Signal to noise ratio from Minitab is shown in table-7.
Table -7: means and S/N ratio
Trials SNRA MEAN
[image:3.595.46.279.610.752.2]Analysis of variance for means are shown in table-8.
Table-8: Analysis of variance for means
Source DF Seq SS Adj SS Adj MS
Pon 1 0.038019 0.038019 0.038019 Poff 1 0.134033 0.134033 0.134033 Ip 1 0.063814 0.063814 0.063814 Wt 1 0.000914 0.000914 0.000914 Wf 1 0.000026 0.000026 0.000026 Fr 1 0.005592 0.005592 0.005592 Fp 1 0.039410 0.039410 0.039410 Residual Error 0
Total 7 0.281807
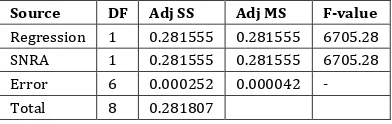
[image:4.595.64.260.320.382.2]Analysis of variance for regression is shown in table-9.
Table-9:Analysis of variance for regression
Source DF Adj SS Adj MS F-value
Regression 1 0.281555 0.281555 6705.28 SNRA 1 0.281555 0.281555 6705.28 Error 6 0.000252 0.000042 - Total 8 0.281807
To find the RA value in mathematically we have to create a regression equation. From the Minitab software we can create the regression equation, by using the regression equation we can get the predicted values of surface roughness (Ra) values.
Percentage of error from ANOVA for regression= Error/ Total*100
= 0.000252/0/021807*100 Percentage of error= 0.0894
From the Minitab software the regression equation is obtained.
Regression equation Ra = 0.1994-0.2900*SNRA1
Substituting the values from the analysis of variance table of Minitab
Ra= 0.1994-0.2900* -8.05382 =2.5350
From the regression equation the predicted values obtained. The predicted RA values are shown in table-10.
Table -10:predicted Ra values
SI.NO Predicted Ra values
1 2.5350 2 2.3537 3 2.2465 4 2.4719 5 2.7013
6 2.8041 7 2.3515 8 2.836
CONLUSION:
From the comparison of the main effects of qualitek-4 and Minitab the effects and original Ra value and predicted Ra value is deviated below 5%. The experiment is said to be more accurate and efficient. Optimum condition for machining Mild steel material is shown in Table-11.
Table-11: Optimum conditions for Mild steel
Trial No
(Ton) µ-sec
Toff) µ-sec
(Ip) Amps
(Wt) Grams
(Wf) M/Min
(Fr) LPM
(Fp) Kg/cm2
1 125 40 11 1000 8 9 15
REFERENCES:
[1] R.Prasanna, ‘Optimization of Process Parameters in Wire Cut EDM of Mild Steel and Stainless Steel using robust design’, International Journal of Chem Tech Research CODEN (USA): IJCRGG, Vol.11 No.01, 2018,pp 83-91.
[2] Dr. R.Sivasubramanian, ‘Machining Parameters Optimization of WEDM Process Using Taguchi Method’, India International Journal of Scientific and Research Publications, Vol.2, 2012,pp 98-107.
[3] Sunny Singh , ‘Optimization of Process Parameters in WEDM Process’, International Journal of Advance Research and Innovation, vol.4, 2016,pp 62-78
[4] K. Guru Raj , ‘Modeling and Analysis of EDM Process parameters Using Taguchi Technique and Fuzzy Based Modeling’, International Journal of Advanced Mechanical Engineering.Vol 4, 2014,pp. 473-480.
[5] S V Subrahmanyam , ‘Evaluation of Optimal Parameters for machining with Wire cut EDM Using Grey-Taguchi Method’, International Journal of Scientific and Research Publications, Vol 3, 2013,pp 52-68.
[6] P. Devaraj , ‘Optimization of Machining Parameters in Wire EDM of Copper Using Taguchi Analysis’, International Journal of Advanced Materials Research Vol. 1,2015, pp 126-131.
[7] N. Selvaraj, , ‘Optimization of WEDM Process Parameters on Titanium Alloy Using Taguchi Method’, International Journal of Modern Engineering Research (IJMER) Vol. 3, 2013,pp 2281-2286.
[9] Suresh Kataria ,’Experimental Investigation on WEDM Machine Using Taguchi Techniques for Optimization of Process Parameter’, IJRMET, Vol. 3, 2006,pp 1175-1189.
[10] Rajesh Kumar , ‘Performance Study of Wire Cut Electric Discharge Machining Process by Using Taguchi’s Parameter Design Approach’, International Journal of Engineering Inventions vol.2, 2013,pp 38-47.
[11] Sunil Kumar , ‘Research Work for Optimization and Effect of WEDM Cutting Process Parameters on Performance Measures’, International Journal for Research in Applied Science & Engineering Technology, vol 8, 2017,pp 105-121.
[12] Ravi kumar , ‘Modeling and Optimization of Wire EDM Process’, International Journal of Mechanical & Mechatronics Engineering IJMME-IJENS Vol:14,2014, pp 112-121.
[13] Pawan Kumar, ‘Optimization Of Machining Parameters Of Wire Cut EDM Process Using Taguchi’, International Journal of Technical Research (IJTR) Vol. 4,2015, pp 112-125.
[14] Sandeep Grover , ‘optimization of multiple-machining characteristics in wire-electrical discharge machining of punching die using grey relational analysis’, Vol 69, 2010,pp 606-612.
[15] Ivan sunit rout , ‘optimization of WEDM parameters using Taguchi method for higher material removal rate on EN31 steel’, International journal of engineering research and applications, vol.5,2015, pp 57-62.
[16] Sanjay Agarwal , ‘Optimization of machining parameters in WEDM of AISI D3 steel using Taguchi technique CIPR international conference on high performance cutting’,vol 4, pp 62-75.
[17] P. Sethuramalingam , ‘Wire EDM process parameters optimization of steel 316 by using Taguchi method’, International journal of emerging research in management & technology, Vol 6, 2017,pp 125-138.
[18] Amar Patnaik , ‘Optimization of wire electric discharge machining (WEDM) process parameters using Taguchi process’, vol 34, 2007,pp 911-925.