© 2018, IRJET | Impact Factor value: 6.171 | ISO 9001:2008 Certified Journal | Page 1488
Feasible Route Proposal by Risk Assessment of a Congested Bypass
Lekshmy Raghavan P
Research Scholar, Noorul Islam University, Tamil Nadu, India
---***---Abstract -
A Bypass is a popular mode of transport in Indiaand is considered to be the best solution to heavy road traffic congestion. Bypass routes are often controversial, as they require the building of a road carrying heavy traffic where no road previously existed. This creates a conflict between those who support a bypass to reduce congestion in a built-up area, and those who oppose the development of (often rural) undeveloped land. From the traffic volume survey conducted at both Amalanagar and Mannuthy, it was clear that the traffic congestion occurs on both junctions. It was about two decades ago that the authorities first mooted the idea of constructing a bypass connecting Amalanagar and Mannuthy to decongest the roads to Thrissur town. But this consists of a no. of blind curves and intersections. The major activities involved in the construction of this Bypass construction were listed out. A no. of new efficient routes was proposed by the project team. Risk assessment and feasibility study will help to point out the key problems in a construction project design. This paper focuses on the risk assessment of route proposed by government authorities and a proposal of efficient, feasible bypass route design from Amalanagar to Mannuthy. Also, a soil investigation is carried out in 5 different locations in between the route proposed by project team at an interval of 2.46 kms for assessing the quality of soil in the route proposed by project team.
Key Words: Composite Impact Factor (CIF), Composite Likelihood Factor (CLF), Peak Hour Factor, Risk Assessment, Risk Severity Survey, Spearman’s Rank Correlation
1. INTRODUCTION
Road traffic congestion is a big problem in Kerala. As Kerala is a part of a developing country, road transport is a main factor which affects the social and economic fields. Bypass routes are often controversial, as they require the building of a road carrying heavy traffic where no road previously existed. This creates a conflict between those who support a bypass to reduce congestion in a built up area, and those who oppose the development of (often rural) undeveloped land. However, those of the bypassed city may also oppose the project, as the reduced traffic could damage business. It was about two decades ago that the authorities first mooted the idea of constructing a bypass connecting Amalanagar and Mannuthy to decongest the roads to Thrissur town. However, no plan or proposal was materialized and in-between local governing bodies continued sanctioning new construction projects in the area. By now, hundreds of houses have come up beside the 14.3km road that has about eight to 10 metres of width in most of the portions.
The KSTP has now been entrusted with the preparation of detailed project report for the Mannuthy-Amalanagar bypass. What made the locals furious was that the authorities, who had declared earlier that the bypass would have a width of 22m, have now announced through the tender that the bypass will be of 45m width.
Interestingly, the present Amalanagar-Mannuthy road, proposed to convert into bypass, has dozens of blind corners, a rail-over-bridge constructed as half-circle with just 5.7m width (not ideal to ply heavy vehicles), two government schools, many churches and temples along the stretch. According to the protesters, even the district authorities and a few politicians have secretly admitted that the bypass proposal is unscientific. They now doubt that the 45m wide bypass proposal was mooted only to help land mafia who own acres of land in the area.
The bypass action council has urged the authorities to change the alignment of the road to minimize the number of evacuees. The Kolazhy grama panchayat and Puzhakkal block panchayat also had sent a memorandum to the government with the same request. But authorities have refused to consider these requests, they alleged. The survey will collect information including buildings to be demolished, farmlands to be reclaimed, canals to be constructed, trees to be felled, electric poles to be shifted and other development works. So, it is necessary to find a feasible route for this bypass.
Alignment proposed for this bypass road by authorities having several intersections and bends. The return trips will have to cross the same hurdles. This is the relevance of this study.
1.1 Objectives
•To identify and analyze the risks with each construction activity of the Bypass construction from Amalanagar to Mannuthy.
•To analyse the Risk severity.
•To analyse the correlation between different parties involved in the construction of a Bypass, like Engineers, Contractors, Land owners etc.
© 2018, IRJET | Impact Factor value: 6.171 | ISO 9001:2008 Certified Journal | Page 1489 2. METHODOLOGY
A traffic volume survey was conducted at both Amalanagar and Mannuthy for evaluating the traffic congestion on both junctions. The major activities involved in the first phase of Bypass construction are listed out. A detailed questionnaire consisting of all the identified risks has been framed and survey was conducted between the parties involved in the construction team. For qualitative analysis, the probability and impact of each risk was assessed and composite likelihood factor and composite impact factor was calculated. Risk severity for each activity was then calculated. Again these surveys were repeated in the case of the route
proposed. Then a soil investigation was carried out in 5 different locations in between the route proposed at an interval of 2.46 kms.
3. DATA COLLECTED
As a part of the study, the following data were collected.
3.1 Traffic Study
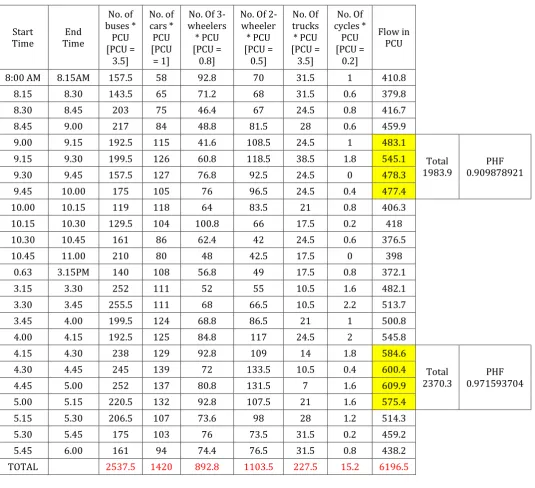
[image:2.595.33.569.273.761.2]The data collected after conducting traffic volume study at Amalanagar junction and Mannuthi is tabulated in Tables 1, 2 & 3.
Table -1: Observations of traffic volume survey with PCU calculations for Amalanagar junction
Start
Time Time End
No. of buses *
PCU [PCU =
3.5]
No. of cars * PCU [PCU = 1]
No. Of 3-wheelers
* PCU [PCU =
0.8]
No. Of 2-wheeler * PCU [PCU =
0.5]
No. Of trucks * PCU [PCU =
3.5]
No. Of cycles *
PCU [PCU =
0.2]
Flow in PCU
8:00 AM 8.15AM 157.5 58 92.8 70 31.5 1 410.8
8.15 8.30 143.5 65 71.2 68 31.5 0.6 379.8
8.30 8.45 203 75 46.4 67 24.5 0.8 416.7
8.45 9.00 217 84 48.8 81.5 28 0.6 459.9
9.00 9.15 192.5 115 41.6 108.5 24.5 1 483.1
Total
1983.9 0.909878921 PHF
9.15 9.30 199.5 126 60.8 118.5 38.5 1.8 545.1
9.30 9.45 157.5 127 76.8 92.5 24.5 0 478.3
9.45 10.00 175 105 76 96.5 24.5 0.4 477.4
10.00 10.15 119 118 64 83.5 21 0.8 406.3
10.15 10.30 129.5 104 100.8 66 17.5 0.2 418
10.30 10.45 161 86 62.4 42 24.5 0.6 376.5
10.45 11.00 210 80 48 42.5 17.5 0 398
0.63 3.15PM 140 108 56.8 49 17.5 0.8 372.1
3.15 3.30 252 111 52 55 10.5 1.6 482.1
3.30 3.45 255.5 111 68 66.5 10.5 2.2 513.7
3.45 4.00 199.5 124 68.8 86.5 21 1 500.8
4.00 4.15 192.5 125 84.8 117 24.5 2 545.8
4.15 4.30 238 129 92.8 109 14 1.8 584.6
Total
2370.3 0.971593704 PHF
4.30 4.45 245 139 72 133.5 10.5 0.4 600.4
4.45 5.00 252 137 80.8 131.5 7 1.6 609.9
5.00 5.15 220.5 132 92.8 107.5 21 1.6 575.4
5.15 5.30 206.5 107 73.6 98 28 1.2 514.3
5.30 5.45 175 103 76 73.5 31.5 0.2 459.2
5.45 6.00 161 94 74.4 76.5 31.5 0.8 438.2
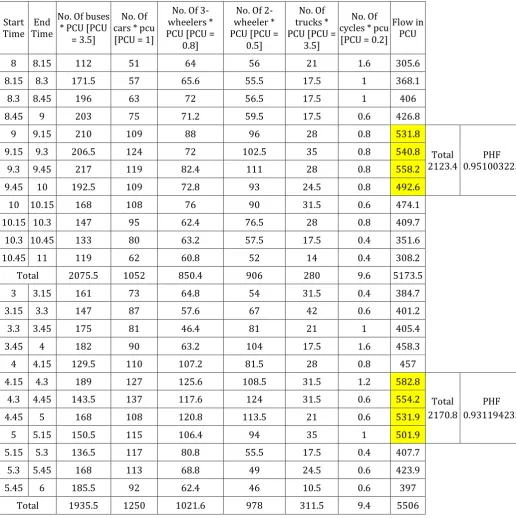
© 2018, IRJET | Impact Factor value: 6.171 | ISO 9001:2008 Certified Journal | Page 1490 Table -2: Observations of traffic volume survey with PCU calculations for Mannuthi junction
Start Time Time End
No. Of buses * PCU [PCU
= 3.5]
No. Of cars * pcu [PCU = 1]
No. Of 3-wheelers * PCU [PCU =
0.8]
No. Of 2-wheeler * PCU [PCU =
0.5]
No. Of trucks * PCU [PCU =
3.5]
No. Of cycles * pcu [PCU = 0.2]
Flow in PCU
8 8.15 112 51 64 56 21 1.6 305.6
8.15 8.3 171.5 57 65.6 55.5 17.5 1 368.1
8.3 8.45 196 63 72 56.5 17.5 1 406
8.45 9 203 75 71.2 59.5 17.5 0.6 426.8
9 9.15 210 109 88 96 28 0.8 531.8
Total
2123.4 0.951003225 PHF
9.15 9.3 206.5 124 72 102.5 35 0.8 540.8
9.3 9.45 217 119 82.4 111 28 0.8 558.2
9.45 10 192.5 109 72.8 93 24.5 0.8 492.6
10 10.15 168 108 76 90 31.5 0.6 474.1
10.15 10.3 147 95 62.4 76.5 28 0.8 409.7
10.3 10.45 133 80 63.2 57.5 17.5 0.4 351.6
10.45 11 119 62 60.8 52 14 0.4 308.2
Total 2075.5 1052 850.4 906 280 9.6 5173.5
3 3.15 161 73 64.8 54 31.5 0.4 384.7
3.15 3.3 147 87 57.6 67 42 0.6 401.2
3.3 3.45 175 81 46.4 81 21 1 405.4
3.45 4 182 90 63.2 104 17.5 1.6 458.3
4 4.15 129.5 110 107.2 81.5 28 0.8 457
4.15 4.3 189 127 125.6 108.5 31.5 1.2 582.8
Total 2170.8
PHF 0.931194235
4.3 4.45 143.5 137 117.6 124 31.5 0.6 554.2
4.45 5 168 108 120.8 113.5 21 0.6 531.9
5 5.15 150.5 115 106.4 94 35 1 501.9
5.15 5.3 136.5 117 80.8 55.5 17.5 0.4 407.7
5.3 5.45 168 113 68.8 49 24.5 0.6 423.9
5.45 6 185.5 92 62.4 46 10.5 0.6 397
Total 1935.5 1250 1021.6 978 311.5 9.4 5506
3.1 Risk Severity Survey
Personally approaching 25 experts having adequate experience in PWD projects questionnaires were circulated to get response with respect to the likelihood of occurrence and the impacts associated with each risk based on their experience. The experts were engineers, people in charge of quality assurance / quality control and safety, etc. The mean of the all responses of respective risk likelihoods and their
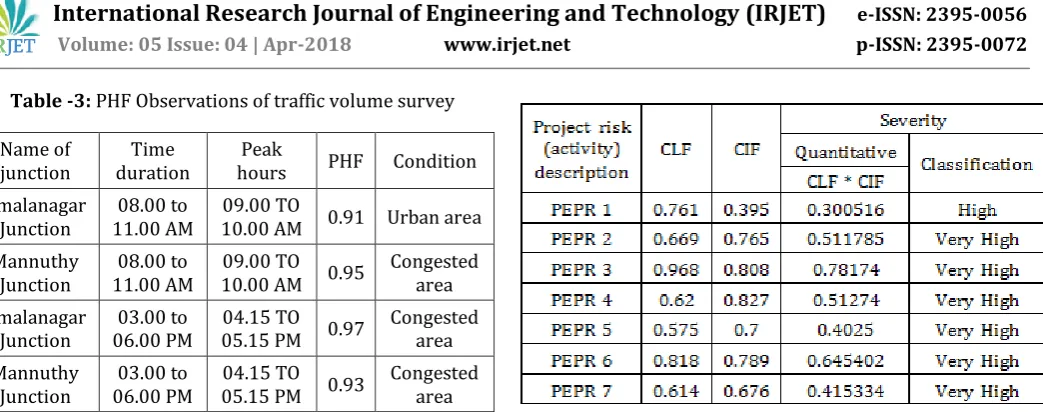
© 2018, IRJET | Impact Factor value: 6.171 | ISO 9001:2008 Certified Journal | Page 1491 Table -3: PHF Observations of traffic volume survey
Name of
junction duration Time hours Peak PHF Condition Amalanagar
Junction 11.00 AM 08.00 to 10.00 AM 0.91 Urban area 09.00 TO Mannuthy
Junction 11.00 AM 08.00 to 10.00 AM 09.00 TO 0.95 Congested area Amalanagar
Junction 06.00 PM 03.00 to 05.15 PM 0.97 04.15 TO Congested area Mannuthy
Junction 06.00 PM 03.00 to 05.15 PM 0.93 04.15 TO Congested area
3.2 Spearman's rank correlation method
Correlation analysis is used to determine the degree of relationship between contractors, engineers and land owners. As the data are irregular, we can use Spearman’s rank correlation coefficient to analyze this. The data collected by government authorities and our group by Spearman’s survey is tabulated in Table 10 and Table 11.
Table -4: Major activities identified in the construction of Amalanagar – Mannuthy bypass
Sl No. Description
1 Survey works
2 Issuance of drawings and other permission from PWD
3 Land acquisition risks 4 Traffic diversion 5 Utility diversion 6 Road widening
7 Barricading board fixing
Table -5: Identification and classification of risks involved in the project
Sl No. Risk classification nomenclature
Risk description
1 PEPR 1 Pre-execution project risk- risks in survey works
2 PEPR 2 Risks in getting drawings and other permission from PWD 3 PEPR 3 Land acquisition risks
4 PEPR 4 Risks in traffic diversion works 5 PEPR 5 Risks in utility diversion works 6 PEPR 6 Risks in road widening
7 PEPR 7 Risks in barricading board fixing
Table -7: Risk severity analysis of total project proposed by our group
Description of project
risk (activity)
CLF CIF
Severity Quantitative
Classification CLF * CIF
PEPR 1 0.761 0.395 0.300516 High
PEPR 2 0.669 0.765 0.511785 Very High
PEPR 3 0.968 0.808 0.78174 Very High
PEPR 4 0.62 0.827 0.51274 Very High
PEPR 5 0.575 0.7 0.4025 Very High
PEPR 6 0.818 0.789 0.645402 Very High
PEPR 7 0.614 0.676 0.415334 Very High
Table -8: Correlation among participants on Importance of risks determined by Government authorities
Engineer Contractor Land owner
Engineer 1
Contractor 0.19 1
Land owner 0.04 0.19 1
Table -9: Correlation among participants on Importance of risks determined by our group
Engineer Contractor Land owner
Engineer 1
Contractor 0.70 1
Land owner 0.55 0.36 1
4. SOLUTION FOR PROBLEM
4.1. Route map proposed by this study
© 2018, IRJET | Impact Factor value: 6.171 | ISO 9001:2008 Certified Journal | Page 1492 unscientific and it causes too many land acquisition
problems. The proposed Mannuthy – Amalanagar bypass road is passing through Viyyur power house junction towards Amalanagar via Viyyur, Pamboor, Kuttur, Chamakkad and Choorakkattukara. As a bypass is meant to connect two highways or two crowded roads, it should be straight for possible extend. Also the route proposed by government authorities has several junctions, intersections and sharp bends which can lead to traffic blocks in the Shornur road as well as in Kottekkad road. Also this is an
[image:5.595.60.548.248.797.2]issue affecting more than 1600 people residing in about 380 houses, about 285 shops, 2 churches, 4 chapels, 2 temples, 3 schools, 4 cooperative societies, a veterinary clinic and a bank. So there are 3 routes proposed with the help of Google map by this Project team with a sub route which will be a perfect solution for these problems. The route proposed by this project team is connecting Amalanagar, Chamakkad, Kuttur, Attore, Kolazhi, RV puram, Nettissery, Mannuthy, where the empty lands are utilised more for the road other than demolition of buildings.
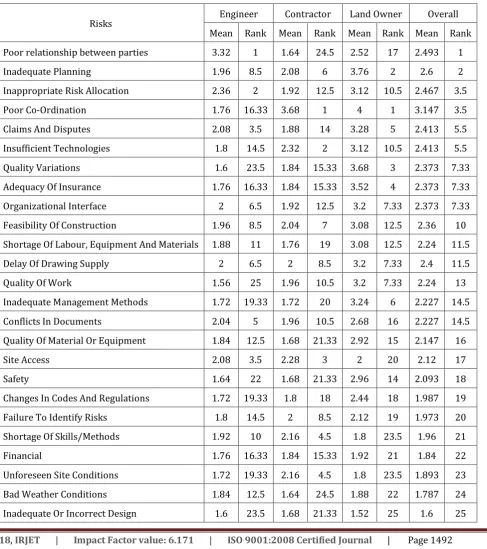
Table -10: Spearman’s survey results and analysis determined by Government authorities
Risks Engineer Contractor Land Owner Overall
Mean Rank Mean Rank Mean Rank Mean Rank
Poor relationship between parties 3.32 1 1.64 24.5 2.52 17 2.493 1
Inadequate Planning 1.96 8.5 2.08 6 3.76 2 2.6 2
Inappropriate Risk Allocation 2.36 2 1.92 12.5 3.12 10.5 2.467 3.5
Poor Co-Ordination 1.76 16.33 3.68 1 4 1 3.147 3.5
Claims And Disputes 2.08 3.5 1.88 14 3.28 5 2.413 5.5
Insufficient Technologies 1.8 14.5 2.32 2 3.12 10.5 2.413 5.5
Quality Variations 1.6 23.5 1.84 15.33 3.68 3 2.373 7.33
Adequacy Of Insurance 1.76 16.33 1.84 15.33 3.52 4 2.373 7.33
Organizational Interface 2 6.5 1.92 12.5 3.2 7.33 2.373 7.33
Feasibility Of Construction 1.96 8.5 2.04 7 3.08 12.5 2.36 10
Shortage Of Labour, Equipment And Materials 1.88 11 1.76 19 3.08 12.5 2.24 11.5
Delay Of Drawing Supply 2 6.5 2 8.5 3.2 7.33 2.4 11.5
Quality Of Work 1.56 25 1.96 10.5 3.2 7.33 2.24 13
Inadequate Management Methods 1.72 19.33 1.72 20 3.24 6 2.227 14.5
Conflicts In Documents 2.04 5 1.96 10.5 2.68 16 2.227 14.5
Quality Of Material Or Equipment 1.84 12.5 1.68 21.33 2.92 15 2.147 16
Site Access 2.08 3.5 2.28 3 2 20 2.12 17
Safety 1.64 22 1.68 21.33 2.96 14 2.093 18
Changes In Codes And Regulations 1.72 19.33 1.8 18 2.44 18 1.987 19
Failure To Identify Risks 1.8 14.5 2 8.5 2.12 19 1.973 20
Shortage Of Skills/Methods 1.92 10 2.16 4.5 1.8 23.5 1.96 21
Financial 1.76 16.33 1.84 15.33 1.92 21 1.84 22
Unforeseen Site Conditions 1.72 19.33 2.16 4.5 1.8 23.5 1.893 23
Bad Weather Conditions 1.84 12.5 1.64 24.5 1.88 22 1.787 24
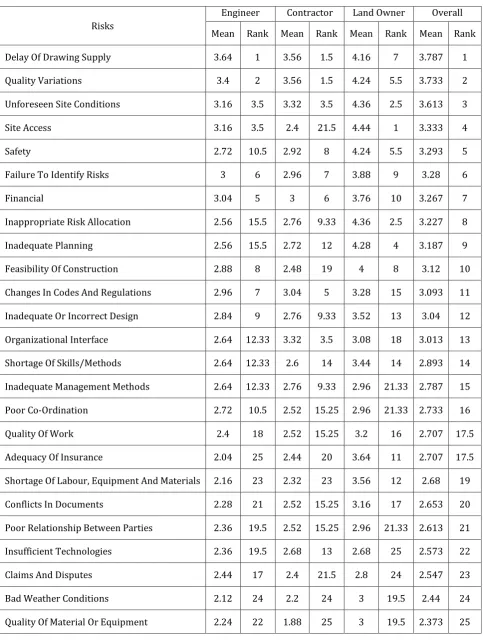
© 2018, IRJET | Impact Factor value: 6.171 | ISO 9001:2008 Certified Journal | Page 1493 Table -11: Spearman’s survey results and analysis determined by our group
Risks
Engineer Contractor Land Owner Overall
Mean Rank Mean Rank Mean Rank Mean Rank
Delay Of Drawing Supply 3.64 1 3.56 1.5 4.16 7 3.787 1
Quality Variations 3.4 2 3.56 1.5 4.24 5.5 3.733 2
Unforeseen Site Conditions 3.16 3.5 3.32 3.5 4.36 2.5 3.613 3
Site Access 3.16 3.5 2.4 21.5 4.44 1 3.333 4
Safety 2.72 10.5 2.92 8 4.24 5.5 3.293 5
Failure To Identify Risks 3 6 2.96 7 3.88 9 3.28 6
Financial 3.04 5 3 6 3.76 10 3.267 7
Inappropriate Risk Allocation 2.56 15.5 2.76 9.33 4.36 2.5 3.227 8
Inadequate Planning 2.56 15.5 2.72 12 4.28 4 3.187 9
Feasibility Of Construction 2.88 8 2.48 19 4 8 3.12 10
Changes In Codes And Regulations 2.96 7 3.04 5 3.28 15 3.093 11
Inadequate Or Incorrect Design 2.84 9 2.76 9.33 3.52 13 3.04 12
Organizational Interface 2.64 12.33 3.32 3.5 3.08 18 3.013 13
Shortage Of Skills/Methods 2.64 12.33 2.6 14 3.44 14 2.893 14
Inadequate Management Methods 2.64 12.33 2.76 9.33 2.96 21.33 2.787 15
Poor Co-Ordination 2.72 10.5 2.52 15.25 2.96 21.33 2.733 16
Quality Of Work 2.4 18 2.52 15.25 3.2 16 2.707 17.5
Adequacy Of Insurance 2.04 25 2.44 20 3.64 11 2.707 17.5
Shortage Of Labour, Equipment And Materials 2.16 23 2.32 23 3.56 12 2.68 19
Conflicts In Documents 2.28 21 2.52 15.25 3.16 17 2.653 20
Poor Relationship Between Parties 2.36 19.5 2.52 15.25 2.96 21.33 2.613 21
Insufficient Technologies 2.36 19.5 2.68 13 2.68 25 2.573 22
Claims And Disputes 2.44 17 2.4 21.5 2.8 24 2.547 23
Bad Weather Conditions 2.12 24 2.2 24 3 19.5 2.44 24
© 2018, IRJET | Impact Factor value: 6.171 | ISO 9001:2008 Certified Journal | Page 1494 4.2. Traffic study analysis and the need of a bypass
through Amalanagar and Mannuthy
As per the traffic volume survey conducted, the traffic conditions at both junctions are of heavy traffic. The peak hour at Amalanagar Junction in the morning is 09.00 to 10.00 AM and in the evening it is 04.15 to 05.15 PM. The peak hours are same at Mannuthy junction also. PHF is of high values that shows congested traffic condition is got from both junctions. So a bypass through another route is necessary to reduce this traffic congestion. There comes the relevance of the Bypass route proposed by this project team.
4.3. Spearman Rank correlation comparison and analysis
Overall, the five most important risks in each route are;
Table -12: Major risks identified in each routes
Major Risks In Gov.
Proposed Route Proposed Y Project Team Major Risks In Route
Poor Relationship
Between Parties Delay Of Drawing Supply Inadequate planning Quality variations Inappropriate risk
allocation Unforeseen site conditions
Poor co-ordination Site access Claims and disputes Safety
From Tables 8 and 9, it is clear that the correlation between different parties is very low in the case of government proposed route. Spearman rank correlation coefficient r between groups show that the risk ranking of engineers have less agreement with contractors (0.19) and land owners (0.04). The correlation between different parties is comparatively very high in the case of route proposed by the project team. The spearman rank correlation coefficient r between groups show that the risk ranking of engineers have significant agreement with contractors (0.70) and land owners (0.55).
4.4. Risk Severity Comparison
From the Tables 6 and 7, it is clear that the route proposed in this study has less risk severity in all the PEPR’s compared to government proposed route.
3. CONCLUSION
It is clear from the traffic volume survey conducted that Amalanagar and Mannuthi junctions are of heavy traffic. As a bypass may reduce the congestions in this junction about 35-55 %, the government authorities decided to construct
(widen up) a bypass through this route, which will connect the places Amalanagar, Chamakkad, Choorakkattukara, Kottekkad, Kuttur, Pampoor, Viyyur, RV puram, Kuttumukk, Nettisseri, Mannuthy. But this route is an unscientific one and it will affect a lot of land owners and religious centres as is clear from the Spearman’s Risk correlation analysis and Risk severity analysis. The route proposed by this project team is connecting Amalanagar, Chamakkad, Kuttur, Attore, Kolazhi, RV puram, Nettissery, Mannuthy, where the empty lands are utilized more for the road other than demolishment of buildings. From the soil investigation result, it is clear that the most of the places in this route doesn’t need any special treatments and they are suitable for road construction. So this proposal will be very helpful for the proper designing of Amalanagar – Mannuthy bypass, without causing unscientific land and building acquisitions.
REFERENCES
[1] Gupta, Venkatnarayan, “Risk variation assessment of
indian road Public-private partnership projects”, 2010
[2] Jannadi O. A., Almishari S., “Risk assessment in
construction”, Journal of construction engineering and management , vol. XVI, 2001, pp.1-34
[3] Kim, Rein Schmidt, “Combination of Project Cost
Forecasts in Earned Value Management”, 2011
[4] PMBOK (2008) guide
[5] Nicholas J. M., “Project Management for Business and
Technology : Principles and practice”, Second edition, Pearson Prentice Hall, New Delhi, 2007
[6] Ward S., Chapman C., “Transforming project risk