© 2017, IRJET | Impact Factor value: 5.181 | ISO 9001:2008 Certified Journal
| Page 1848
ANALYSIS OF RC FRAMED HIGH RISE STRUCTURAL SYSTEM WITH
GROUND AND INTERMEDIATE SOFT STOREY CONSIDERING WIND
EFFECT
1
Sujeet Patil ,
2Prof. Vishwanath B Patil
1
P G Student ,
2Associate Professor
Dept. of civil Engineering, PDACE Kalaburagi-585102
---***---Abstract:
Generally RC framed high rise building structures are designed neglecting the effect of masonary infill walls . Wheras the masonary infill walls are used for partition . The masonary infill walls are treated as non-strucutural elements . RC frame structures having open first storey is known as soft storeyMeanwhile the soft storey located in the upper part of high rise building does not significantly effect the overall performance compared to the performance of the fully infill frame.
The primary purpose of all kinds of structural systems used in building type of structure is to support gravity loads. The most common loads resulting from the effect of gravity are dead load, live load and snow load. Beside this vertical loads building are also subjected to lateral loads caused by wind, earthquake.
Lateral loads can develop high stresses produces sway moment or cause vibration. Therefore, it is very important for the structure to have sufficient strength against vertical loads together with adequate stiffness to resist lateral forces.
Reinforced concrete building structure can be classified are: 1. Structural frame system: The structural system consists of frames, floor slabs, beams and column are the basis elements of structural system. 2. Structural wall system: In this type of structures, all
material members are made of structural walls, generally called shear walls.
Key Words: RC framed building, wind analysis of building, Soft storey, shear walls.
1. INTRODUCTION
In every aspect of human civilization, we needed structures to live in or to get what we need. But it is not only building structure. But to build efficient structure so that it can fulfill the main purpose for what it was made for, here comes the role of civil engineering and more precisely the role of analysis of structure. There are many classical methods to
solve design problem and with time new software also coming into play. Here in this project work recent from based software named ETABS has been used.
2. DESCRIPTION OF STRUCTURAL MODEL
The present plan is of residential building which consist of (G+24) storey.30.5X28.6m
Plan area = 866.8m^2
Built-up area = 611.8m^2
Total height = 85m.
There are 8 flat in each storey.
The ground floor is made for parking with storey height 3m.
There are no flat at 13thstorey with storey height of 3m.
Remaining stories of 3.35m height.
The head room of 2m is provided at the top.
There are 4 different models are analyzed:
Model 1: G+24 with exterior walls at 13thstorey. Model 2: G+24 with 13thstorey as soft storey. Model 3: G+24 with shear walls at 13thstorey. Model 4: G+24 bare model.
Imposed load
: The load assumed to be produced by the intended use or occupancy of a building. Including the weight of movable partitions distributed, concentrated loads, load due to impact and vibration, and dust load but excluding wind, seismic, snow and other loads due to temperatu.re changes, creep, shrinkage, differential settlement, etc.© 2017, IRJET | Impact Factor value: 5.181 | ISO 9001:2008 Certified Journal
| Page 1849
Internal partition load shall be calculated based on type of material and thickness using weight specified by IS: 875(part 1)-1987. The super imposed load or otherwise live load is assessed based on occupancy classification as per IS: 875(part 2)-1987 (TABLE 3).
1. Live load = 2KN/m 2. Floor finish = 1KN/m 3. Wall load
For 3.35m height wall
Density of brick wall = 18kn/m
3.35x0.23x18 = 13.86KN/m (230mm wall) 3.35x.0.1x18 = 6.03KN/m (100mm wall) For 3m height wall
3x18x0.23 = 12.42KN/m (230mm wall) 3x18x0.1 = 5.4KN/m (100mm wall)
Wind exposures parameters:
1. Wind direction angle for x-direction=0 2. Wind direction angle for y-direction=90 3. Wind ward coefficient=0.8
4. Leeward coefficient=0.5 Exposures height: 1. Top story=RF 2. Bottom story=base
Wind coefficients:
1. Wind speed (vb)=44m/s 2. Terrain category=3 3. Structure class=C
4. Risk coefficient (k1 factor) =1 5. Topography (k3 factor) =1
3.
MODELS FOR ANALYSIS Model 1:The model is regular shape 25 storey building with head room of 2m. First storey is ground floor with 3m height.13thstorey is 3m height and remaining storey are of 3.35m height. The lateral force resisting system consist of intercepting moment frames. The floor consist of 125mm of deep concrete and walls are of 230mm and 100mm thickness. Bottom story of 2m provided
Model 2:
The model is regular shape 25 storey building with head room of 2m. First storey is ground floor with 3m height.13thstorey is soft story with intermediate 3m height and remaining storey are of 3.35m height. The lateral force resisting system consists of intercepting moment frames. The floor consists of 125mm of deep concrete and walls are of 230mm and 100mm thickness. Bottom story of 2m provided
Model 3:
The model is regular shape 25 storey building with head room of 2m. First storey is ground floor with 3m height.13thstorey is made up of shear walls of thickness 230mm 3m height and remaining storey are of 3.35m height. The lateral force resisting system consists of intercepting moment frames. The floor consists of 125mm of deep concrete and walls are of 230mm and 100mm thickness. Bottom story of 2m provide.
Model 4:
The model is skeleton model with regular shape 25 storey building with head room of 2m. First storey is ground floor with 3m height.13thstorey is3m height and remaining storey are of 3.35m height. The lateral force resisting system consists of intercepting moment frames. The floor consists of 125mm of deep concrete.
© 2017, IRJET | Impact Factor value: 5.181 | ISO 9001:2008 Certified Journal
| Page 1850
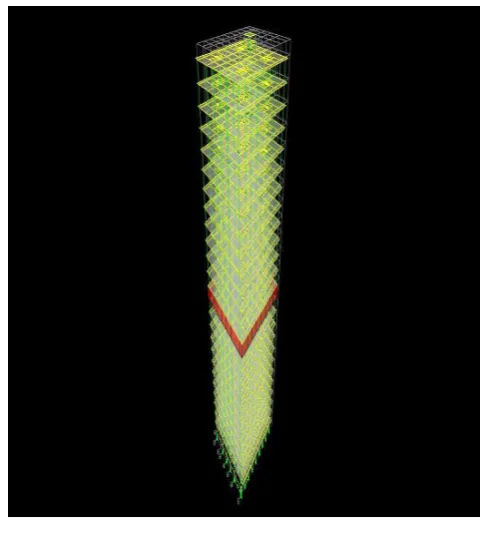
3D View of building model 3
4.
RESULTS AND DISCUSSIONS
To study the effect of drift and displacement total of four models are analysed for forces generated by wind.
4.1 Storey
Displacement.
Displacement-x
story model1 model2 model3 model4
1 3.608 3.614 3.61 3.614
[image:3.595.39.285.96.367.2]2 7.761 7.744 7.765 7.774 3 12.158 12.177 12.158 12.177 4 16.546 16.572 16.54 16.572 5 20.846 20.878 20.83 20.878 6 25.027 25.654 24.997 25.065 7 29.071 29.115 29.022 29.115 8 32.968 33.017 32.891 33.071 9 36.707 36.764 36.579 36.761 10 40.277 40.336 40.032 40.336 11 43.665 43.728 43.072 43.728 12 46.834 46.902 45.082 46.902 13 49.423 49.495 45.404 49.495 14 52.235 52.31 47.117 52.31 15 54.898 54.97 49.419 54.97 16 57.359 57.44 51.756 57.44 17 59.624 59.709 53.95 59.709 18 61.268 61.77 55.967 61.77 19 63.529 63.619 57.773 63.619 20 65.162 65.254 59.367 65.254 21 66.577 66.671 60.744 66.671 22 67.772 67.868 61.902 67.668 23 68.75 68.846 62.842 68.846 24 69.517 69.614 63.57 69.614 25 70.111 70.209 64.128 70.209
Table 5: comparision of values of displacements in x-direction .
Fig 5: Displacements v/s model in x-direction.
1. From table no 7 ,it is observed that the displacement is maximum at roof level in which the displacement is maximum for model 2 & minimum for model 3. 2. For 13th storey the maximum displacement is for model
[image:3.595.311.563.493.655.2]© 2017, IRJET | Impact Factor value: 5.181 | ISO 9001:2008 Certified Journal
| Page 1851
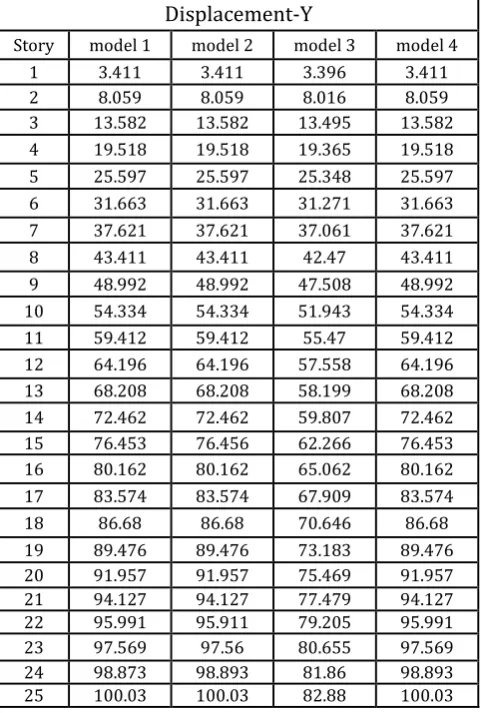
Displacement-Y
[image:4.595.37.278.102.459.2]Story model 1 model 2 model 3 model 4 1 3.411 3.411 3.396 3.411 2 8.059 8.059 8.016 8.059 3 13.582 13.582 13.495 13.582 4 19.518 19.518 19.365 19.518 5 25.597 25.597 25.348 25.597 6 31.663 31.663 31.271 31.663 7 37.621 37.621 37.061 37.621 8 43.411 43.411 42.47 43.411 9 48.992 48.992 47.508 48.992 10 54.334 54.334 51.943 54.334 11 59.412 59.412 55.47 59.412 12 64.196 64.196 57.558 64.196 13 68.208 68.208 58.199 68.208 14 72.462 72.462 59.807 72.462 15 76.453 76.456 62.266 76.453 16 80.162 80.162 65.062 80.162 17 83.574 83.574 67.909 83.574 18 86.68 86.68 70.646 86.68 19 89.476 89.476 73.183 89.476 20 91.957 91.957 75.469 91.957 21 94.127 94.127 77.479 94.127 22 95.991 95.911 79.205 95.991 23 97.569 97.56 80.655 97.569 24 98.873 98.893 81.86 98.893 25 100.03 100.03 82.88 100.03
Table 5: comparision of values of displacements in x-direction.
Fig 5: Displacements v/s model in y-direction.
1.
From table no 8 ,it is observed that the displacement is maximum at roof level in which the displacement is maximum for model 2 & minimum for model 3.2.For 13th storey the maximum displacement is for model 2 & 4, but in model 3 displacement get reduced to 9% due to shear wall.
4.2 Storey Drift.
DRIFT X
Store [image:4.595.288.560.108.500.2]y MODEL 1 MODEL 2 MODEL 3 MODEL 4 1 0.000951 0.00095 0.00095 0.000951 2 0.00124 0.00124 0.00124 0.00124 3 0.00131 0.00134 0.00124 0.00131 4 0.00131 0.00131 0.00131 0.00131 5 0.00128 0.00129 0.00131 0.00129 6 0.00125 0.00125 0.00124 0.00125 7 0.00121 0.00121 0.0012 0.00121 8 0.00116 0.00117 0.00116 0.00117 9 0.00116 0.00112 0.0011 0.00112 10 0.00107 0.00107 0.00103 0.00107 11 0.00101 0.00101 0.00091 0.00101 12 0.00095 0.00095 0.0006 0.00095 13 0.00086 0.00086 0.00013 0.00086 14 0.00084 0.00084 0.00049 0.00084 15 0.00079 0.00079 0.00069 0.00079 16 0.00074 0.00074 0.0007 0.00074 17 0.00068 0.00068 0.00066 0.00068 18 0.00061 0.00062 0.0006 0.00062 19 0.00055 0.00055 0.00054 0.00055 20 0.00049 0.00049 0.00048 0.00049 21 0.00042 0.00042 0.00041 0.00042 22 0.00035 0.00036 0.00035 0.00036 23 0.00029 0.00029 0.00028 0.00029 24 0.00023 0.00023 0.00028 0.00023 25 0.00018 0.00018 0.00017 0.00018
Table 7: Comparision of values of Drift along X-direction .
[image:4.595.39.285.491.660.2] [image:4.595.307.564.530.708.2]© 2017, IRJET | Impact Factor value: 5.181 | ISO 9001:2008 Certified Journal
| Page 1852
1. From table no 9 ,it is observed that the drift is maximum at 3rd storey in which the driftt is maximum for model 2 & minimum for model 3.
2. For 13th storey the maximum drift is for model 2 & 4, but in model 3 drift get reduced to 84% due to shear wall. 3. Due to shear wall there is sudden reduction in the drift.
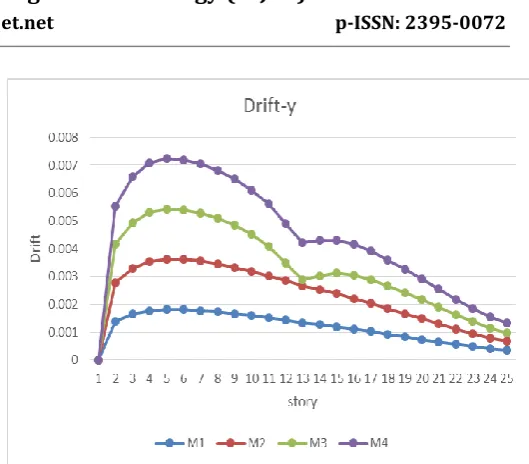
DRIFT Y
STOREY MODEL 1 MODEL 2 MODEL 3 MODEL 4
1 0.00139 0.00139 0.00138 0.00139 2 0.00165 0.00165 0.00164 0.00165 3 0.00177 0.00177 0.00175 0.00177 4 0.00182 0.00182 0.00179 0.00182 5 0.00181 0.00181 0.00177 0.00181 6 0.00178 0.00178 0.00172 0.00178 7 0.00173 0.00173 0.00163 0.00173 8 0.00167 0.00167 0.0015 0.00167 9 0.0016 0.0016 0.00132 0.0016 10 0.00151 0.00152 0.00105 0.00152 11 0.00143 0.00143 0.00062 0.00143 12 0.00134 0.00134 0.00021 0.00134 13 0.00127 0.00127 0.00048 0.00127 14 0.00119 0.00119 0.00073 0.00119 15 0.00111 0.00111 0.00084 0.00111 16 0.00102 0.00102 0.00085 0.00102 17 0.00093 0.00093 0.00082 0.00093 18 0.00083 0.00083 0.00076 0.00083 19 0.00074 0.00075 0.00068 0.00074 20 0.00065 0.00065 0.0006 0.00065 21 0.00056 0.00056 0.00052 0.00056 22 0.00047 0.00047 0.00043 0.00047 23 0.0004 0.0004 0.00036 0.0004
[image:5.595.305.570.60.292.2]24 0.00034 0.00034 0.0003 0.00034
Table 7: Comparision of values of Drift along y-direction .
Fig 7: Drift values v/s models along y-direction
1. From table no 10 ,it is observed that the drift is maximum at 3rd storey in which the driftt is maximum for model 2 & minimum for model 3.
2. For 13th storey the maximum drift is for model 2 & 4, but in model 3 drift get reduced to 84% due to shear wall. 3. Due to shear wall there is sudden reduction in the drift.
CONCLUSIONS:
1. Displacement slightly decreases when concrete shear wall is considered.
2. Storey drifts are found within permissible limit as specified by IS 875 PART 3 1987.
3. The drift in X- direction is slightly increases and then goes on decreasing for model 1&2.
4. Drift in model 3 is decreasing at 13 storey and then slightly increasing due to shear wall.
5. Drift in model 3 is lesser compared to other models.
6. A service storey of lesser height can be safer at higher altitude in tall buildings as long as it is properly managed.
7. If brick wall is replaced by shear wall the maximum bending moment will get reduced to more than 50%.
8. If brick wall replaced by shear wall the maximum shear force will get reduced to more than 50%.
9. Shear wall will provide higher rigidity than normal brick wall.
© 2017, IRJET | Impact Factor value: 5.181 | ISO 9001:2008 Certified Journal
| Page 1853
REFERENCES
1. Jawad ahmed and H S vidyadhar (2013) “wind
analysis and design of multi bay multi storey 3D RC Frame “international journal of Engg
research and technology, volume.2 issue 9, September 2013.
2. Chandradhara G.P, Vikram M.B(2012) “Effect of
wind load on the aspect ratio of the building” IOSR journal of mechanical and civil
engineering. PP 45-49.
3. IS 875-part3(1987) Indian standard code of practice for design wind loads.
4. IS 456:2000. “Indian standard code of practice for plain and reinforced concrete”, Bureau of Indian standards, New Delhi.
5. S.Ramamurutham & Narayan theory of structures. 6. Basic structural analysis by Reddy C.S.
7. www.csiberkeley.com