Maternal diet–induced microRNAs and mTOR
underlie
bb
cell dysfunction in offspring
Emilyn U. Alejandro, … , Peter Arvan, Ernesto
Bernal-Mizrachi
J Clin Invest. 2014;
124(10)
:4395-4410.
https://doi.org/10.1172/JCI74237
.
A maternal diet that is low in protein increases the susceptibility of offspring to type 2
diabetes by inducing long-term alterations in
b
cell mass and function. Nutrients and growth
factor signaling converge through mTOR, suggesting that this pathway participates in
b
cell
programming during fetal development. Here, we revealed that newborns of dams exposed
to low-protein diet (LP0.5) throughout pregnancy exhibited decreased insulin levels, a lower
b
cell fraction, and reduced mTOR signaling. Adult offspring of LP0.5-exposed mothers
exhibited glucose intolerance as a result of an insulin secretory defect and not
b
cell mass
reduction. The
b
cell insulin secretory defect was distal to glucose-dependent Ca
2+influx
and resulted from reduced proinsulin biosynthesis and insulin content. Islets from offspring
of LP0.5-fed dams exhibited reduced mTOR and increased expression of a subset of
microRNAs, and blockade of microRNA-199a-3p and -342 in these islets restored mTOR
and insulin secretion to normal. Finally, transient
b
cell activation of mTORC1 signaling in
offspring during the last week of pregnancy of mothers fed a LP0.5 rescued the defect in the
neonatal
b
cell fraction and metabolic abnormalities in the adult. Together, these findings
indicate that a maternal low-protein diet alters microRNA and mTOR expression in the
offspring, influencing insulin secretion and glucose homeostasis.
Research Article
Endocrinology
Find the latest version:
Introduction
The pervasiveness of type 2 diabetes (T2D) is a major public health concern worldwide. The elevated prevalence of this disease results in part from an increased rate of obesity in individuals with genetic predisposition for T2D. Genetic studies have demonstrated that known variants account for less than 10% of the estimated over-all genetic contribution to T2D predisposition, suggesting that additional unidentified factors contribute to susceptibility of this disease (1, 2). The fetal nutrient environment has been proposed as another component that might modify the risk for developing diabetes later in life (3). There is increasing evidence that altera-tions in fetal nutrients not only affect fetal/infant growth but also promote a “thrifty phenotype” that increases the subsequent risk of metabolic syndrome, obesity, and T2D (4). Indeed, maternal malnutrition during pregnancy is known to predispose offspring to adult-onset metabolic disorders such as T2D (3). Such adverse outcomes point to the importance of optimal nutrition during pregnancy for maintaining the long-term function of key
meta-bolic tissues, such as pancreatic β cells. Animal studies in rodents
demonstrate that the protein supply during pregnancy plays a key
role in the development of β cells (5–7). Thus, the offspring of rats
fed a low-protein diet during gestation, a model of intrauterine
growth restriction (IUGR), exhibit reduced neonatal β cell
pro-liferation, islet size, and vasculature (6) as well as impaired glu-cose tolerance in adulthood (7). Despite a considerable number of
studies focused on this topic, how the fetal nutrient environment
induces permanent changes in the structure or function of β cells
(β cells programming) remains unclear (8).
Presently, there are few studies defining the molecular
mech-anisms responsible for β cell programming during development.
Available mechanistic studies from islets of various animal models of IUGR suggest that critical transcription factors are permanently modified. For example, maternal protein restriction has been shown to alter the methylation status of the Hnf4a promoter (9). Intra-uterine artery ligation, a model of placental insufficiency, leads to changes in both DNA methylation and histone acetylation of the
Pdx1 promoter (10). In addition to these key transcription factors
important for β cell development, reduced insulin-like growth factor
II has also been implicated as playing a role in the alteration of islet cell replication and survival in low-protein-fed offspring (11). These
data suggest that the underlying mechanisms of β cell programming
are complex and multifactorial. To date, the signaling events linking nutrient status to these alterations are not completely understood.
Both human IUGR patients and murine models of protein restriction have demonstrated decreased placental leucine transport and reductions in essential amino acids in dams (12, 13). Dietary leucine supplementation attenuates fetal growth restriction due to a low-protein diet in rats (14). We postulated that protein restriction in dams results in reduced fetal amino acid levels in the fetuses, which may contribute to altered
met-abolic programming of developing β cells. The mechanistic
target of rapamycin (mTOR) signaling pathway is one of the main mediators of the cellular response to changes in nutrients, including amino acids. mTOR exists in 2 multiprotein complexes
A maternal diet that is low in protein increases the susceptibility of offspring to type 2 diabetes by inducing long-term alterations in β cell mass and function. Nutrients and growth factor signaling converge through mTOR, suggesting that this pathway participates in β cell programming during fetal development. Here, we revealed that newborns of dams exposed to low-protein diet (LP0.5) throughout pregnancy exhibited decreased insulin levels, a lower β cell fraction, and reduced mTOR signaling. Adult offspring of LP0.5-exposed mothers exhibited glucose intolerance as a result of an insulin secretory defect and not β cell mass reduction. The β cell insulin secretory defect was distal to glucose-dependent Ca2+ influx and resulted from
reduced proinsulin biosynthesis and insulin content. Islets from offspring of LP0.5-fed dams exhibited reduced mTOR and increased expression of a subset of microRNAs, and blockade of microRNA-199a-3p and -342 in these islets restored mTOR and insulin secretion to normal. Finally, transient β cell activation of mTORC1 signaling in offspring during the last week of pregnancy of mothers fed a LP0.5 rescued the defect in the neonatal β cell fraction and metabolic abnormalities in the adult. Together, these findings indicate that a maternal low-protein diet alters microRNA and mTOR expression in the offspring, influencing insulin secretion and glucose homeostasis.
Maternal diet–induced microRNAs and mTOR underlie
β
cell dysfunction in offspring
Emilyn U. Alejandro,1 Brigid Gregg,2 Taylor Wallen,1 Doga Kumusoglu,1 Daniel Meister,1 Angela Chen,1 Matthew J. Merrins,3
Leslie S. Satin,3 Ming Liu,1 Peter Arvan,1 and Ernesto Bernal-Mizrachi1,4
1Department of Internal Medicine, Division of Metabolism, Endocrinology and Diabetes, Brehm Center for Diabetes Research, 2Department of Pediatrics, and 3Department of Pharmacology,
University of Michigan, Ann Arbor, Michigan, USA. 4VA Ann Arbor Healthcare System, Ann Arbor, Michigan, USA.
Conflict of interest: The authors have declared that no conflict of interest exists. Submitted: November 12, 2013; Accepted: July 24, 2014.
data indicate that mTORC1 signaling is essential for attenuating
β cell dysfunction induced by maternal low-protein diet.
Results
Newborns of dams fed LP0.5 have normal body weight but reduced insulin levels. To elucidate the mechanisms underlying the
phe-notype of maternal low-protein offspring, we developed a murine model of maternal low-protein exposure using the C57BL/6 strain, as illustrated in Figure 1A. Dams fed control diet (Ctrl) and low-protein diet (LP0.5) throughout pregnancy had similar body weights during the adaptation period (days 0–30) and sim-ilar weight gain throughout pregnancy (days 0.5–16 of pregnancy) and after pregnancy (days 1–15 after pregnancy, Figure 1B). LP0.5 feeding during pregnancy did not affect maternal random glucose levels, which were assessed during the second week of pregnancy (Figure 1C). No significant differences were found in litter size at birth or at weaning (P1 and P21, Figure 1, D and E). Additionally, the length of gestation was not different between cohorts (data not shown). These results are consistent with a previously described murine model (20). To characterize the phenotype of maternal protein-restricted offspring (LP0.5), we measured body weight and length as well as the blood glucose levels of LP0.5 neonates. No significant differences in body weight were detected between newborns of dams fed LP0.5 (referred to as LP0.5 newborns) and controls (Figure 1F). Interestingly, a significant decrease in body length was detected in LP0.5 newborn offspring compared with that in control newborns (Figure 1G). Although no difference in blood glucose levels was detected, a significant reduction in insu-lin levels was observed in the LP0.5 newborns (Figure 1, H and I). that have distinct biological functions (mTORC1 and mTORC2)
and couples signals from amino acids and growth factors to the regulation of cell cycle progression, cell fate, and cell growth.
mTOR signaling has been shown to regulate β cell mass and
function (15–18) as well as β cell development (19). However, the
mechanisms by which the nutrient environment during fetal life
modulates mTOR signaling and β cell development to alter the
susceptibility to diabetes are unknown.
In the present study, we used a maternal low-protein murine model to delineate the mechanisms that regulate programming
of neonatal β cell fraction and function and subsequent
diabe-tes susceptibility in adult life. First, we demonstrated that off-spring of low-protein diet–fed (LP0.5-fed) dams have reduced mTOR signaling that was associated with reduced neonatal
β cell fraction and insulin levels. Adult offspring of dams fed
LP0.5 (referred to as LP0.5 offspring) exhibited impaired
glu-cose tolerance due to β cell dysfunction and not to a defect in
β cell mass. These alterations in insulin secretion resulted in part
from a reduction in mTOR protein levels as a result of enhanced expression of specific microRNAs (miRs) in LP0.5 islets. Inhibi-tion of these miRs in turn normalized both mTOR protein levels and insulin dysfunction in the islets of low-protein-fed offspring. Finally, we used genetically modified mice to rescue the
neona-tal β cell fraction and metabolic phenotype of low-protein-fed
[image:3.585.40.537.57.287.2]offspring by increasing mTORC1 function only during develop-ment. Mice overexpressing Rheb protein, an established positive regulator of mTORC1 signaling, during the last week of gestation ameliorated the glucose intolerance and impaired insulin secre-tion of adult mice exposed to maternal low-protein diet. These
Figure 1. Maternal low-protein diet model and phenotypes of newborn offspring. (A) Pregnant C57BL/6 mice were exposed to diets, Ctrl (23% protein)
or LP0.5 (isocaloric and 9% protein), throughout pregnancy. After delivery, LP0.5 and Ctrl dams and offspring were introduced to Ctrl. Pancreata were collected at birth and on P84. Metabolic studies of male and female LP0.5 and Ctrl offspring were conducted between day 42 and 84. (B) Maternal body
weight during the adaptation period (D0–D30), during pregnancy (P.05–P16), and after pregnancy (PP1–PP15). (C) Maternal fed glucose levels of LP0.5 and
Ctrl dams on pregnancy day 15. (D and E) Litter size on P1 (D) and P21 (E). (F and G) Newborn body weight (F) and body length (G). (H and I) Newborn blood
on glucose homeostasis, we performed glucose tolerance test-ing. Impaired glucose tolerance was present in 5-week-old male and female LP0.5 mice compared with controls (Figure 2, I and J). The effects of LP0.5 on glucose tolerance coupled with the reduced fasting insulin levels seen in the female mice suggest that LP0.5 mice were more insulin sensitive than controls. Indeed, insulin tolerance tests revealed that male and female LP0.5 mice were more insulin sensitive than control mice (Fig-ure 2, K and L). Thus, these studies demonstrated that low-pro-tein diet during pregnancy resulted in impaired glucose toler-ance and enhtoler-anced insulin sensitivity in 6-week-old offspring.
LP0.5 adult offspring exhibit impaired glucose tolerance and enhanced insulin sensitivity. The fed glucose levels of 4-week-old
[image:4.585.45.409.58.588.2]LP0.5 male and female offspring were elevated compared with those of controls (Figure 2, A and E). No differences, however, were detected in the corresponding fed insulin levels of either male or female groups (Figure 2, C and G). In the fasting state, 4-week-old LP0.5 male and female mice exhibited fasting glu-cose levels comparable to those of the controls (Figure 2, B and F), while a significant reduction in fasting insulin was detected in the LP0.5 female, but not male, mice compared with controls (Figure 2, D and H). To further determine the impact of LP0.5
Figure 2. LP0.5 adult offspring exhib-ited impaired glucose tolerance and enhanced insulin sensitivity. (A, B, E,
and F) Fed or fasting glucose levels in
4-week-old male (A and B) and female
(E and F) LP.05 and Ctrl mice. (C, D, G,
and H) Fed or fasting insulin levels in
4-week-old male (C and D) and female
(G and H) LP.05 and Ctrl mice. (I–L)
Intra-peritoneal glucose and insulin tolerance tests were performed in 5- and 6-week-old male (I and K) and female (J and L)
of an insulin secretory defect and a reduction in insulin content. In addition, KCl-induced insulin secretion was also significantly reduced (Figure 4F). This secretory defect in LP0.5 islets was not due to alterations in the frequency or amplitude of
glucose-stimu-lated intracellular Ca2+ oscillations (Figure 4, G–J). Taken together,
these data demonstrate that the nutritional insult experienced during development induced long-lasting defects in stimulus-se-cretion coupling. These consequences appeared to occur distal
to Ca2+ entry at the level of either the exocytosis machinery or in
insulin biosynthesis.
LP0.5 exposure during pregnancy alters Ins2 and Pdx1 mRNA and
β cell insulin content in adult mice. We hypothesized that reduced
insulin content could also play a role in the abnormalities we observed in insulin secretion. A reduction in insulin content was observed in both male and female islets isolated from the LP0.5 mice (Figure 5, A and B). To determine the mechanisms underlying this, the transcript levels of the insulin 1 and 2 genes (Ins1 and Ins2) were measured by quantitative real-time PCR. Indeed, an approx-imately 50% reduction in Ins2 mRNA was evident, with no change in Ins1 levels, in LP0.5 islets compared with controls (Figure 5, C and D). This Ins2 mRNA change was associated with decreased proinsulin biosynthesis in LP0.5 islets after a 10-minute pulse labeling (Supplemental Figure 2, A–C; supplemental material available online with this article; doi:10.1172/JCI74237DS1). However, no changes in insulin processing were observed (Sup-plemental Figure 2D). Next, we examined the gene expression of transcription factors that are known to modulate insulin biosyn-thesis, and we observed a significant reduction in Pdx1 mRNA in the islets of LP0.5 mice compared with that in controls (Figure 5E). These changes in Pdx1 were accompanied by reduced Pdx1 pro-tein, which may partially explain the reduced level of insulin con-tent in the LP0.5 mice (Figure 5, F and G). Mafa mRNA expression and protein levels were not altered in LP0.5 islets compared with controls (Supplemental Figure 1, A–C). Interestingly, no changes in Neurod1, Hnf1a, Hnf4a, Tcf2, Igf2, and glucokinase (Gkc) mRNA were observed in LP0.5 islets (Figure 5, H–M). Transcriptional regulation of Ins1 has been shown to be selectively controlled by
LP0.5 offspring exhibit abnormal neonatal β cell fraction. The
combination of glucose intolerance, despite increased insulin sen-sitivity, in LP0.5 mice suggested a defect in functional pancreatic
β cell mass. To determine the impact of LP0.5 on β cell
develop-ment and mass, we assessed β cell morphology at different stages.
To determine abnormalities in the β cell/pancreas ratio, we
exam-ined pancreata from newborn LP0.5 mice. Due to the inherent inaccuracy in measuring pancreatic weight in neonates, we
mea-sured β cell/pancreas area ratio and not β cell mass. LP0.5
new-borns had a significant reduction in β cell/pancreas ratio (fraction)
and β cell proliferation, as measured by Ki67 staining (Figure 3, A
and B). Although it was not significant, there was a trend toward an alteration in the average number of islets per pancreas section
(Figure 3C). No differences in the average β cell number per islets
were observed (Figure 3D). Alterations in neonatal β
cell/pancre-atic ratio were not observed in 3-month-old male and female LP0.5 mice compared with controls (Figure 3, E and F). When account-ing for pancreas weight, no significant differences were found in
β cell mass in adult male or female LP0.5 mice (Figure 3, G and H).
These data indicate that exposure to LP0.5 during development alters endocrine cell development, resulting in abnormalities in
the neonatal β cell/pancreas ratio that appear to recover after
ade-quate postnatal nutrition is supplied.
LP0.5 adult offspring have an insulin secretion defect that is distal to Ca2+ signaling. The abnormalities in glucose tolerance in
the presence of enhanced insulin sensitivity and β cell mass in
12-week-old LP0.5 offspring suggested that stimulus-secretion coupling or insulin biosynthesis could be perturbed (Figure 4,
A and B). The capacity of β cells to secrete insulin in response to
glucose in vivo was blunted in 3-month-old LP0.5 mice compared with that in controls (Figure 4C). To corroborate these in vivo find-ings, and to remove the possible influence of hormonal and
neu-ronal stimuli, the glucose dependence of intracellular Ca2+ and
[image:5.585.39.355.55.273.2]insulin secretion was next assessed in isolated LP0.5 islets in vitro. Glucose-induced insulin secretion in LP0.5 islets was reduced despite having less insulin content (Figure 4, D and E). There-fore, the defect in insulin secretion results from a combination
Figure 3. LP0.5 offspring exhibit abnormal neo-natal β cell fraction. (A) β Cell/pancreas area in newborn LP0.5 and Ctrl mice. (B) β Cell proliferation, as measured by Ki67 staining, in newborn LP0.5 and Ctrl mice. (C) Average number of islets per pancreas
in LP0.5 and Ctrl mice at birth. (D) Average β cell number per islet in LP0.5 and Ctrl mice at birth. (E
and F) Normalized β cell/pancreas area in 3-month-old male (E) or female (F) LP0.5 and Ctrl mice. (G and H) β Cell mass in 3-month-old male (G) or female (H)
ciated with alterations in global protein synthesis in LP0.5 islets (Supplemental Figure 2E). As expected, the reduction in mTOR protein levels was also associated with decreased phosphorylation of ribosomal protein S6 at Ser240 in adult LP0.5 islets, suggesting that mTOR complex 1 (mTORC1) activity was decreased (Figure 6, F and G). Nonendocrine pancreas lysates showed increased mTOR levels, while liver lysates had normal mTOR levels (Supplemen-tal Figure 1, C–G). A trend toward decreased phosphorylation of ERK1/2 in LP0.5 islets lysates was also observed (Figure 6, F and H), which may independently contribute to the reduced insulin transcription we saw in LP0.5 mice. Phosphorylation of AKT at Ser473, a known target of mTORC2, was also altered in islets taken from LP0.5 mice (Figure 6, F and I). Together, these data suggest that LP0.5 mice have a sustained downregulation of mTOR protein, resulting a decrease in the activity of mTORC1 and mTORC2 in the adult offspring of dams fed a low-protein diet.
LP0.5 exposure during pregnancy regulates mTOR signaling in adult mice by altering specific miRs. To elucidate the
mecha-nisms underlying the reduction of mTOR protein we observed,
NeuroD1 in adult β cells (21), which may explain why Ins1 mRNA
levels were unaltered in the LP0.5 mice. Taken collectively, the data suggest that glucose intolerance in LP0.5 offspring is caused, at least in part, by defective insulin secretion and reduced insulin content. The reduction in insulin content results from decreased proinsulin biosynthesis secondary to alterations in Pdx1 levels and
Ins2 gene transcription.
LP0.5 exposure during pregnancy decreases mTOR signaling in neo-natal and adult β cells. To determine the effects of maternal
low-pro-tein diet on mTORC1 signaling, we performed immunostaining for phosphorylated ribosomal protein S6 at Ser240 and insulin in new-born islets. We observed a reduction in phosphorylated S6 at Ser240
in LP0.5 newborn β cells (Figure 6A), suggesting that LP0.5
expo-sure reduced mTORC1 activity in β cells at birth. Next, we
deter-mined the extent to which the alterations in mTOR signaling that we observed in LP0.5 neonates persisted in LP0.5 adults. Indeed, total mTOR protein levels were reduced in the islets of 3-month-old LP0.5 females and males compared with those in controls (Figure 6, B–E). However, this decrease in mTOR expression was not
asso-Figure 4. LP0.5 adult offspring have insulin secretion defect that is distal to calcium signaling. (A and B) Intraperitoneal glucose tests (A) and insulin
tolerance tests (B) in 12-week-old male LP0.5 and Ctrl mice. (C) In vivo glucose-stimulated insulin secretion in 12-week-old male LP0.5 and Ctrl mice.
(D) Glucose-stimulated insulin secretion in isolated islets from adult LP0.5 and Ctrl mice in response to 2 mM and 16 mM glucose. Secreted insulin was
normalized to total content. (E) Total islet insulin content in D was measured and normalized to total islet DNA. (F) Insulin secretion in response to 30
mM KCl. (G and H) Representative recordings of intracellular calcium are shown in islets isolated from Ctrl or LP0.5 mice stimulated with 8 mM (8G) and 11
mM glucose (11G). (I) Average oscillatory period was determined by fast Fourier transform (FFT) from >20 minutes of recording. Numbers on bars indicate
[image:6.585.76.511.53.392.2]we assessed mTOR mRNA levels, and no significant changes in
mTOR transcript expression were observed, suggesting that the
defect in mTOR protein levels in LP0.5 is posttranscriptional (Figure 7A). Because miRs play an important role in regulating key genes at the posttranscriptional level, we investigated the role of miRs on regulation of mTOR in 3-month-old LP0.5 mice. To identify miRs differentially expressed in islets of LP0.5 offspring, we pursued (a) a candidate-based screen for miRs that regulate mTOR and (b) an unbiased approach using a PCR-based array. miR-7, -99, and -199a-3p have previously been demonstrated to regulate mTOR signaling or mTOR protein directly in multiple tissues (22–25). Assessment of these miRs revealed that miR-7 and -199a-3p were significantly increased in adult LP0.5 islets compared with controls (Figure 7, B and D). However, no changes in miR-99 were observed in LP0.5 islets compared with controls (Figure 7C). Next, we analyzed 720 miRs in islets from LP0.5 and control mice using a real-time PCR-based microarray (OpenArray microarray) in order to discover novel miRs that might drive the
β cell programming effect we observed in LP0.5 offspring. Among
the 720 miRs we measured, approximately 537 showed readable values in islets. Of these, only 14 were significantly altered; 2 were increased (Table 1), and 12 were reduced (Table 2). miR-152 and -342 were increased in the microarray. miR-7 and -199a-3p, which were selected from the candidate approach, were increased in the microarray but did not reach significance (with fold changes of 1.91 and 2.36, respectively). Although expression of miR-7a has
previously been reported in islets, expression of miR-152, -199a-3p, and -342 in islets is presented here for the first time. One common target of miR-7, -199a-3p, and -152 is mTOR signaling (22, 24, 26). However, computational predictions using miRGen Targets (27) (intersection of Pictar and TargetScanS prediction programs) indicate that miR-152 and -342 may also target mul-tiple proteins regulating transport, GTPase activators, and actin polymerization and binding, the combined effect of which may play a role in insulin secretion.
miR-199a-3p and -342 regulate mTOR protein levels and insulin secretion in β cells. To delineate the mechanisms responsible for
mTOR reduction and insulin secretory dysfunction in islets of LP0.5 offspring, we carried out further investigations of the effects of miR-199a-3p and -342. We focused on miR-199a-3p, because it
has recently been shown to directly bind to the mTOR 3′ UTR and
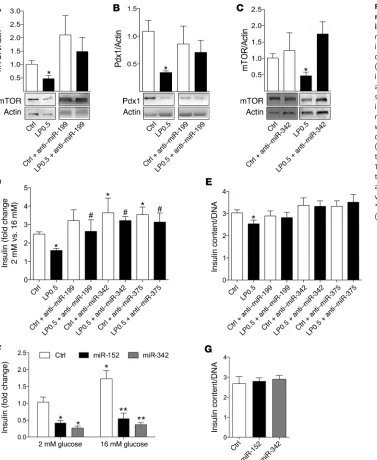
[image:7.585.44.436.50.406.2]affect mTOR protein levels but not mRNA expression (24). To test whether miR-199a-3p could regulate the expression of endoge-nous mTOR, a miR-199a-3p inhibitor (anti–miR-199a-3p) was transfected into dispersed islet cells isolated from adult LP0.5 and control offspring. Thirty-six hours after transfection, anti–miR-199a-3p was found to normalize mTOR and Pdx1 protein levels in LP0.5 islets to control levels (Figure 8, A and B). A nonsignifi-cant increase in mTOR protein levels in control cells transfected with anti–miR-199a-3p (P = 0.07) was also observed. Blocking miR-199a-3p in dispersed human islet cells also increased mTOR protein levels (Supplemental Figure 3, A and B). Subsequently,
Figure 5. LP0.5 exposure during pregnancy alters Ins2 and Pdx1 mRNA and β cell insulin content in adult mice. (A and B) Insulin content was determined
and normalized to total islet DNA in 12-week-old female (A) and male (B) LP0.5 and Ctrl mice. (C and D)
Quantitative PCR was performed on isolated mRNA from 12-week-old male LP0.5 and Ctrl islets for Ins1 and Ins2. (E and F) Pdx1 mRNA expression (E) and
total protein levels from 12-week-old LP0.5 and Ctrl islets (F). (G) Quantification of F. (H–M) mRNA
expres-sion levels of Neurod1, Hnf1a, Hnf4a, Tcf2, Igf2, and Gkc were measured in male 12-week-old LP0.5 and Ctrl islets by qPCR. Transcript levels were normalized to
we focused on assessing the effects of miR-342, the most highly induced miR in LP0.5 islets. Interestingly, anti–miR-342 normal-ized mTOR protein levels in LP0.5 adult islets compared with controls (Figure 8C). Thus, these data suggest that multiple miRs regulate mTOR protein posttranscriptionally in LP0.5 islets.
Next, we assessed whether the normalization of mTOR protein levels in LP0.5 islets could rescue the insulin secretion dysfunc-tion in LP0.5 islets. Anti–miR-199a-3p and -342 were transfected into dispersed islet cells from control or LP0.5 mice, and the glu-cose-stimulated insulin secretion of these cells was tested. As a positive control, we used a miR-375 inhibitor (anti–miR-375), a
well-characterized miR known to block insulin secretion in β cells
(28). We observed a significant increase in glucose-stimulated
insu-lin secretion in dispersed β cells from Ctrl-fed mice transfected
with anti–miR-375 and -342 compared with scrambled control miR-transfected cells (Figure 8D). As shown previously with intact islets, we observed a significant reduction in glucose-stimulated insulin secretion in the dispersed islet cells from adult LP0.5 mice compared with controls (Figure 8D). As such, along with the
nor-malization of mTOR protein levels in LP0.5 islets, we observed sig-nificantly improved insulin secretion in LP0.5 islet cells transfected with anti–miR-199a-3p or -342 (Figure 8D). These data suggest that blocking the effect of miR-199a-3p or -342 is sufficient to rescue defective insulin secretion in islets of LP0.5 mice. Our data also demonstrated that anti–miR-375 was sufficient to rescue the insu-lin secretion defect in LP0.5 islets (Figure 8D). Anti–miR-199a-3p,
-342, or -375 did not affect insulin content in the β cells of control
offspring (Figure 8E). However, blocking these miRs normalized
insulin content in the LP0.5 β cells to control levels (Figure 8E). To
further investigate the effects of miR-152 and -342 on insulin secre-tion, we transfected islet cells from control offspring with miR mim-ics. Transfection of control islet cells with mimics of miR-152 or -342 reduced the level of insulin secreted in response to glucose without altering insulin content (Figure 8, F and G), suggesting that miR-152 and -342 play an important role in regulating insulin secretion.
Transient activation of mTORC1 in β cells rescues β cell fraction defect in LP0.5 newborns. Because mTOR protein level was reduced
[image:8.585.42.395.53.491.2]in LP0.5 islets, we aimed to determine the direct contribution of
Figure 6. LP0.5 exposure during preg-nancy decreases mTOR signaling in neonatal and adult β cells. (A)
Immuno-fluorescence staining of phosphorylated ribosomal protein S6 (pS6, Ser240, red) and insulin (green) in neonatal islets (original magnification, ×40) from LP0.5 and Ctrl mice. (B–E) mTOR protein levels
in 12-week-old islets from LP0.5 and Ctrl mice. A representative Western blot of mTOR in male (B) and female (D) mice.
Quantification of mTOR levels normalized to β-actin in male LP0.5 islets (C) and
female LP0.5 islets (E). (F) Phosphorylated
ribosomal protein S6, ERK1/2, and AKT1/2 levels in 12-week-old islets from LP0.5 and Ctrl mice. (G–I) Quantification of blots in F. D (mTOR and actin) and F (pS6 Ser240 and
and then assessed glucose tolerance and insulin secretion in adult animals. To study adult mice, we used a model having
conditional and inducible Rheb overexpression in β cells. This
model allowed us to study the effect of Rheb activation exclu-sively during a specific window of development on glucose homeostasis later in adult mice. By taking advantage of the Tet-Off binary transgenic system, the expression of the Rheb transgene was dependent on the activity of tTA, such that the activation of mTORC1 signaling could be turned off by adminis-tering doxycycline (Dox) in the diet. An internal ribosome entry site in the construct allowed the coupled expression of EGFP for lineage tracing. Therefore, LP0.5 progeny with a genotype of
RIPCre Rheb will have a transient activation of mTORC1
signal-ing only from E14.5 to just a few days after birth. Recombination efficiency and Rheb signaling activation were assessed by EGFP expression. EGFP immunofluorescence was visible only in
β cells of RIPCre Rheb newborn mice compared with that in
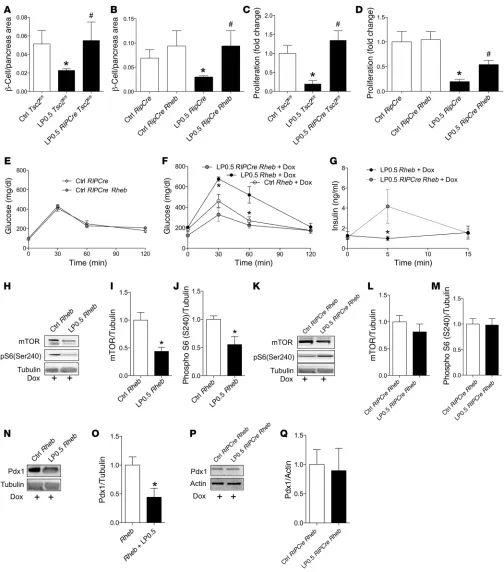
wild-type (RIPCre or Rheb) newborn mice (Supplemental Figure 6A). EGFP was not detectable in adult RIPCre Rheb mice exposed to Dox throughout life (Supplemental Figure 6, B and C). To meta-bolically characterize RIPCre Rheb mice, we performed glucose tolerance tests in 3-month-old RIPCre Rheb and RIPCre mice not exposed to Dox treatment. Interestingly, glucose tolerance was comparable between RIPCre Rheb mice and control
(RIP-Cre) mice (Figure 9E). Glucose-stimulated insulin secretion in
these mice was also normal (E.U. Alejandro et al., unpublished observations). Next, we tested whether activating mTORC1 by overexpressing Rheb only during the last week of development improved glucose tolerance in adult LP0.5 mice. Consistent with our previous findings, Ctrl-fed wild-type offspring (Ctrl Rheb + Dox) showed improved glucose tolerance compared with that of wild-type LP0.5 (LP0.5 Rheb + Dox) mice at 3 months of age
mTORC1 signaling to the β cell programming phenotype induced by
LP0.5. To do this, we transiently induced mTORC1 signaling in β cells
by conditionally deleting TSC2, a negative regulator of mTORC1
signaling, in β cells of LP0.5 offspring from embryonic day 14.5 to
birth. Using an additional model, we overexpressed Rheb, a positive regulator of mTORC1, from embryonic day 14.5 to birth. Evalua-tion of newborn body weight and length showed that Tsc2-deficient
(RIPCre Tsc2fl/fl) mice and Tsc2fl/fl littermates (hereafter referred to
as wild type) exposed to either Ctrl or LP0.5 during gestation were comparable (Supplemental Figure 4, A and B). We observed similar body weight and length data in Rheb-overexpressing (RIPCre Rheb) and Rheb non-overexpressing (Rheb or RIPCre wild-type mice) mice exposed to either Ctrl or LP0.5 (Supplemental Figure 4, C and D).
Next, we assessed whether the neonatal β cell fraction defect that
we observed in C57BL/6 LP0.5 offspring was rescued by the gain of
mTORC1 function seen in RIPCre Tsc2fl/fl or RIPCre Rheb mice.
Sim-ilar to the C57BL/6 strain model, we observed a significant
reduc-tion in the β cell/pancreas area in wild-type LP0.5 newborns (Figure
9A) compared with wild-type Ctrl-fed newborn mice (Figure 9A). In
contrast, LP0.5 mice with Tsc2 deletion in β cells (Figure 9A)
demon-strated improved neonatal β cell/pancreas area compared with that
of wild-type LP0.5 mice (Figure 9A). Next, we assessed the effect
of overexpressing Rheb in β cells on the neonatal β cell/pancreas
area. RIPCre Rheb and wild-type (RIPCre) newborns exposed to Ctrl
during gestation had comparable β cell/pancreas area (Figure 9B).
However, the overexpression of Rheb in β cells rescued the neonatal
β cell/pancreas area defect seen in LP0.5 mice. As expected, LP0.5
wild-type offspring (Figure 9B) had a significant reduction in
neona-tal β cell/pancreas area compared with that of controls (Figure 9B).
On the other hand, Rheb-induced enhancement of mTORC1
sig-naling improved β cell/pancreas area of the LP0.5 offspring (Figure
9B). β Cell proliferation, as measured by Ki67+ staining
(Supplemen-tal Figure 5A), was reduced in wild-type LP0.5 offspring (Figure 9, C and D) compared with that in wild-type Ctrl-fed offspring (Figure
9, C and D). However, β cell proliferation was normalized in LP0.5
RIPCre Tsc2fl/fl or RIPCre Rheb mice compared with that in wild-type
offspring (Figure 9, C and D). Therefore, the rescued β cell mass in
RIPCre Tsc2fl/fl and RIPCre Rheb mice could be explained, at least in
part, by enhanced β cell proliferation.
Transient activation of mTORC1 in β cells during development rescues glucose intolerance and insulin secretion dysfunction in LP0.5 mice. To identify the effects of gain of mTORC1 function
[image:9.585.39.361.56.177.2]during the developmental period on the susceptibility to dia-betes induced by maternal protein restriction, we transiently induced mTORC1 signaling from embryonic day 14.5 to birth
Figure 7. LP0.5 exposure during pregnancy regulates mTOR signaling in adult mice by altering specific miRs. (A) mTOR transcription message from islets of 12-week-old male LP0.5 and Ctrl mice. (B–D) miRs
differentially expressed in islets of 12-week-old male LP0.5 and Ctrl mice. Expression of the indicated miRs was measured by qRT-PCR. Small enriched RNA was purified by using MiRVana. Results are expressed as fold changes and correspond to the mean ± SEM of LP0.5 and Ctrl mice (n = 4). *P < 0.05 vs. Ctrl.
Table 1. Increased miRs in adult islets from LP0.5 mice
miRs LogFC P value
miR-152 0.52375 0.008658009
miR-342-5p 2.384891667 0.017316017
identified common metabolic phenotypes in offspring and have
identified the pancreatic β cell as particularly sensitive to
nutri-ents very early in life (3, 29, 30). In these experimnutri-ents, we used engineered animal models with spatial and temporal regulation capabilities to dissect the molecular mechanisms responsible for developmental programming by low protein. In the present study,
maternal low-protein diet induces permanent changes in β cell
function of LP0.5 offspring by altering miR expression, mTOR protein levels, and Pdx1 and insulin mRNA and protein levels. These studies also demonstrate that mTOR, a major target of nutrients and growth factors, is modulating the effects of nutrient programming of metabolic diseases.
We described a murine model in which exposure to a low-pro-tein diet during gestation has critical effects on the development
of β cells in early life and on metabolism in adult life. Although not
unprecedented, we did not observe a reduction in maternal body weight during pregnancy or in offspring body weight at birth, and we did not observe catch-up growth (20, 31). Similar to findings
from earlier studies, we have shown reduction in β cell fraction
at birth and glucose intolerance despite enhanced insulin
sensi-tivity in early adult life (11, 13, 20, 32–35). The reduction in β cell
fraction at birth normalizes to control levels at 3 months of age and likely has no role in the glucose intolerance observed in adult LP0.5 mice. Rather, the results of the metabolic studies in vivo and in vitro revealed that the alterations in glucose homeostasis are a
result of an insulin secretory defect in LP0.5 β cells. Interestingly,
LP0.5 mice do not develop diabetes despite a significant defect in insulin secretion because they are more insulin sensitive, as previ-ously shown in other studies (33, 35). The increase in insulin sen-sitivity could result from an enhanced number of insulin receptors in the livers of LP0.5 mice, as previously reported (36).
In the present study, we determined that LP0.5 islets exhibit normal levels of intracellular calcium and the defect observed
following KCl stimulations indicates that LP0.5 β cells exhibit
defects in insulin secretion that are distal to calcium influx. Our results are consistent with the concept that not only defects in proinsulin synthesis but also an insulin secretory defect from the islets contribute to a suboptimal insulin secretion in these mice.
Reduced insulin content in LP0.5 β cells has also been observed
in studies in sheep and rats (11, 37). Downregulation of Pdx1 pro-tein levels and reduced ERK1/2 signaling could explain in part
the reduction in Ins2 transcription and insulin content in LP0.5 β
cells (10, 38, 39). Because two-thirds of insulin protein is derived from the conserved Ins2 gene rodents (40), these data are not unexpected. It is also likely that the reduction of mTOR levels
could also contribute to the insulin secretory defect in LP0.5 β
cells by altering the activity of mTORC1 and mTORC2. The importance of mTORC1 signaling for insulin secretion has been demonstrated in mice with gain and loss of S6K function (41, 42). In addition, islets from LP0.5 mice exhibited lower levels of AKT phosphorylation at Ser473, a surrogate marker of mTORC2 (mTOR/rictor) activity. The importance of mTORC2 for insu-lin content and insuinsu-lin secretion has been established in mice with conditional ablation of rictor (43). Future studies could be designed to examine how mTORC2 regulates signaling and dis-tal events (i.e., reorganization/remodeling of filamentous actin) responsible for vesicle trafficking and exocytosis (44, 45). (Figure 9F). RIPCre Rheb mice (LP0.5 RIPCre Rheb + Dox) had
significantly improved glucose tolerance compared with that of LP0.5 wild-type (LP0.5 Rheb + Dox, Figure 9F). There were no differences in insulin sensitivity between LP0.5 RIPCre Rheb and Rheb Dox-treated mice (data not shown). Moreover, insulin secretion was enhanced in LP0.5 RIPCre Rheb mice compared with that in LP0.5 Rheb mice treated with Dox (Figure 9G).
To investigate how Rheb overexpression during pregnancy rescues the LP0.5 mouse phenotype, we assessed mTOR protein levels, mTORC1 activity, Pdx1 expression, and miR levels in islets from the different experimental groups. As shown before, mTOR, phosphoS6 levels, and Pdx1 expression were reduced in LP0.5
Rheb + Dox mice compared with Ctrl Rheb + Dox mice (Figure 9,
H–J and N). Remarkably, mTOR levels and activation of mTORC1 signaling, as assessed by phosphorylated S6 levels in islets from LP0.5 RIPCre Rheb mice, were restored to the levels observed in Ctrl RIPCre Rheb mice (Figure 9, K–M). In addition Pdx1 levels in LP0.5 RIPCre Rheb islets were returned to the levels in RIPCre Rheb mice exposed to Ctrl (Ctrl RIPCre Rheb) (Figure 9, N–Q). In addi-tion, increased Ins2 mRNA was observed in LP0.5 RIPCre Rheb mice compared with that in LP0.5 mice (Supplemental Figure 7A). The beneficial changes obtained by Rheb overexpression in LP0.5 mice appeared to be independent of the expression of miR-199a-3p, -152, and -7a (Supplemental Figure 7, B–D). Collectively, these data provide genetic evidence that transient activation of mTORC1
in β cells during last week of pregnancy improves glucose tolerance
by enhancing insulin secretion in LP0.5 mice and point to a
mecha-nistic role of mTOR signaling in β cell programming.
Discussion
[image:10.585.41.289.85.229.2]It is widely accepted that nutrition during early life affects the development and function of specific organs as well as the overall metabolism of an entire organism many years later in life. Multi-ple animal models, including maternal protein restriction, caloric restriction, and intrauterine placental ligation models, have
Table 2. Reduced miRs in adult islets from LP0.5 mice
miRs LogFC P value
miR-30b –0.887604167 0.0086580
miR-1903 –9.64619375 0.015873016
miR-697 –6.473 0.015873016
miR-669N –0.715870833 0.017316017 miR-487b –0.286583333 0.025974026
miR-27b# –0.6698375 0.03030303
miR-1954 –1.907504167 0.03030303 miR-671-5P –2.486604167 0.03030303
miR-1306 –1.455975 0.031746032
miR-101a# –1.78945 0.035714286
expression was not sufficient to alter the significant β cell mass
expansion observed during the first 4 weeks of life, as β cell mass
was normalized in adult mice (48–50).
A major finding of the current study is that a significant num-ber of miRs induced in LP0.5 islets (miR-199a-3p, -342, and -7a) target different components of mTOR signaling. mTOR protein was reduced in adult LP0.5 islets due to upregulation of novel miRs. We found that LP0.5 exposure during pregnancy induced upregulation of miR-199a-3p in adult LP0.5 islets. This miR has
been shown to directly bind to mTOR 3′UTR and affect mTOR
protein translation in 3 models of hepatocarcinoma-derived cell lines (24), which is consistent with the normalization of mTOR levels in LP0.5 islets after transfection of anti–miR-199a-3p. We also demonstrated a novel role of miR-342 on regulation of mTOR protein, as blocking miR-342 normalized mTOR protein expres-sions in adult LP0.5 islets. Moreover, blockade of miR-199a-3p We, and others, have established that mTOR signaling plays
a major role in regulating β cell mass and function (15, 17, 46,
47). In the present study, we have identified for the first time that downregulation of mTOR protein levels in LP0.5 islets is
one of the mechanisms involved in the programming of β cells.
Our data reveal that exposure to LP0.5 is sufficient to perma-nently reduce islet mTOR protein levels. The reduction in mTOR expression was not sufficient to decrease total protein synthesis, suggesting that this mechanism is unlikely to play a role in the LP0.5 phenotype (data not shown). This is not sur-prising, as total protein synthesis in islets from mice lacking 1
allele of mTOR (Pdx1-Cre mTORfl/WT mice) is comparable to that
of control mice (mTORfl/fl) (E.U. Alejandro et al., unpublished
data). The reduction in mTOR level, however, was associated
with reduced β cell fraction at birth, suggesting that β cell
[image:11.585.44.421.54.514.2]expan-sion is sensitive to mTOR levels. However, the defect in mTOR
Figure 8. miR-199a-3p and -342 regulate mTOR protein levels and insulin secretion in β cells. (A and B)
mTOR (A) and Pdx1 (B) protein levels
in dispersed islet cells treated with or without anti–miR-199a-3p (199). (C) mTOR protein levels in dispersed
islet cells treated with or without anti–miR-342. (D and E) Insulin
secretion (D) and insulin content (E)
in dispersed β cells from 12-week-old male LP0.5 and control islets treated with or without anti–miR-199, -342, or -375. (F and G) Insulin secretion
(F) and insulin content normalized
to DNA (ng/ml) (G) in β cells from 12-week-old male control islets treated with or without miR-152 and -342 mimics. n = 3–6. *P < 0.05 vs. Ctrl, #P < 0.05 vs. LP0.5,
Figure 9. Transient activation of mTORC1 in β cells during development rescues neonatal β cell fraction, glucose intolerance, and insulin secretion dysfunction in LP0.5 mice. (A and B) Newborn β cell/pancreas area in Tsc2fl/fl, RIPCre Tsc2fl/fl, RIPCre, or RIPCre Rheb Ctrl or LP0.5 mice (n = 3–5). (C and D)
β Cell proliferation in Tsc2fl/fl, RIPCre Tsc2fl/fl, RIPCre, or RIPCre Rheb Ctrl or LP0.5 mice (n = 3–5). (E) Intraperitoneal glucose test in 12-week old male RIPCre
secretion in vivo (26, 43). Potential targets of miR-152 and -342, including ribosomal protein S6, Ras GTPase-activating protein, profilin-2, syntaphilin, and syntaxin-binding protein 5, could alter insulin secretory functions identified using the miRGen database. In addition to 199a-3p and -342, blocking miR-375 was sufficient to restore insulin secretion in LP0.5 islets. Interestingly, miR-375 inhibits insulin secretion at a distal stage independent of calcium signaling (28). Therefore, miR-372 affects events that occur after induction of calcium sig-naling (i.e., insulin granule fusion to the plasma membrane) is sufficient to ameliorate insulin secretion dysfunction in LP0.5 islets. In summary, we have identified a subset of islet miRs that are regulated permanently by exposure to protein restriction during fetal life. How LP0.5 controls expression of the miRs is an open question that is worth pursuing in the future. To gain insight into the upstream factors that could regulate the expres-sion of these miRs, we have looked at the promoter elements of the different miRs and found that the majority of these miRs are regulated by methylation of the promoters (miR-342, -152, and -199a-3p-a1). Interestingly, miR-199a-3p-a2 and -7a
con-tain E-boxes, suggesting that Ngn3 and NeuroD/β2 could be
implicated (53, 54). Taken together, we conclude that this group of miRs could alter insulin secretion by several mechanisms, including insulin biosynthesis and distal events that involve the secretory machinery; however, the mechanisms of upstream factors that regulate these miRs are still unclear.
Our studies using genetic models provide further evidence
that alteration of mTORC1 signaling in β cells during
develop-mental stages plays a central role in the metabolic programming induced by LP0.5. Gain of mTORC1 function by conditional
dele-tion of TSC2 or Rheb overexpression in β cells during development
was sufficient to rescue the neonatal β cell fraction defect in LP0.5
mice. Together with the reduced phosphorylated S6 staining in
neonatal β cells, these results suggest that the effects of protein
restriction on β cell growth during development are mediated in
part by mTORC1 signaling. More importantly, transient gain of mTORC1 function by inducible Rheb expression during the last week of fetal developmental was sufficient to partly restore mTOR and Pdx1 protein levels, reversing the insulin secretory defect and glucose intolerance in adult LP0.5 mice. The beneficial effect of Rheb overexpression during fetal stages on glucose tolerance in
adult LP0.5 mice was not explained by changes in β cell mass,
suggesting that mTORC1 induction during embryonic stages pos-itively affects insulin secretion later in life. Although the mech-anisms responsible for this are not completely understood, the current experiments suggest that an increase in mTORC1 during gestation restores mTORC1 activity and insulin secretion in LP0.5 mice by mechanisms that are independent of miR expression. Future experiments could test whether mTOR signaling and miRs act on common pathways to regulate insulin granule exocytosis.
Interestingly, constitutive β cell Rheb expression during
devel-opment does not significantly enhance neonatal β cell/pancreas
area in mice exposed to Ctrl. Moreover, these mice do not show improvement in glucose tolerance at 3 months of age, suggesting that increased mTORC1 signaling has no additional effects in con-trol or basal conditions. As such, in conditions such as low-protein diet, in which there is reduced or less than optimal mTORC1 sig-and -342 not only resulted in increased mTOR protein expression
but also improved insulin secretion (Figure 8, A–D), further pro-viding evidence that mTOR signaling could play a role in the insu-lin secretory defect observed in LP0.5 islets (42, 43, 51). In contrast to mTOR, there are no putative target sites for miR-199a-3p, -152, and -342 on Pdx1 or Ins2 mRNA, and transfection of these miRs failed to alter Pdx1 levels in INS1 cells, suggesting that Pdx1 is not a direct target of these miRs (Supplemental Figure 8A). However, transfection of LP0.5 islets with anti–miR-199a-3p normalized mTOR and Pdx1 protein levels between LP0.5 and control islets (Figure 8B). This suggests that miR-199a-3p indirectly regulates Pdx1 by modulating pathways that restore Pdx1 at the transcrip-tional, posttranscriptranscrip-tional, or protein stability level and is perhaps mediated by modulation of mTOR activity. Indeed, activation of mTORC1 during pregnancy restored mTOR levels and signaling, and this was associated with normalization of Pdx1 levels (Figure 9, H–Q). Further evidence for the regulation of Pdx1 by mTOR
comes from mice overexpressing a kinase-dead mTOR in β cells.
These mice exhibited decreased levels of Pdx1 in islets (E.U. Ale-jandro et al., unpublished observations).
Alterations in other important targets of these miRs could also explain the abnormalities in insulin secretion induced by LP0.5. miR-7a, one of the most abundant miRs in adult islets, has been shown to target multiple proteins (p70S6K, eIF4E, Mknk1, and
Mknk2) involved in the mTOR signaling pathway in β cells (22).
Although miR-7a has been reported to have no effect on mTOR protein levels (22), it is possible that miR-7a could regulate insulin secretion by modulating S6K (42) and genes that regulate insulin
granule exocytosis in β cells (52). Most recently, Latreille et al.
elegantly showed that miR-7a controls β cell function in vivo by
directly regulating genes that control late stages of insulin granule fusion with the plasma membrane (52), corroborating the insu-lin secretion dysfunction in LP0.5. Therefore, it is possible that LP0.5-induced miRs modulate insulin secretion by a combination of different mechanisms that include regulation of mTOR levels and signaling, insulin granule exocytosis, and insulin content.
Pancreas section collection. Newborn pancreata from each group
(C57BL/6 mice and mice with Tsc2fl/fl, RIPCre Tsc2fl/fl, Rheb, and RIPCre
Rheb genotypes) exposed to LP0.5 or Ctrl were harvested on P1. Adult
pancreata were harvested on day 90 in C57BL/6 LP0.5 and control mice. Pancreata were fixed in 3.7% formalin in PBS for 6 hours (new-born pancreas) or overnight (adult pancreas).
Primary mouse islet isolation. Islets were isolated by collagenase
digestion (57). The pancreas was perfused via the common duct with 1 mg/ml collagenase XI (Sigma-Aldrich) in HBSS (Life Technologies). Pancreatic digestion was carried out at 37°C for 15 minutes, after which cold HBSS with 2.5% FBS (Life Technologies) was added. The suspension was centrifuged at 330 g for 30 seconds; washed 3 times with HBSS with 2.5% FBS; resuspended in RPMI 1640 with 5 mM glu-cose, 10% FBS, 100 IU/ml penicillin, and 100 g/ml streptomycin; and poured onto a 70-μm cell strainer (BD Falcon, BD Biosciences). Islets were rinsed and handpicked. Islets were allowed to recover overnight before experiments were carried out.
Primary mouse islet insulin secretion analysis in vitro. Isolated islets
were cultured overnight with regular RPMI 1640 media containing 5 mM glucose and 10% FBS. The following day, islet cells were washed twice with PBS and cultured in serum-free media and 2 mM glucose for 1 hour before placement in 2 mM or 16 mM glucose for 15 min-utes. To assess maximum capacity for insulin secretion, we used 30 mM KCl for 10 minutes. Insulin secretion levels were measured using either radioimmunoassay (Rat Insulin RIA, Millipore) or ELISA (Mouse-Insulin UltraSensitive, ELISA, ALPCO Immunoassays).
Insulin secretion analysis in dispersed islet cells in vitro.
Approxi-mately 750 to 1,000 islets from either Ctrl or LP0.5 mice were iso-lated and allowed to recover overnight in RPMI 1640 media with 10% FBS and 5 Mm glucose. Islet dispersion was carried out by 4 consecutive washes with Ca2+/Mg2+-free MEM, followed by a gentle
repetitive pipetting with trypsin-EDTA solution diluted 1:9 in MEM. Cells were washed 4 times with Ca2+/Mg2+-free MEM and seeded
onto 9 wells of a 24-well plate with MEM for 3 hours. Media was then replaced with OPT-MEM containing Lipofectamine 2000 complexes with control or individual MiRVana miR inhibitors or a cocktail of MiRVana miR inhibitors of miR-199, -342, and -375 or mimics for miR-152 and -342 (30 nmol/l for each miR). Twelve hours after transfection, media were removed and replaced with RPMI 1640 media with 5 mM glucose and 10% FBS. Cells were allowed to recover for an additional 24 hours before glucose-stimulated insu-lin secretion, which required a 2-hour preincubation with a Krebs-Ringer buffer containing 129 mM NaCl, 5 mM NaHCO3, 4.8 mM KCl, 2.5 mM CaCl2, 1.2 mM MgSO4, 1.2 mM KH2PO4, 10 mM HEPES, 2 mM glucose, and 2 g/l essentially free fatty acid BSA (Sigma- Aldrich). Transfected cells were then exposed in Krebs-Ringer buf-fer with 2 mM glucose for 30 minutes before exposure to 25 mM glu-cose for another 30 minutes. Collected media samples were spun down for 5 minutes at 500 g at 4°C before storing at –80°C or prior to an insulin ELISA assay (ALPCO). Insulin content was analyzed from homogenized dispersed islet cells samples. Five independent cul-tures of triplicates were analyzed, and each experimental run was performed on a different day. All reagents used to this point were purchased from Life Technologies unless otherwise stated.
Primary human islets. Human islets provided by the Integrated
Islet Distribution Program were dispersed and maintained in 5 mM glucose, 10% FBS RPMI, for 3 hours, followed by transfection with 30
naling, additional activation of the mTORC1 pathway can have beneficial effects. This can be explained in part by lower expres-sion levels of Rheb obtained in heterozygous versus homozygous Rheb mice. It is possible that this phenotype could be different in homozygous Rheb-inducible transgenic mice, and experiments investigating this are currently underway.
In summary, this study highlights the importance of the
nutri-ent environmnutri-ent for developing β cells and provides strong
evi-dence that mTOR is a key player in regulating β cell programming
by low-protein diet. We have identified that mTOR protein expres-sion is regulated by multiple miRs sensitive to nutrients. Further-more, we generated multiple murine models that were genetically
capable of inducing mTORC1 specifically in β cells during the last
week of gestation of LP0.5 offspring and demonstrated that these
mice are resistant to the neonatal β cell mass defect and glucose
intolerance and restored insulin secretion dysfunction caused by low-protein programming in adult mice. Insights gained from this study may help inform the design of treatments and prevention of T2D in individuals with IUGR.
Methods
Low-protein C57BL/6 strain mouse model. Virgin C57BL/6 females and
males at 2 months of age were purchased from The Jackson Laborato-ries and allowed to adapt to Ctrl (D02041001B, Research Diets Inc.) for 4 weeks (Figure 1A). After acclimation to the Ctrl, females and males were housed together for up to 3 days. Females were checked daily for vaginal plugs. Upon detection of a vaginal plug (designated E0.5), females were single housed and fed either low-protein (9%, D02041002, Research Diets Inc.) or control (23%, D02041001B) chow until delivery (Figure 1A). Both diets are isocaloric but differ in the amount of protein in the form of casein (complete diet compo-sition is shown on Supplemental Table 1). Pregnant dams delivered spontaneously on gestational day 19. Females were switched to nor-mal chow immediately after delivery (23%, D02041001B).
Generation of conditional RIPCre Tsc2fl/fl and RIPCre Rheb mice.
To induce mTORC1 signaling in β cells we generated 2 models: (a) conditional deletion of TSC2, a negative regulator of mTORC1, and (b) β cell–specific overexpression of Rheb, a positive regulator of mTORC1. First, we crossed female Tsc2fl/fl mice (15) with male
mice harboring both Tsc2fl/fl and Cre recombinase (55) under the rat
insulin 2 promoter (RIPCre Tsc2fl/fl) (15). Second, we crossed female
RIPCre Rheb (RhebtTA) mice with male RIPCre mice. Briefly, RIPCre
Rheb mice were generated by a knockin strategy using a backbone
knockin ROSA-26-tetracycline-regulated transcriptional activa-tor (tTA) as previously described (56). The expression of the Rheb transgene and an internal ribosome entry site controlling expres-sion of EGFP is Dox dependent. The crosses were set up in a manner such that embryos with gain of mTORC1 function (RIPCre Tsc2fl/fl
or RIPCre Rheb) and wild-type (Tsc2fl/fl, Rheb, or RIPCre) were
litter-mate offspring from dams (Tsc2fl/fl or Rheb) exposed to LP0.5 or Ctrl
throughout pregnancy. The rescue model was set up similarly as the C57BL/6 strain mouse model above. However, after delivery, LP0.5 and control dams and offspring were introduced to Ctrl containing Dox (23%, 200 mg Dox per kg, D11071101, Research Diets Inc.). Mice included in experiments were on a mixed 129 and C57BL/6 background; Tsc2fl/fl and RIPCre Tsc2fl/fl or Rheb and RIPCre Rheb
Protein quantifications. Immunoblotting was performed as
previ-ously described (58). Briefly, islet cells were washed after treatment with PBS before adding cell lysis buffer (Cell Signaling) with protease inhibitor cocktail and phoshopStop tablets (Roche Applied Science). Primary antibodies against mTOR, phosphorylated S6 (Ser240 and 235), AKT (Ser473), and total AKT were from Cell Signaling. An anti-body against mouse β-actin was from Sigma-Aldrich. Pdx1 and MafA antibodies were from Millipore and Novus Biologicals, respectively. Densitometry analysis was performed using ImageJ (NIH).
Measurements of intracellular Ca2+. Islets were preloaded with
2.5 μM Fura2-AM (Molecular Probes) in 0.1% DMSO for 30 minutes at 37°C and washed for 10 minutes before recording. The recording solution contained 145 mM NaCl, 5 mM KCl, 1.2 mM MgCl2, 2.6 mM CaCl2, 10 mM HEPES, and glucose as indicated (pH 7.4). Imaging parameters were identical to those in Merrins et al. (59), and Ca2+ is
reported as the emission ratio R340/380.
Glucose and insulin tolerance tests. Glucose and insulin tolerance
tests were performed by intraperitoneal delivery of 2 g/kg glucose or 0.75 unit/kg insulin (Novolin, Novo Nordisk Inc.) to mice after 15 hours or 6 hours of fasting respectively. Blood glucose was moni-tored for 2 hours after glucose or insulin delivery. Fasting glucose and insulin were measured by obtaining blood from tail veins after over-night fasting. Glucose was measured using the AccuChek II glucom-eter (Abbott). Plasma insulin levels were measured using the Mouse Insulin ELISA Kit (ALPCO).
Measurement of islet insulin content. Islet insulin content was
mea-sured by placing 10 size-matched islets into a 1.5-ml tube containing 100 μl lysis buffer (Cell Signaling). Samples were diluted 1:1,000 in Krebs-Ringer buffer, and insulin content was measured with the Mouse Insulin ELISA Kit (ALPCO). Insulin levels were corrected to total DNA measured by a Qubit Fluorometer (Life Technologies).
Metabolic labeling and immunoprecipitation. Metabolic labeling
and immunoprecipitation were performed as previously described (60). Briefly, isolated adult LP0.5 and control islets were incubated in RPMI containing 5.5 mM glucose and 10% FBS overnight before being pulse labeled with 35S-labeled amino acids for 10 minutes and
chased for 60 and 150 minutes as indicated. Fifteen islets per animal were used for each sample, and 3 independent experiments were per-formed from 3 different cohorts of mice (3 mice used per experiment). Islets cells and chase media collected were immunoprecipitated with a polyclonal anti-insulin antibody that recognizes all insulin forms. Newly synthesized proinsulin and processed insulin were analyzed using Nu-Page gel under reducing conditions.
Statistics. Data are presented as mean ± SEM. Data were
ana-lyzed by a 2-tailed Student’s t test or by a nonparametric U test with Mann-Whitney analysis using GraphPad Prism version 6 (GraphPad Software), where appropriate. Results were considered statistically significant when the P value was less than 0.05.
Study approval. All animal care and procedures were in accordance
with active animal study protocols at the University of Michigan. All procedures related to human T2D islets were approved by ethics com-mittees through the Integrated Islet Distribution Program. Informed consent was obtained from all subjects.
Acknowledgments
This work was supported by NIH grants R01DK073716 and 2R01DK073716 and a Career Development Award from the
Amer-nmol/l anti–miR-199 or control oligonucleotides by Lipofectamine 2000 (Life Technologies) for 12 hours. 24 hours after transfection, glucose-stimulated insulin secretion was performed, and then cells were harvested for Western blotting. Human islets were obtained from 4 male normoglycemic donors (2 African-American men and 2 men of mixed European descent, with an average BMI of 31; ages: 24, 25, 52, and 57 years).
Immunostaining and islet morphology analysis. Formalin-fixed
pancreatic tissues were embedded in paraffin using standard tech-niques. 5-μm sections were deparaffinized, rehydrated, and incu-bated with blocking solution as previously described (57). Sections were incubated overnight at 4°C with antibodies against insulin (anti–guinea pig, Dako), Ki67 (Vector Laboratories), and phospho-rylated S6 (Ser240, Ser235, Cell Signaling), followed by secondary antibodies conjugated to FITC or Cy3 (Jackson Immunoresearch). DAPI-containing mounting media (Vector Laboratories) was added to coverslips. Total pancreas and insulin-positive cell areas from 5 insulin-stained sections (5 μm) separated by 50 μm (newborn pan-creas) or 200 μm (adult pancreas) were measured by using Image Pro Software (Media Cybernetics). β Cell fraction or mass (average β cell fraction multiplied by pancreas weight) assessment was performed using Objective Imaging’s Surveyor automated scanning with a Leica fluorescent microscope (Leica Microsystems). Proliferating cells were identified by costaining for monoclonal rabbit anti-Ki67 and insulin. At least 1,000–3,000 stained cells were counted from each treatment and n = 4–5 per group were analyzed.
Protein and RNA isolation. Protein and RNA samples were
pre-pared from 3 to 4 islet preparations, acini, and liver samples from each treatment group. Samples were quickly washed with PBS prior to incubation in lysis buffer (Cell Signaling) or with Trizol (Sigma- Aldrich). Samples were flash frozen with liquid nitrogen and then kept at –80°C prior to homogenization. RNA for gene expression analysis was isolated using Trizol with columns (Qiagen). RNA for miR analysis was isolated using RNAlater and the MirVana Kit (Life Technologies).
Quantitative real-time PCR for gene and miR expression. Total RNA
for gene expression analysis was isolated using RNeasy (Qiagen). cDNA synthesis was performed using random hexamers and was reverse transcribed using SuperScript II (Life Technologies) accord-ing to the manufacturer’s protocol. Real-time PCR was performed on an ABI 7000 sequence detection system using SYBR Green (Applied Biosystems). Primers were purchased from Applied Biosystems. Prim-ers used are listed in Supplemental Table 2. RNA for miR analysis was isolated using RNAlater and the MirVana Kit (Life Technologies). For mature miR transcript expression, we used Taqman MicroArray Assays (Life Technologies).
OpenArray miR arrays. Each TaqMan OpenArray MicroRNA Panel