i m a g e s : a n a n a ly si s of t e c h ni c al
r e c a ll a n d o b s e r v e r d e t e c ti o n
p e r f o r m a n c e
M a , WK, Kelly, J, Milli n g t o n , S, H il t o n , B, Bo r g a n , R, As pi n, R,
L a n c a , C a n d H o g g , P
h t t p :// dx. d oi.o r g / 1 0 . 1 2 5 9 / bjr. 2 0 1 6 0 2 7 1
T i t l e Bl u r r e d d i gi t al m a m m o g r a p h y i m a g e s : a n a n a ly si s of t e c h n i c al r e c a ll a n d o b s e r v e r d e t e c ti o n p e r f o r m a n c e
A u t h o r s M a , WK, Kelly, J, Milli n g t o n , S, H il t o n , B, Bo r g a n , R, As pi n , R, L a n c a , C a n d H o g g , P
Typ e Ar ticl e
U RL T hi s v e r si o n is a v ail a bl e a t :
h t t p :// u sir. s alfo r d . a c . u k /i d/ e p ri n t/ 4 1 2 7 0 /
P u b l i s h e d D a t e 2 0 1 7
U S IR is a d i gi t al c oll e c ti o n of t h e r e s e a r c h o u t p u t of t h e U n iv e r si ty of S alfo r d . W h e r e c o p y ri g h t p e r m i t s , f ull t e x t m a t e r i al h el d i n t h e r e p o si t o r y is m a d e f r e ely a v ail a bl e o nli n e a n d c a n b e r e a d , d o w nl o a d e d a n d c o pi e d fo r n o
n-c o m m e r n-ci al p r iv a t e s t u d y o r r e s e a r n-c h p u r p o s e s . Pl e a s e n-c h e n-c k t h e m a n u s n-c ri p t fo r a n y f u r t h e r c o p y ri g h t r e s t r i c ti o n s .
Full paper
Blurred digital mammography images: an analysis of technical recall andobserver detection performance
Abstract
Background: Blurred images in Full Field Digital Mammography (FFDM) are a problem in the
5
UK Breast Screening Programme. Technical recalls may be due to blurring not being seen on
lower resolution monitors used for review.
Objectives: This study assesses the visual detection of blurring on a 2.3 megapixel (MP) monitor
and a 5 MP report grade monitor and proposes an observer standard for the visual detection of
blurring on a 5 MP reporting grade monitor.
10
Method: Twenty-eight observers assessed 120 images for blurring; 20 had no blurring present
whilst 100 had blurring imposed through mathematical simulation at 0.2, 0.4, 0.6, 0.8 and 1.0
mm levels of motion. Technical recall rate for both monitors and angular size at each level of
motion were calculated. Chi-squared (X2) tests were used to test whether significant differences
in blurring detection existed between 2.3 and 5 MP monitors.
15
Results: The technical recall rate for 2.3 and 5 MP monitors are 20.3 % and 9.1% respectively.
Angular size for 0.2 to 1 mm motion varied from 55 to 275 arc seconds. The minimum amount
of motion for visual detection of blurring in this study is 0.4 mm. For 0.2 mm simulated motion,
there was no significant difference X2 (1, N=1095) =1.61, p=0.20) in blurring detection between
the 2.3 and 5 MP monitors.
Conclusion: According to this study monitors equal or below 2.3 MP are not suitable for
technical review of FFDM images for the detection of blur.
Advances in knowledge: This research proposes the first observer standard for the visual
detection of blurring.
25
Key words: Simulated motion; technical recall; monitor resolution; observer standard; blurring
detection
1. Introduction
Image blurring due to motion unsharpness in full field digital mammography (FFDM) is a widely
recognized problem in the UK and various explanations exist about how it occurs [1, 2]. One
30
explanation is breast/paddle movement whilst the exposure is being made [1-4]. Other factors
such as inadequate compression and patient movement together with long exposures may also
cause blurring [5].
Blurring has the potential to increase false negative results as it may obscure small or
low-density microcalcification cancers and larger lesions particularly in dense breast tissue. Technical
35
repeat due to blurring increases client radiation dose, overall examination time and can raise
client anxiety. Technical recall is necessary if blurring is not seen at the attendance time and it
could add further to client and family anxiety [6], as unlike a technical repeat taken at the time of
the initial examination the woman will have to wait several days for repeat imaging.
Little has been published about blurred mammography images. In 2000 Seddon et al. reported
40
that over 90 % of their screening mammogram technical recalls were due to blurred images [5].
More recently blurred images were found to be a major source of technical recall in Manchester,
out of 4650 FFDM examinations) of clients were recalled due to image blur; this contributed
almost one third (29 %) of the 3 % maximum permissible recall rate in the National Health
45
Breast Screening Programme (NHSBSP) [8]. For some of these images the blurring could only
be detected when they were displayed on 5 MP reporting grade monitors at the time of reporting.
In many instances blurring was missed when the images were checked for technical accuracy at
the time of imaging. We believe this discrepancy could be due to the lower quality
non-diagnostic quality monitors used in clinical rooms coupled with variable and also generally
50
brighter ambient lighting when compared to reporting rooms. Interestingly, a good deal of
research emphasis has been placed on the evaluation of reporting grade monitors and the
environment in which they sit [9-11], but surprisingly little has been placed on the evaluation of
technical review monitors used within mammography imaging rooms or X-ray imaging rooms
generally. In the context of breast screening, only one study in 2016 by Kinnear and Mercer [12]
55
was found which reported the ability of observers to visually detect image blurring in FFDM
images on 5 MP and 1 MP monitors; the lower resolution monitor resulted in a lower visual
detection rate for blurred images. Kinnear and Mercer’s study represents an important first step
and our study builds on this in various ways. First, our study has a much larger group of
observers thereby enabling inter observer differences to be considered; second, simulation of
60
blurring is used in which the exact amount of blurring is known; third, image selection went
through a rigorous and carefully documented evidence-based approach; finally, the images were
displayed in a room where the ambient lighting was controlled and standardized.
Aside monitor resolution, it is possible that observer ability to visually identify blur will also
affect technical recall rates. Currently no performance data exists on observer ability to detect
65
visually detected on 5 MP reporting grade monitors. Limitations of Ma et al’s study relates to the
low number of observers used and the observers being experienced image readers who are not
representative of the practitioners who undertake mammography imaging.
Our study has two aims: to investigate whether there is a difference in the visual detection of
70
blurring between a 2.3 MP technical review monitor and a 5 MP reporting grade monitor; to
propose an observer standard for the visual detection of blurring on reporting grade 5 MP
monitors.
2. Materials and methods
Mammography images were acquired in 2014 on a Selenia Dimensions FFDM unit (Hologic®,
75
Bedford, MA) which has a 24 cm x 29 cm amorphous silicon (a-Si) thin-film transistor (TFT)
image receptor with 70 micron pixel size and spatial resolution of 7.1 lp/mm [13] within the UK
Breast Screening Programme. Two experienced image readers independently reviewed a number of images using published quality criteria [14] to identify twenty normal and artifact free FFDM
images. These comprised of craniocaudal (CC) and mediolateral oblique (MLO) images.
80
Mathematical simulation software [3] with a soft-edge mask was used to simulate the effect of
motion in the 20 images. Soft-edge mask simulates motion by applying a mathematical algorithm
known as convolution function based on a Gaussian distributed pixel under simulated motion [15,
16]. Motion blurring was added to the images by accumulating the pixel intensity of randomized
microsteps within 1.5mm motion boundary [3]. The soft-edge mask method was chosen because
85
Simulated blurring was imposed to the 20 artifact free FFDM images from 0.2 to 1.0 mm at 0.2
90
mm increments. 120 images were available for use - 100 with five levels of simulated motion
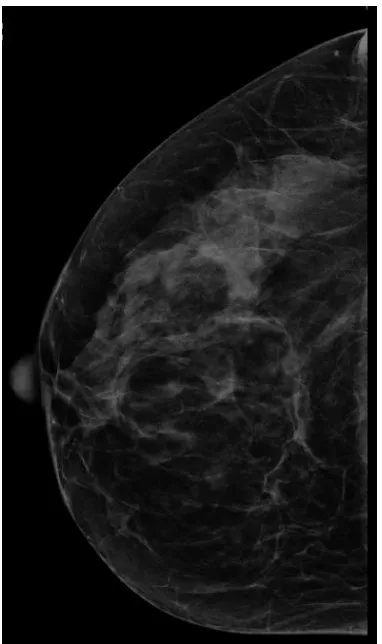
and 20 with no blur. Figures 1 and 2 show examples of FFDM images with and without
[image:6.612.313.507.226.548.2]simulated blur imposed.
Figure 1: FFDM image with no blur Figure 2: FFDM image with 1 mm simulated blur
The 120 images were de-identified, randomized and displayed at full screen size on a 24 inch
95
2.3 MP monitor (NEC, Multisync 243wm) with 0.27 mm pixel pitch and 1920 x 1200 display
resolution; and a 21.3 inch 5 MP monitor (NDS, Dome E5) with 0.17 mm pixel pitch and 2560 x
[image:6.612.82.273.227.549.2]Display Function [17]. Dimmed ambient lighting (less than 10 lux) was used for both monitor
viewing sessions, being consistent with that employed in normal image reading conditions [14].
100
Images were displayed using MediViewer (Schaef Systemtechnik, Petersaurach, Germany). No
interpolation method was used to map image pixels onto the display pixels. Observers were
blinded to the type of monitor used as both monitors have similar dimensions and appearance;
and information about the monitor was not displayed anywhere. Images were viewed on a
blinded basis by 28 observers without knowing the amount of blurring. Window width and level
105
was set to values agreed by consensus between two experienced FFDM image readers prior to
the observers commencing the study; width and levels were set to give image appearances
similar to those seen in routine practice.
In clinical practice distance between the monitor and observer’s eye is not standardized or
controlled. This is because observers constantly change the distance between their eye and the
110
monitor when viewing images. Our study allows this variation of distance to be preserved by
positioning the chair such that observers’ eye to monitor distance would not exceed 75 cm. A
viewing distance of 75 cm was chosen because it is within the viewing range (64 to 89 cm)
which maintains the extraocular muscles in a more relaxed state and minimizes eye strain [18].
However, we did not control or measure the distance from eyes to monitors as this was not the
115
focus of our study. Two calculations on angular size will be performed, one at 30 cm and one at
75 cm, as these are likely to be the extremes of distance that observers might view images.
Angular size is a measurement that describes how large an object appears from a given point of
view, defining the distance between the two ends of an object. The capacity to identify blurring
depends on the potentialities of the human visual system. To identify the minimum amount of
blurring that can be detected by the observer the angular size for each level of motion was
calculated with the equation shown below [19]:
Angular size in degree = 57.3 x physical size/viewing distance
Where physical size is the level of motion in mm.
125
Twenty-six radiographers qualified in mammography imaging and two radiologists (‘observers’)
from two breast screening centres in the North West of England (UK) were invited to review the
120 images on the 2.3 MP technical review monitor and the 5 MP reporting grade monitor.
None of the observers reported visual pathologies and image evaluation was conducted with
130
optical correction if glasses had been prescribed previously. The observers were approached
individually and asked if they would be willing to participate; of those that agreed they were
provided with written information about the research before conducting it. This study was
classified as service evaluation in both breast screening centres; Clinical Audit Department
permission was granted formally on this basis from both hospitals. Anonymity was provided by
135
one coordinating staff member within each centre assigning a unique code to each observer; only
the observer and coordinating staff member knew the code. Feedback was given only on an
individual basis to each observer. Observers’ age varied from 26 to 59 years (mean = 44.5, SD =
8.3 years). Mammography experience varied from 0.4 to 25 years (mean and median experience
was 9.9 years and 10 years respectively, SD = 4.9 years, interquartile range = 7.5 years).
140
The observers were not permitted to magnify the images or adjust the window width and level.
Image manipulation was not permitted due to the need to tightly control the viewing conditions
their personal preferences in display then the study could be comparing the ability of the
observers to manipulate images as well as detect blurring on the two monitors.
145
For each image the observers had to indicate whether blurring was present or not, this was a
binary decision (yes = 1, no = 0). As in Mucci et al’s study [23], Fleiss’ kappa analysis was
carried out to determine the inter-observer variability [24]. To minimize fatigue, image review
sessions did not exceed 30 minutes [25] and each monitor took approximately 1 hour to complete,
therefore 4 viewing sessions were required (approximately 2 hours per observer was needed) to
150
review the images on the 2.3 and 5 MP monitors. Due to clinical demands, data collection had to
be conducted over an eight month period. Experimental conditions and observer training for the
experiments were overseen and controlled/standardized by two members of staff – one in each
clinical centre. Also, all observers underwent a training exercise to help them identify blurred
and non-blurred images. This exercise was conducted by an experienced image reader using a 5
155
MP reporting grade monitor; for this exercise clinical FFDM images were drawn from each of
the two screening programmes to train the observers. These images contained blurred and
non-blurred examples.
Blurring detection rate at each level of motion for 2.3 and 5 MP monitors was calculated. The
equation for blurring detection rate (BD) is shown below.
160
BD = Ni/Nb
Where Ni is the number of blurred mammograms identified by the observers; Nb is the number of blurred mammograms.
Chi-squared (X2) test was used to determine whether significant differences in blurring detection
rate existed between the 2.3 and 5 MP monitors. The influence of level of motion, monitor
165
resolution, observers’ experience and age on blurring detection was modeled in a logistical
Technical recall rate at each level of motion for 2.3 and 5 MP monitors was calculated according
to the NHSBSP recommendations [26]. In this study, the number of mammograms required to
repeat (Nr) was estimated by the number of blurred mammograms missed by the observers (Nm)
170
which is equal to the difference between the number of blurred mammograms (Nb) and the
number of blurred mammograms identified by the observers (Ni).
The equation for technical recall rate (TC) is shown below.
TC = Nr/Nt
= Nm/Nt
175
= (Nb-Ni)/Nt
Where TC is the technical recall rate; Nr is the number of mammograms required to repeat; Nt is
the total number of mammograms taken; Nb is the number of blurred mammograms and Ni is the
number of blurred mammograms identified by the observers.
The upper quartile for the blurring detection rate on the 5 MP monitor was calculated to develop
180
the observer standard for the visual detection of blurring. The upper quartile was used to set the
minimum standard for blur detection because it represents the highest 25 percent of the data. If
the blurring detection rate is at 75th percentile it means 75 percent of the observers would
perform the same as or less than this level and 25 percent would perform better than this level. 185
3. Results
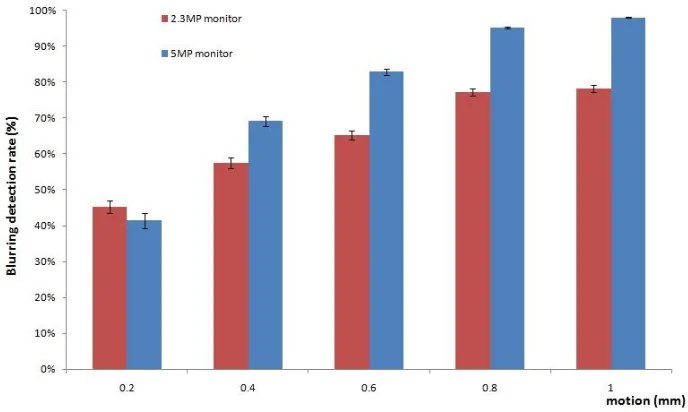
The average blurring detection rate for the 2.3 and 5 MP monitors are shown in Figure 3. All the
non-motion images were identified correctly. As can be seen in Figure 3 the blurring detection
rate increases with simulated motion and monitor resolution. The 5 MP monitor has a higher
average blurring detection rate than the 2.3 MP monitor.
Figure 3. Blurring detection rate against level of motion, the error bars represent the standard errors.
Chi-Squared (X2) test revealed that there was no significant difference in blurring detection
between the 2.3 and 5 MP monitors for 0.2 mm motion, X2 (1, N=1095) =1.61, p=0.20). While
there were significant differences in blurring detection between 2.3 and 5 MP monitors for 0.4
mm (X2 (1, N=1095) = 17.50, p<0.001), 0.6 mm (X2 (1, N=1095) = 44.44, p<0.001), 0.8 mm (X2
195
(1, N=1095) = 75.26, p<0.001) and 1 mm (X2 (1, N=1095) = 108.32, p<0.001) motion.
Fleiss’ kappa for 5 MP and 2.3 MP monitors is 0.48 and 0.11 respectively and the mean kappa is
0.26. A kappa of 1 indicates perfect agreement where a kappa of 0 indicates agreement equal to
chance [24].
Cohen's d was used to measure the effect size for factors in the logistical regression model. The
200
Cohen's d values for level of motion, monitor resolution, observers’ experience and age are 0.38,
0.35, 0.09 and 0.05 respectively. Cohen's d of 0.2 can be consider as "small" effect, around 0.5 as
indicated that in this study observers’ experience and age are not good predictors for blurring
detection.
205
The angular size for each level of motion for viewing distances of 30 cm and 75 cm is
summarized in Table 1. As can be seen, the angular size increases with the level of motion and it
is bigger when the observers are closer to the monitor (30 cm). Individuals with 20/20 vision
have the ability to recognize a pixel if the angular size is equal or larger than 60 arc seconds.
The angular size for 0.2 mm motion at 75 cm is 55 arc seconds which is smaller than the
210
threshold and such a small change cannot be identified by the human eye [27, 28].With this in
mind, we propose the minimum amount of motion required for visual detection of blurring in this
study is 0.4 mm.
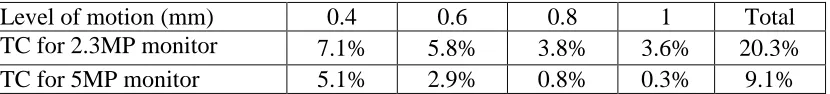
The technical recall rates for 2.3 and 5 MP monitors were calculated and summarized in Table 2.
As can be seen in Table 2, the technical recall rate decreased with the level of motion and
215
monitor resolution. The technical recall rate for the 2.3 MP monitor varies from 3.6 % to 7.1 %
and for the 5 MP monitor it varies from 0.3 % to 5.1 %. The 2.3 MP monitor has a higher overall
technical recall rate (20.3 %) compared to 5MP monitor (9.1 %). For example, at 1 mm motion
the recall rate for 2.3 and 5 MP monitors are 3.6 % and 0.3 % respectively which means for 1000
clients the number of recall would be 36 and 3 respectively.
220
The upper quartile for the blurring detection rates on the 5 MP monitor are summarized in Table
3. The observer standard for the minimum standard of blurring detection at 0.4, 0.6, 0.8 and 1.00
mm level of motion is 96 %, 100 %, 100 % and 100 % respectively.
The results from the monitor comparison study confirm that a monitor with lower resolution (eg
225
2.3 MP) would likely have a poorer visual detection rate for FFDM image blurring compared
with a higher resolution reporting grade monitor (5 MP). The number of blurred images missed
by the observers (Nm) for the lower resolution monitor is higher than the number in the higher
resolution monitor, which leads to a higher technical recall rate for the lower resolution monitor.
In clinical practice as some technical review monitors have resolutions as low as 1 MP [12], we
230
can confidently propose that such monitors would have even poorer blurred image visual
detection rates than the one used in our study (2.3 MP). Further work is needed to determine the
minimum specifications of a technical review monitor for use in imaging rooms for which
technical recall rates could be suitably low for clinical purposes. It is worth noting that our data
suggests that there is a 55 % reduction in the technical recall rate if a 5 MP reporting grade
235
monitor is used for checking images in the clinical rooms. This would reduce the need for
additional time slots for appointments as well as the cost of the administrative overhead for
booking the appointments. Also it would minimize client/client family anxiety and costs for the
re-attendance.
Resolution acuity refers to the smallest amount of spatial detail necessary to distinguish a
240
difference between patterns or features in a visible target [28]. Individuals with 20/20 vision
have the ability to recognize a minimal angle of resolution (MAR) subtended by the components
of the stimulus, which has an angular size of 60 arc seconds [28, 29]. At 0.2 mm of simulated
blurring there is no significant difference (X2 (1, N=1095) =1.61, p=0.20) in blurring detection
between the 2.3 and 5.0 MP monitors. One of the possible explanations is that the human visual
245
system is not able to resolve this level of detail at a distance of 75 cm as the angular size is less
Angular size calculations demonstrate that blur of 0.2 motion is not possible to identify if the
viewing distance is increased to 75 cm, independently of the monitor used. The impact of the
visual system on diagnostic decision-making is not well understood. However, it is known that
250
visual acuity and accommodation accuracy get worse at the end of a long radiology workday [30,
31]. Variance in the viewing distance combined with visual fatigue and a low resolution monitor
can be a potential risk factor for missing the detection of blur on 2.3 MP monitors.
The selection of the motion levels used in this study was related with the early work by Ma et al
[3]. Detection performance between the limits of 30 cm and 75 cm was not tested for 0.3 mm.
255
According with our current calculations of angular size for 0.3 mm of motion it could be argued
that if 0.3 mm of blurring had been used the blurring would be identifiable by the observers at 75
cm (82 arc seconds).This warrants further research to determine threshold values for detection of
blurring at different distances from the monitor.
Fleiss’ kappa for 2.3 MP monitors is much lower than the 5 MP monitor which suggests that
260
using the lower resolution monitor to see blurring is more difficult compared with the higher
resolution monitor. On the other hand, the mean kappa in our study is 0.26 which indicates poor
agreement between observers [24]. In observer studies it is very rare to achieve perfect
agreement and a range of cognitive, visual and environmental factors can be used to explain this.
Also, anecdotally we know that some people find the task of differentiating blurred from non
265
blurred images very difficult, so this could be another explanation for poor agreement. One
conclusion from this could be that observers who performed less well could need additional
training. This poor level of agreement raises questions about the blur detection abilities between
in our study could be used to help inform the development of competence assessment standards
270
of observers in training programmes and in routine practice.
Intra-observer variation and inter-observer variation across professional disciplines was not
included into this study. As observers only viewed each image once it is not possible to calculate
the intra-observer variation. For inter-observer variation across professional disciplines the
sample size for radiologists is too small (n=2) to conduct meaningful analysis. Further research is
275
therefore warranted for intra- and inter-observer variability for different professional groups.
One of the limitations of our study is the use of motion simulation as this may not fully represent
real blurring. For instance, the mathematical simulation used in our study blurs the whole image
while real mammography image blurring may fully or partly affect the image. An updated
version of our mathematical simulation has the ability to introduce regional blurring. Using this
280
updated version further studies could be carried out to investigate the effect of regional blurring
on observer and monitor blurring detection rates. Aside proposing an extension to our study
using regional blurring it could be valuable to conduct a study using real blurred FFDM images.
However, it should be noted that for real blurring it would be hard to control and identify the
exact amount of blurring in the images.
285
Another limitation of our study is that the normal mammography screening environment might
not be fully recreated in our study. For example, practitioners working in imaging rooms often
do not work in levels of subdued light consistent with common reporting conditions and they
probably do not have the same amount of time as image readers to scrutinize the image. Further
studies could be carried out to investigate the effect of lighting and image viewing time on
290
Finally, we did not take into account observers’ previous activities. For example visual fatigue
may occur if a radiologist or radiographer finished a reporting session and then immediately took
part in the study. Further studies could be carried out to investigate the effect of visual fatigue on
blurring detection rates and also other factors, as indicated earlier, which can impact upon
295
observer performance.
5. Conclusions
According to our study monitors equal to or lower than 2.3 MP are not suitable for technical
review of FFDM images for the detection of blur. The minimum amount of motion required for
visual detection of blurring in our study is 0.4 mm and the observer standard for blur detection at
300
0.4, 0.6, 0.8 and 1 mm level of simulated blurring are 96 %, 100 %, 100 % and 100 % on a 5 MP
monitor.
References:
1. Ma WK, Brettle D, Howard D, Kelly J, Millington S, Hogg P. Extra patient movement during mammographic imaging: An Experimental Study. Br J Radiol 2014; 87:20140241. doi:
305
10.1259/bjr.20140241.
2. Ma WK, McEntee MF, Mercer CE, Kelly J, Millington S, Hogg P. Analysis of motion during the breast clamping phase of mammography. Br J Radiol 2016; 89: 20150715. doi:
10.1259/bjr.20150715
3. Ma WK, Aspin R, Kelly J, S. Millington, Hogg P. What is the minimum amount of simulated
310
breast movement required for visual detection of blurring? An exploratory investigation. Br J Radiol 2015; 88: 20150126. doi: 10.1259/bjr.20150126
4. Ma WK, Hogg P, Kelly J, Millington S. A method to investigate image blurring due to mammography machine compression paddle movement. Radiography 2015; 21:36-41. doi: 10.1016/j.radi.2014.06.004
315
6. Hogg P, Kelly J, Claire E, eds. Digital mammography: a holistic approach. 1st ed. London, UK: Springer; 2015
7. O’Rourke J, Mercer CE, Starr L. Programme evaluation: Technical recall and image blur
320
within a breast screening service. Symposium Mammographicum 2014, British Institute of Radiology,UK: Bournemouth; 2014. Available from:
http://www.birpublications.org/doi/pdf/10.1259/conf-symp.2014
8. NHS Cancer Screening Programmes. Consolidated guidance on standards for the NHS Breast Screening Programme. NHSBSP Publication No 60 (Version 2), UK: Sheffield; 2005.
325
9. Shiraishi J, Abe H, Ichikawa K, Schmidt RA, Doi K. Observer study for evaluating potential utility of a super-high-resolution LCD in the detection of clustered microcalcifications on digital mammograms. J Digit Imaging. 2010; 23(2):161-9. doi: 10.1007/s10278-009-9192-x.
10. Schueller G, Schueller-Weidekamm C, Pinker K, Memarsadeghi M, Weber M, Helbich TH.
330
Comparison of 5-megapixel cathode ray tube monitors and 5-megapixel liquid crystal monitors for soft-copy reading in full-field digital mammography. Eur J Radiol. 2010; 76(1):68-72. doi: 10.1016/j.ejrad.2009.04.070.
11. Kamitani T, Yabuuchi H, Matsuo Y, Setoguchi T, Sakai S, Okafuji T et al. Diagnostic performance in differentiation of breast lesion on digital mammograms: comparison among
hard-335
copy film, 3-megapixel LCD monitor, and 5-megapixel LCD monitor. Clin Imaging 2011;35(5):341-5. doi: 10.1016/j.clinimag.
12. Kinnear L, Mercer CE. A study to compare the detection of visual blurring in 1 MP and 5MP monitors within mammography clinical practice. Imaging and Therapy Practice 2016; p.23-28. ISSN 1360-5518.
340
13. Selenia Dimensions Mammography System datasheet; 2016 Available from:
http://www.hologic.com/sites/default/files/DS-05534_rev002_SeleniaDimensions13Jan2016.pdf
14. Perry N, Broeders M, Wolf C, Törnberg S, Holland R, Karsa L. European guidelines for quality assurance in breast cancer screening and diagnosis. 4th edn. Luxembourg: European
345
Communities; 2006.
15. Young SS, Driggers GR, Jacobs LE. Signal processing and performance analysis for imaging systems. 1st edn. New York, NY: Artech House; 2008.
16. Dougherty G. Digital image processing for medical applications. 1st edn. Cambridge, UK: Cambridge University Press; 2009.
350
17. National Electrical Manufacturers Association (NEMA) Digital Imaging and
18. Krupinski EA, Flynn MJ. IT reference guide for the practicing radiologist. Reston, VA: American College of Radiology; 2013. Available from: http://www.acr.org/~/media/ACR/ Documents/PDF/Advocacy/IT%20Reference%20Guide/IT%20 Ref%20Guide%20Displays.pdf
355
19.Legge GE, Bigelow CA. Does Print Size Matter for Reading? A review of findings from vision science and typography. J Vis. 2011;11(5):8-8.
20. Thompson JD, Chakraborty DP, Szczepura K, Tootell AK, Manning JD and Hogg P. Effect of reconstruction methods and x-ray tube current–time production nodule detection in an
anthropomorphic thorax phantom: a crossed-modality JAFROC observer study, Med. Phys. 2016;
360
43 (3): 1265-1274.doi: 0094-2405/2016/43(3)/1265/10
21. Thompson JD, Hogg P, Manning DJ, Szczepura K, Chakraborty DP. A free-response evaluation determining value in the computed tomography attenuation correction image for revealing pulmonary incidental findings: a phantom study, AcadRadiol 2014; 21:538–545. doi:10.1016/j.acra.2014.01.003.
365
22. Thompson JD, Hogg P, Higham S and Manning DJ. Accurate localization of incidental findings on the computed tomography attenuation correction image: the influence of tube current variation. Nuclear Medicine Communications 2013; 34 (2):180-184. doi:
10.1097/MNM.0b013e32835c0984
23. Mucci B, Murray H, Downie A, Osborne K. Interrater variation in scoring radiological
370
discrepancies. The British Journal of Radiology. 2013;86(1028):20130245. doi:10.1259/bjr.20130245.
24. Gwet, K L. Handbook of Inter-Rater Reliability. 4th edn. Gaithersburg, USA: Advanced Analytics; 2014.
25.Anshel JR, Visual Ergonomics in the Workplace, American Association of Occupational
375
Health Nurses Journal 2007; 55: 414–420. doi: 10.1177/216507990705501004
26. NHS Cancer Screening Programmes. Collecting, Monitoring and Reporting Repeat Examinations. NHSBSP Good Practice Guide No 4 (Version 2), UK: Sheffield, 2006.
27. Geher G, HallS. Straight forward Statistics: Understanding the Tools of Research. 1sted. London, UK: Oxford university press; 2014
380
28. Glaser JS. Neuro-Ophthalmology. 3rd edn. Philadelphia: Lippincott Williams & Wilkins; 1999.
30. Safdar NM, Siddiqui KM, Qureshi F, et al. Vision and quality in the digital imaging
385
environment: how much does the visual acuity of radiologists vary at an intermediate distance? Am J Roentgenol 2009;192:W335–W340. doi:10.2214/AJR.07.3515.
31. Krupinski EA, Berbaum KS, Caldwell RT, Schartz KM, Kim J. Long radiology workdays reduce detection and accommodation accuracy. J Am Coll Radiol 2010;7:698–704.
390
[image:19.612.65.499.264.362.2]doi:10.1016/j.jacr.2010.03.004.
Table 1: Angular size for different levels of motion
Level of motion (mm) Angular size (degree) Angular size (arc seconds)
30 cm 75 cm 30 cm 75 cm
0.2 0.0382 0.01528 138 55
0.4 0.0764 0.03056 275 110
0.6 0.1146 0.04584 413 165
0.8 0.1582 0.06112 550 220
[image:19.612.72.487.412.459.2]1 0.1910 0.07640 688 275
Table 2: Technical recall rate (TC) for 2.3MP and 5MP monitors
395
Level of motion (mm) 0.4 0.6 0.8 1 Total
TC for 2.3MP monitor 7.1% 5.8% 3.8% 3.6% 20.3%
TC for 5MP monitor 5.1% 2.9% 0.8% 0.3% 9.1%
Table 3: Observer standard for the minimum standard of blurring detection for 5 MP monitor
Level of motion (mm) 0.4 0.6 0.8 1
Upper quartile (75th percentile) 96% 100% 100% 100%