D ev el o p m e n t of a p h a n t o m t o
t e s t f ully a u t o m a t e d b r e a s t
d e n si ty s of t w a r e – a w o r k i n
p r o g r e s s
Wå d e , G, H o g g , P, T h o m p s o n , JD a n d H ofvi n d , S
h t t p :// dx. d oi.o r g / 1 0 . 1 0 1 6 /j. r a di. 2 0 1 6 . 0 9 . 0 0 3
T i t l e D ev el o p m e n t of a p h a n t o m t o t e s t f ully a u t o m a t e d b r e a s t d e n si ty s of t w a r e – a w o r k i n p r o g r e s s
A u t h o r s Wå d e , G, H o g g , P, T h o m p s o n , JD a n d H ofvi n d , S
Typ e Ar ticl e
U RL T hi s v e r si o n is a v ail a bl e a t :
h t t p :// u sir. s alfo r d . a c . u k /i d/ e p ri n t/ 4 0 1 5 2 / P u b l i s h e d D a t e 2 0 1 7
U S IR is a d i gi t al c oll e c ti o n of t h e r e s e a r c h o u t p u t of t h e U n iv e r si ty of S alfo r d . W h e r e c o p y ri g h t p e r m i t s , f ull t e x t m a t e r i al h el d i n t h e r e p o si t o r y is m a d e f r e ely a v ail a bl e o nli n e a n d c a n b e r e a d , d o w nl o a d e d a n d c o pi e d fo r n o
n-c o m m e r n-ci al p r iv a t e s t u d y o r r e s e a r n-c h p u r p o s e s . Pl e a s e n-c h e n-c k t h e m a n u s n-c ri p t fo r a n y f u r t h e r c o p y ri g h t r e s t r i c ti o n s .
1
2
INTRODUCTION
Mammographic density (MD) is the radiographic density of the breast on a mammogram, reflecting the amount of radiodense (parenchymal and connective tissue) and radiolucent tissue (fat) present.1 MD has been shown to be a strong risk factor for breast cancer, where the risk of developing breast cancer is three to six times greater for women with the densest breast compared to those with a fatty breast.1, 2 MD is thus considered as an important factor to determine screening intervals and additional imaging, where women with a high MD may benefit from shorter intervals or additional imaging, such as ultrasound or magnetic resonance.3
There are several methods to measure MD, where the most common is visual assessment using the Breast Imaging Reporting and Data System (BIRADS) scale4 of the American
College of Radiology. This visual assessment is prone to inter- and intra-reader variability,5 which has led to the development of automated systems to provide an objective assessment of MD. The Volpara software6(Matakina Technology Limited, Wellington, New Zealand) is a
fully automated software that analyses digital mammograms to obtain the total volume of breast tissue (cm3), the volume of fibroglandular tissue (cm3), and calculates the ratio between these volumes to obtain the volume of dense tissue in the breast, known as the volumetric breast density (VBD%).7
Breast compression with subsequent thickness reduction in mammography improves image quality and reduces radiation dose.8 Currently, there are no UK guidelines for optimal
compression, other than it should not exceed 200 Newton.9 This lack of guidance is compounded by a large variation in applied compression forces between practitioners and screening sites.10 Deformable breast phantoms of varying density are necessary to test the
effect of breast compression and thickness reduction on MD; however, such phantoms are currently not available.
3
METHODS AND MATERIALS
A pilot study was conducted to enable the creation of a range of breast phantoms with different configurations of tissue components and densities, and further to test their ability to withstand compression with subsequent thickness reduction. The pilot study is described elsewhere.11
4
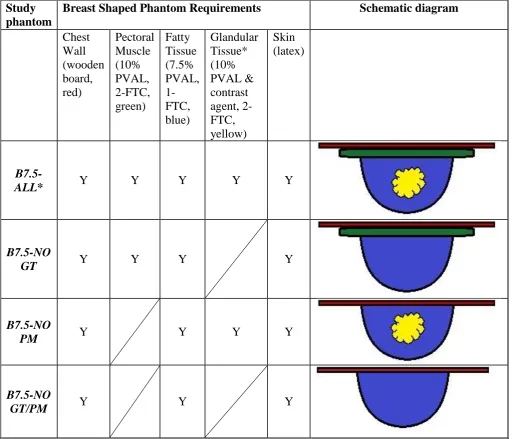
Table 1: The characteristics of the PVAL phantoms used in the main experiment; containing different configurations of chest wall (red), pectoral muscle (green), fatty tissue (blue), glandular tissue (yellow) and skin.
Study phantom
Breast Shaped Phantom Requirements Schematic diagram
Chest Wall (wooden board, red) Pectoral Muscle (10% PVAL, 2-FTC, green) Fatty Tissue (7.5% PVAL, 1-FTC, blue) Glandular Tissue* (10% PVAL & contrast agent, 2-FTC, yellow) Skin (latex)
B7.5-ALL* Y Y Y Y Y
B7.5-NO
GT Y Y Y Y
B7.5-NO
PM Y Y Y Y
B7.5-NO
GT/PM Y Y Y
*Optiay 320/ml was used as contrast agent for the glandular tissue (GT) to get the correct ratio with fatty tissue
Density measurements
Three experiments were used to estimate density of the phantoms: (i), the raw data of
mammographic images were analyzed in the Volpara software to obtain the VBD%; (ii), HU values were measured on CT images; and (iii), physical density (g/cm3) was calculated using a formula with mass and volume. The phantoms were imaged using Full Field Digital
5
Mammography
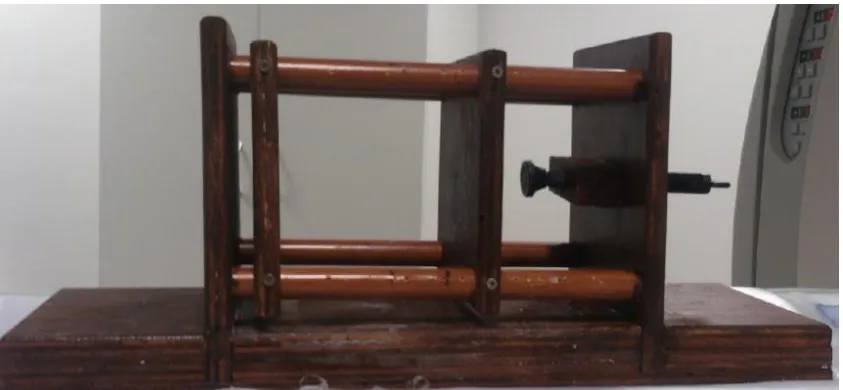
A Hologic Selenia FFDM machine using automatic exposure control (AEC) was used to acquire mammography images. Each phantom was attached to a wooden board support to simulate the chest wall in order to ensure stability with no movement of the phantom or chest wall during phantom thickness reduction and image acquisition (Figure 1). The baseline thickness of the breast phantom was determined by uncompressed contact between the phantom and the imaging detector and compression paddle. The baseline phantom thickness was obtained and used for calculating the subsequent thickness reductions. Three images of each phantom (one image at each level of thickness reduction) were obtained in craniocaudal (CC) view only.
The raw data from mammographic images were imported into the Volpara software (Volpara Density v2) in accordance with manufacturer specifications.
Figure 1: The positioning for mammographic imaging for phantom B7.5-All. Strapping was used around the wooden board to minimise unwanted movement.
CT
[image:6.595.70.264.264.606.2]6
Figure 2: The custom-made jig that enabled phantom thickness reduction on the CT table.
Physical density
Physical density (g/cm3) was calculated using the formula:
𝑝 =𝑚 𝑣
The mass (m) was determined using a weighing scale and the volume (v) by Archimedes Principle. Based on Archimedes Principle, each phantom had ten displaced water
measurements and a mean calculated to minimise random error. Physical density was calculated before mammography (pre-experiment physical density) and after CT (post experiment).
Statistical analyses
For each phantom, three VBD% measurements, three HU measurements and two physical density estimations were obtained, resulting in eight estimations of density for each phantom. Excel and SPSS were used to investigate changes in phantom density by reduction in phantom thickness and differences in pre-experimental and post experimental physical density.
Phantom volume (cm3) versus contact area (area of contact between the phantom and the compression paddle; cm2) and phantom volume versus phantom thickness (mm) was
[image:7.595.74.496.69.264.2]7
RESULTS
All images (n=12) acquired on the Hologic Selenia FFDM system were recognized as breasts by the Volpara software. This was irrespective of the phantom configuration. The VBD% showed a general decrease when phantom thickness was reduced; however this was not a consistent response across all phantom configurations (Figure 3). The largest change in
VBD% was seen for Phantom B7.5-ALL (-3.7) when the thickness was reduced from baseline to 20% reduction in phantom thickness.
Changes in HU, as measured on CT, followed a similar trend to the changes in VBD% for most of the phantoms (Figure 4). The jig, that enabled phantom thickness reduction on the CT table, caused a statistically significant reduction in phantom HU (p <0.001), however, we were interested in the change of HU at different levels of phantom thickness. Phantom B7.5-ALL had a small change in HU (+0.5) with thickness reduction. The largest change in HU was seen for B7.5-NO PM (-5.7) when the thickness was reduced from baseline to 40% reduction in phantom thickness. This phantom had a higher VBD% and HU value than the other phantoms.
[image:8.595.70.411.309.568.2]8
Figure 4: Hounsfield unit (HU) measured on Toshiba CT Aquilion TSX-101A by thickness reduction (0-40%) for each phantom.
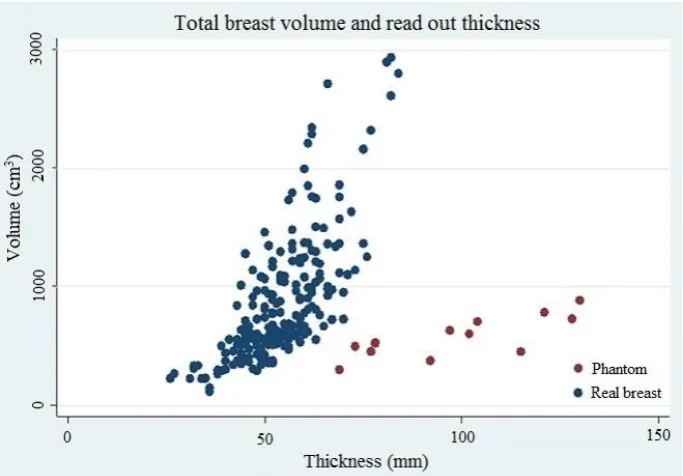
The contact area (cm2)of the phantom was low for the phantom volume (cm3) compared to contact areas versus breast volume of real female breast (Figure 5). Phantom thicknesses (mm), were large for the phantom volume (cm3) compared to the thicknesses versus breast volume for real breast (Figure 6).
Figure 5: Volume (cm3) versus contact area (cm2), with blue dots representing real breast and red dots representing the phantom. The phantom contact area versus phantom volume are low, compared to real breast contact area versus breast volume.
[image:9.595.70.410.68.333.2] [image:9.595.73.442.450.704.2]9
Figure 6: Volume (cm3) versus thickness (mm), with blue dots representing real breast and red dots representing phantom. The phantom thickness were larger versus phantom volume compared to real breasts thickness versus breast volume.
All phantoms had a positive change in physical density (g/cm3) from pre-experimental
physical density to post-experimental physical density (Table 2). To investigate whether these changes in physical density were time dependent, a further 7.5% PVAL breast shaped
phantom was created. For this phantom, physical density and HU values were measured at two-hour intervals over ten hours. No compression was applied to the phantom. The changes in physical density and HU over the ten hours was low and fluctuating, thus it was concluded that phantom density does not change over this time frame, and that the observed fluctation in density in the additional experiment was due to measurement error.
Table 2: The phantom physical density (g/cm3) and percentage change in physical density
(%) from pre-experimental physical density to post experimental physical density.
Phantom
Pre-experimental density (g/cm3)
Post experimental density (g/cm3)
Change in density (%)
B7.5-ALL 0.876 0.988 12.8%
B7.5-NO GT 0.871 0.964 10.7%
B7.5-NO PM 0.691 0.810 17.2%
[image:10.595.71.413.70.308.2]B7.5-NO GT/PM 0.856 0.948 10.7%
Table 3: Physical density (g/cm3) and Hounsfield units (HU) measured for a test phantom every second hour during a day. The percentage change in density is the respective density compared to the density at 08:00.
Time 08:00 10:00 12:00 14:00 16:00 18:00
Density
g/cm3 0.851
0.816 (-4.2%) 0.816 (-4.2%) 0.884 (+3.9%) 0.853 (+0.2%) 0.880 (+3.4%)
Mean HU 23.87 23.93
[image:10.595.70.541.668.758.2]10
DISCUSSION
The aim of this project was to develop and assess a range of deformable breast phantoms, which simulated different breast tissue compositions and densities for assessing the Volpara software. Standardized breast phantoms are necessary for testing the accuracy and reliability of density assessment software, and for investigating the impact of breast thickness reduction on MD. Currently, no such phantom is commercially available. Volpara software recognized all of the phantoms as female breasts; however, we were not able to compress the phantoms to the same level as a female breast without changing phantom density.
Previous experimentation with PVAL12 enabled creation of phantoms. All phantoms had higher HU than a (normal) female breast, since fatty tissue has a negative HU (below zero). However, three phantoms had a HU between 14.3 and 53, which corresponds to documented mean values for female breast.13-15 We implemented several methods to assess phantom density: Raw image data of mammographic images were processed using Volpara software to estimate volumetric breast density (VBD%); Hounsfield units (HU) were measured on CT images; and physical density (g/cm3) was calculated using a formula involving mass and volume. The reduction in phantom thickness had an inconsistent response on phantom VBD% and HU across the phantom configurations, with both an increase and decrease in density. Further, the post experimental physical density was higher than the pre-experimental physical density. Thus, it can be assumed that application of compression force and reducing the phantom thickness causes a change in phantom density. As the phantoms only went through 1-FTC it might be that the molecular crosslinking was not strong enough to withstand the reductions in phantom thickness (up to 40% reduction in thickness). However, an increasing number of FTCs would cause the phantom to become stiffer (less deformable), resulting in a phantom property less like a female breast.
When assessing the phantoms in the debug mode of the Volpara software, we found that the software did not find good reference points within the phantoms. This is probably due to the phantoms having a different “breast edge” than female breasts. Further, phantom volume versus contact area and phantom thickness showed that the phantoms were not compressed to the same level as female breasts. However, in our study we were not able to compress the PVAL further without having a change in the density.11 Thus, future phantoms need to be
more deformable and more stable (i.e. less susceptible to damage due to compression and thickness reduction) in order to make the phantoms more representative of a female breast. A more deformable and more stable phantom should tolerate higher compression forces and further thickness reductions, which would lead to a greater contact area to the phantom volume, which presumably would also reduce the phantom thickness to the phantom volume. Another solution to find correct reference points of the phantoms would be modification of the Volpara algorithm; however, this would reduce the purpose of the phantoms.
11
CONCLUSION
12
13
References
1. Boyd NF, Martin LJ, Bronskill M, Yaffe MJ, Duric N, Minkin S. Breast tissue composition and susceptibility to breast cancer. Journal of the National Cancer Institute. 2010;102(16):1224-37.
2. McCormack VA, Silva IdS. Breast density and parenchymal patterns as markers of breast cancer risk: a meta-analysis. Cancer Epidemiology Biomarkers & Prevention. 2006;15(6):1159-69.
3. Berg W, Zhang Z, Lehrer D, Jong R, Pisano E, Barr R, et al. Detection of breast cancer with addition of annual screening ultrasound or a single screening MRI to
mammography in women with elevated breast cancer risk. JAMA. 2012;307(13):1394-404. 4. Sickles EA, D’Orsi CJ, al LWBe. ACR RADS® Mammography. ACR BI-RADS® Atlas, Breast Imaging Reporting and Data System. Reston, VA: American College of Radiology; 2013.
5. Ekpo EU, Hogg P, Highnam R, McEntee MF. Breast composition: Measurement and clinical use. Radiography. 2015;21(4):324-33.
6. Highnam R, Brady M, Yaffe MJ, Karssemeijer N, Harvey J. Robust breast
composition measurement - VolparaTM. Digital Mammography: Springer Berlin Heidelberg; 2010. p. 342-9.
7. Seo JM, Ko ES, Han BK, Ko EY, Shin JH, Hahn SY. Automated volumetric breast density estimation: a comparison with visual assessment. Clinical radiology. 2013;68(7):690-5.
8. Kopans D. Breast imaging. 3 ed. London: Lippincott Williams & Wilkins; 2007. 9. National quality assurance coordinating group for Radiography. National Health Service Cancer Screening Programmes (NHSBSP): Quality assurance guidelines for
mammography including radiographic quality control. NHS Cancer Screening Programmes Sheffield; 2006.
10. Mercer C, Szczepura K, Kelly J, Milington SR, Denton ERE, Borgen R, et al. A 6-year study of mammographic compression force: Practitioner variability within and between screening sites. Radiography. 2015;21(1):68-73.
11. Wåde GG, Hogg P, Hofvind S. Developing and assessing a breast phantom for testing a fully automated density software: A pilot study. Hold pusten. 2014;41(8):19-21.
http://project.vbook.no/project.asp?version_id=1345&page=19
12. Ossati MS. Design, development and use of a deformable breast phantom to assess the relationship between thickness and lesion visibility in full field digital mammography. Doctor of Philosophy. Salford, UK: University of Salford; 2015. p. 117-72.
13. Boone JM, Nelson TR, Lindfors KK, Seibert JA. Dedicated Breast CT: Radiation Dose and Image Quality Evaluation. Radiology. 2001;221(3):657-67.
14. Miyake K, Hayakawa K, Nishino M, Nakamura Y, Morimoto T, Urata Y, et al. Benign or malignant?: differentiating breast lesions with computed tomography attenuation values on dynamic computed tomography mammography. Journal of computer assisted tomography. 2005;29(6):772-9.
15. Nogueira L, de Campos T. Radiological response of ceramic and polymeric devices for breast brachytherapy. Applied Radiation and Isotopes. 2012;70(4):663-9.