International Journal of Emerging Technology and Advanced Engineering
Website: www.ijetae.com (ISSN 2250-2459,ISO 9001:2008 Certified Journal, Volume 3, Issue 11, November 2013)
44
Performance Based Analysis of Seismic Capacity of Mid Rise
Building
Kallol Barua
1, S. M. Hasanur Rahman
2, Susen Das
31,2
Lecturer, Dept. of Civil Engineering, Stamford University Bangladesh, Bangladesh.
3Research Assistant, University of Alberta, Canada.
Abstract— With a view of evaluating the seismic performance of building designed as per BNBC, performance based analysis was studied in an in-depth way. Conventionally designed regular bare frame structures under design basis
earthquake, serviceability earthquake and maximum
earthquake were found to be adequate. Besides, due to the effect of infill on the full in-filled frame structures, deformation pattern was uniform and total deformation was lower than any other type analyzed and signified consideration of infill effect improved the performance of the structure. But addition of infill in the upper stories leaving the ground floor open makes extreme soft storey case which can be fatal for earthquake. Moreover, for the three types of structure considered (bare, full in-filled, soft ground storey), roof displacement was highest for bare frame and ground floor displacement was highest for soft storey. In addition, performance evaluation of the structure which was designed considering only gravity loads couldn’t satisfy the acceptable performance criteria for different types of earthquakes and the structure failed even for small seismic load necessitating consideration of lateral loads for design to be revised.
Keywords—drift ratio, hinges, soft storey, spectral acceleration, and spectral displacement
I. INTRODUCTION
Consideration of earthquake force in structural design has become a serious issue to building owners, engineers, architects and developers in Bangladesh as it lies in a seismically active region. Analysis methods specified in BNBC (equivalent static method and dynamic response spectrum method) have limitation since they are linear methods. On the other hand performance based analysis or pushover analysis is now considered most reliable and effective inelastic analysis method to find actual behavior of the structure in earthquake.
The structures, whose performances are evaluated, are designed with the provisions from BNBC (2006). According to the BNBC equivalent static force method of determining earthquake force is limited to the structures having height of less than 20 meters. Hence this paper deals with some medium rise buildings (six-storied).The buildings investigated are assumed to be located in Dhaka, in seismic zone 2 of seismic zoning map of BNBC 2006.
II. METHODOLOGY
Some medium rise (6 storied) frame structures are modeled and designed with the help of finite element
software ETABS. Earthquake load is calculated
automatically by the program. Wind load is calculated according to Bangladesh National Building Code by developing an excel sheet. Standard load combinations are taken according to BNBC.
For non-linear analysis ATC -40 is reviewed thoroughly. Hinge property is chosen from the provided experimental data. Allowable hinge deformation at different performance level for beams and columns is established. Hinges are assigned to each element. Structure are then subjected to push over analysis which include progressive damage of elements with plastic deformation of the hinge assigned on the element of the structure as the structure is laterally pushed through. Capacity spectrum method (ATC 40) is employed for finding performance situation of the building. Available member ductility was then compared with the acceptable limit given in ATC-40, and find out what level of safety they conform to.
III. LITERATURE REVIEW
International Journal of Emerging Technology and Advanced Engineering
Website: www.ijetae.com (ISSN 2250-2459,ISO 9001:2008 Certified Journal, Volume 3, Issue 11, November 2013)
45
A. Equivalent static force method
In this method the dynamic earthquake effect is represented by an equivalent static load at different levels in proportion to mass at that level. In this process BNBC devises the country into three region of different possible earthquake ground response (0.075g, 0.15g, and 0.25g).The total design base shear for a seismic zone is given by,
W R ZIC
V , Where, Z= seismic zone co-efficient
I= Structural importance co-efficient
C= Numerical co-efficient =
T = Time period =
Where, Ct = 0.083 for moment resisting frame = 0.073 for reinforced concrete = 0.049 for all other structural analysis hn = Height in meter above base level n
S = Site co-efficient
R= Response modification co-efficient W= Total seismic dead load
Lateral force calculated from the above equation known as base shear V, shall be distributed along the height of the structure in accordance with the following equation
V = Ft +
n i
i i
F
1
Where, Fi = Lateral force applied at storey level I and Ft = Concentrated lateral force considered at the top of the building in addition to the force Fn.
B. Response Spectrum Method
BNBC recommends that response spectrum to be used in dynamic analysis shall be either of the following:
Site Specific Design Spectra: A site specific design spectra shall be developed base on the geologic, tectonic, seismologic, and soil characteristics associated with the specific site.
Normalized Response Spectra: In absence of a site-specific response spectrum, the normalized response spectra shall be used.
The capacity spectrum method initially characterizes seismic demand using an elastic response spectrum. This spectrum is plotted in spectral ordinates (ADRS) format showing the spectral acceleration as a function of spectral displacement. To find the point where demand and capacity are equal, a point on the capacity spectrum need to be selected as an initial estimate. Using the spectral acceleration and displacement defined by this point, reduction factors may be calculated to apply to the 5% elastic spectrum to account for the hysteretic energy dissipation, or effective damping, associated with the specific point. If the reduced demand spectrum intersects the capacity spectrum at or near the initial assumed point, then this is the performance point where the capacity of the structure matches the demand of the specific earthquake.
IV. PERFORMANCE EVALUATION OF BARE FRAME
STRUCTURE
A. Geometrical and Material Specification
A three dimensional bare frame structure is designed by static design procedure as per BNBC code. Here performance of the structure will be evaluated by static non linear pushover analysis using ETABS. The nonlinear analysis will be done as per ATC40 (1996). The structure is a 6 storey, 3x3 bay residential building. Length of each bay is 20 feet in X direction and 15 feet in Y direction. The height of grade beam from the base is 6 feet and each storey height is 10 feet. From calculation the slab thickness is taken 6 inches. Initially all the beams are taken 12˝X15˝and the columns are assumed 12˝X12˝. Later the beam and column sizes are modified according to design by ETABS. Design code ACI 318-99 has been followed for the design of members. Steel ratio in columns is found to be 1.00% to 3.85% at different level. Concrete material was used in the design of reinforced concrete beam and column having the following properties: cylinder strength of concrete, fc´ = 4 ksi, yield strength of steel, fy = 60 ksi, modulus of elasticity, Ec = 3600 ksi, standard steel bar was used as reinforcing material.
B. Loading Condition
Self weight is calculated automatically by the program. In addition to self weight 30 psf of floor-finish and 40 psf of future partition wall are considered as dead load in typical floor level. In the typical floor live load is considered as 40 psf. At roof dead load and live load are considered respectively 30 psf and 20 psf. Wind load is calculated according to BNBC.
3 2
25 . 1
T S
4 3n t
h
International Journal of Emerging Technology and Advanced Engineering
Website: www.ijetae.com (ISSN 2250-2459,ISO 9001:2008 Certified Journal, Volume 3, Issue 11, November 2013)
46 Here site location Dhaka, basic wind speed 210 km/hr, exposure A and Structure importance coefficient, CI= 1.00 (standard occupancy structure) is considered. Seismic load was automatically calculated by program as per UBC94.
C. Performance Evaluation
The structure is evaluated here in two aspects. First equivalent static earthquake force is compared with the force that is got in pushover analysis. Then performance point of the structure is analyzed with respect to local (deformed shape and hinge formation) and global (displacement and lateral drift) criteria.
1. Design Basis Earthquake: Performance point is
calculated according to both procedure A & B (ATC 40, 1996). The parameters that are needed to draw the demand spectra in ETABS according to Procedure B are as like Procedure A. For the design basis earthquake the seismic coefficients (CA , CV ) calculated are given below:
Frame type Bare Frame
Seismic Site Coefficient, CA 0.16
Seismic Site Coefficient, CV 0.24
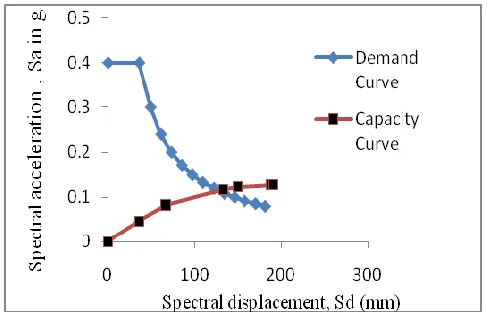
[image:3.612.322.567.125.285.2]Performance point is based on design earthquake which usually occurs within the central portion of the damage control performance range. From the Fig. 1 it is seen that the performance point spectral displacement is 132 mm and spectral acceleration is 0.12 g.
Figure 1: Capacity spectrum of the bare frame structure (Procedure A)
From ETABS (procedure B) Capacity spectrum, it is found that at the performance point spectral displacement is 106.656 mm and spectral acceleration is 0.103g. So according to procedure A demand is higher than the procedure B.
Figure 2: Capacity curve of the bare frame structure
[image:3.612.318.571.435.492.2]From the base shear vs. roof displacement curve illustrated in fig 2, it is seen that up to displacement 84.8 mm (3.34 in), the structure is behaving elastically. As the structure deflects more, it goes to inelastic deformation. At performance point, base shear is 1636 KN (366 kip) and displacement is 133.6 mm (5.26 in). The structure is designed for the earthquake which will generate a force of 3320 KN or 742.8 kip (when R=2). So, the structure will be able to resist almost the force with small degree of damage
TABLE I
Number of hinges formed in the bare frame structures
At the performance point there are almost 15 hinges which are in the range of LS-CP (Table 4.1). If any earthquake occurs which reach the demand of the structure then those structural components where hinges are in the range of LS-CP will damage first. It is assumed that when the extreme earthquake will come then the structural hinges will not cross the LS (Life Safety) limit for design basis earthquake. From the table 4.2 it is seen that the structure satisfies this criteria for design basis earthquake. Because the hinges are within the LS range but don’t cross the LS level.
2. Serviceability Earthquake: For the serviceability
earthquake the seismic coefficients (CA, CV ) calculated are given below :
Frame type Bare Frame
Seismic Site Coefficient, CA 0.12
Seismic Site Coefficient, CV 0.18
A-B B-IO
IO-LS
LS-CP
CP -C
C-D
D-E
> E Total No of
hinges
[image:3.612.47.291.472.632.2]International Journal of Emerging Technology and Advanced Engineering
Website: www.ijetae.com (ISSN 2250-2459,ISO 9001:2008 Certified Journal, Volume 3, Issue 11, November 2013)
[image:4.612.41.296.150.242.2]47 TABLE II
Number of hinges formed in the bare frame structures
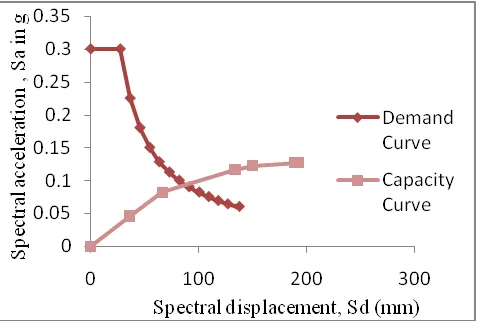
[image:4.612.322.566.184.365.2]From the fig. 3 it is seen that in case of serviceability earthquake, the capacity curve of the bare frame does not have to deform much to meet the demand curve and the performance point is very close to the elastic region. Which means the serviceability earthquake would not cause significant damage to the structure.
Figure 3: Capacity spectrum of the bare frame structure for serviceability earthquake (Procedure A)
For serviceability earthquake, at performance point base shear is 1392.1 KN. For serviceability earthquake the hinges in the structure must not cross the IO (Immediate Occupancy) limit. From the table II, it is seen that the structure satisfies this criteria for serviceability earthquake.
3. Maximum Considered `:
For the maximum considered earthquake the seismic coefficients (CA ,CV ) calculated are given below :
Frame type Bare Frame
Seismic Site Coefficient, CA 0.195
Seismic Site Coefficient, CV 0.285
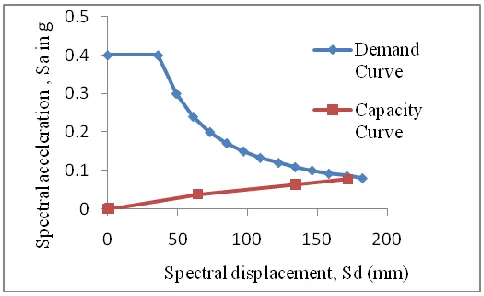
Structure has to deform a lot to meet the demand of maximum earthquake (fig. 4). As a result elements of the structure are stressed beyond their elastic limit and become non linear.
Figure 4: Capacity spectrum of the bare frame structure for Maximum Considered Earthquake (Procedure A)
[image:4.612.50.290.318.479.2]For maximum considered earthquake, at performance point base shear is 1821.4 KN.
TABLE III
Number of hinges formed in the bare frame structures
For maximum considered earthquake the hinges in the structure must not cross the collapse Prevention (CP) limit. From the table III, it is seen that the structure satisfies this criteria for maximum considered earthquake.
4. Lateral Drifts:
From the figure 5, it is seen that at the performance point displacement, the all story drift ratio is less than the maximum IO level (0.01) for serviceability earthquake. Moreover the all story drift ratio is less than the maximum LS level (0.02) for design basis earthquake. So the structure has satisfied the requirement of storey drift ratio criteria. A-B B-IO
IO
-LS
LS-CP CP
-C C
-D D
-E >
E Tot
al
No of
hinge
710 154 32 0 0 0 0 0 896
A-B B-IO
IO -LS
LS -CP
C P-C
C-D
D-E
> E
Tot al
No of
[image:4.612.321.571.435.522.2]International Journal of Emerging Technology and Advanced Engineering
Website: www.ijetae.com (ISSN 2250-2459,ISO 9001:2008 Certified Journal, Volume 3, Issue 11, November 2013)
[image:5.612.48.291.123.290.2]48 Figure 5: storey drift at performance point
The process of doing performance based analysis and the way in which the result can be used to analyze the structure has been reflected. In this structure the design requirements have been checked. Also the performance point displacement and base shear have been analyzed in this chapter. It has been seen that all the storey drift is less than the maximum tolerable drift of the immediate occupancy level for serviceability earthquake & life safety level for design earthquake. In this structure no hinges cross LS level for design basis earthquake, IO level for serviceability earthquake & Collapse Prevention level for maximum considered earthquake, which is quite satisfactory. From the results of base shear and no of hinges formed at different building performance level, it can be said that the structure satisfies the performance objectives and the structure is safe. So a building designed perfectly following BNBC code is safe.
V. PERFORMANCE EVALUATION OF ASTRUCTURE
DESIGNED FOR ONLY GRAVITY LOADS
A. Salient Features of the Structure
The structure is a 6 storey 3x3 bays residential building, located in Dhaka. Length of each bay is 15 feet. Initially all typical floor beams have dimensions 10x12 inch and the columns are 12x12 inch. Typical storey height is 10 feet. The support condition is fixed. The loading condition is same as the previous chapter. The structure is designed only for gravity loads. During design of the structure lateral load effect (earthquake load and wind load) is not considered. After designing the structure, the column sizes are chosen such that the rebar percentage remains in between 2% to 4%.
B. Performance Evaluation
After pushover analysis, it is seen that at X direction no performance point is found. This means the structure fails at very small load produced by earthquake. But in Y direction performance point is found, which is evaluated here only. For serviceability earthquake CA and CV are respectively 0.12 and 0.18. At performance point, base shear is 729 KN and displacement is 150 mm. But the structure has to deform a lot to meet the demand (fig. 6). As a result the elements are stressed beyond their elastic limits.
Figure 6: Capacity spectrum for serviceability earthquake
[image:5.612.322.567.270.414.2]For design earthquake CA and CV are respectively 0.16 and 0.24. At performance point, base shear is 915.4 KN and displacement is 201 mm. The performance point is found just prior to the failure (fig. 7).
Figure 7: Capacity spectrum for design earthquake
[image:5.612.323.565.484.632.2]International Journal of Emerging Technology and Advanced Engineering
Website: www.ijetae.com (ISSN 2250-2459,ISO 9001:2008 Certified Journal, Volume 3, Issue 11, November 2013)
[image:6.612.318.567.114.281.2]49 Figure 8: Capacity spectrum for maximum earthquake
C. Hinge Formation
At performance point hinge formation for different types of earthquake has been shown in table IV
TABLE IV
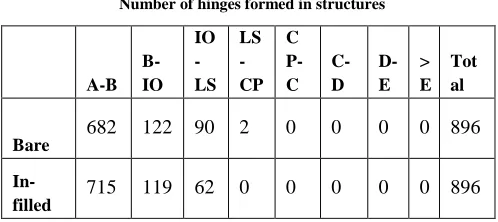
Number of hinges formed in structures
From the table IV, it is seen that for serviceability earthquake there are 24 hinges in the LS-CP range, which should not cross the IO level. Moreover, for design earthquake there are 2 hinges at CP-C level, which should not cross the LS level. So the structure will not sustain during the earthquake.
D. Lateral Drifts
[image:6.612.49.290.132.292.2]From the fig. 9, it is noticeable that for serviceability earthquake the drift for ground floor crosses the maximum Immediate Occupancy limit. The drift for ground floor also crosses the maximum Life Safety limit for design earthquake. So a structure designed only for gravity loads without considering earthquake load is totally unsafe.
Figure 9: Comparison of storey drift
VI. COMPARISON OF ABARE AND AN IN-FILLED
STRUCTURE
A. Salient Features of the Structure
The structure is a 6 storey 3x3 bays residential building, located in Dhaka. Length of each bay is 15 feet. All typical floor beams have dimensions 12x20 inch and the columns are 18x18 inch. Typical storey height is 10 feet. The support condition is fixed. The loading condition is same as the previous chapter.
B. Performance Point
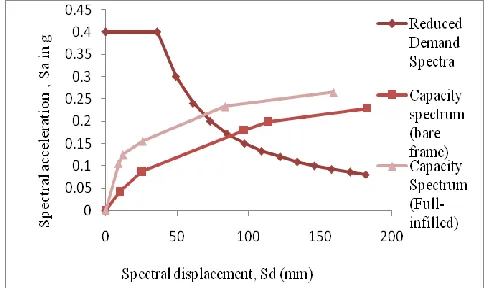
From the capacity spectrum of the bare frame and in-filled frame it is seen that base shear at performance point for in-filled frame is much greater than the bare frame. It is observed that capacity of bare frame meet demand but structure has to deform a considerable amount to meet the demand curve. As a result some of its elements are stressed above their elastic limit and become nonlinear. But for the in-filled frame the deformation of the structure is less than the bare frame (fig. 10). So the structure would not be damaged significantly at performance point.
Figure 10: Capacity spectrum for the In-filled frame (Method A) A-B
B-IO
IO -LS
LS-CP
CP -C
C -D
D -E
> E Total
Servicea bility
EQ
646 194 32 24 0 0 0 0 896
Design EQ
616 206 44 28 2 0 0 0 896
Maxm EQ
[image:6.612.48.307.364.546.2] [image:6.612.322.565.560.704.2]International Journal of Emerging Technology and Advanced Engineering
Website: www.ijetae.com (ISSN 2250-2459,ISO 9001:2008 Certified Journal, Volume 3, Issue 11, November 2013)
50 At performance point, the spectral acceleration and spectral displacement is 0.14g and 67.41 mm for bare frame and 0.18g and 41.67 mm for in-filled structure (method B). By method A the spectral acceleration and spectral displacement is 0.17g and 88.4 mm for bare frame and 0.21g and 67.24 mm for in-filled structure. So in both methods, the spectral displacement is small for in-filled structure compared to bare frame.
C. Deformed Shape and Hinge Condition
[image:7.612.324.563.126.482.2]The deformation pattern of an in-filled frame differs significantly from that of a bare frame structure.
TABLE V
Number of hinges formed in structures
The bare frame structure can hardly meet the demand of earthquake at a large displacement and damage of the structure is significant. The in-filled structure gives much better performance with no hinges in the LS-CP range. But it is seen that for bare frame there are 2 hinges in the LS-CP range. Moreover the number of hinges in the IO-LS range is greater for bare frame structure compared to in-filled frame. So performance of in-in-filled frame is much better than that of bare frame. This occurs, due to taking the effect of partition wall. When earthquake force comes, then at first partition wall damages and subsequent damage occurs at beam and column slightly.
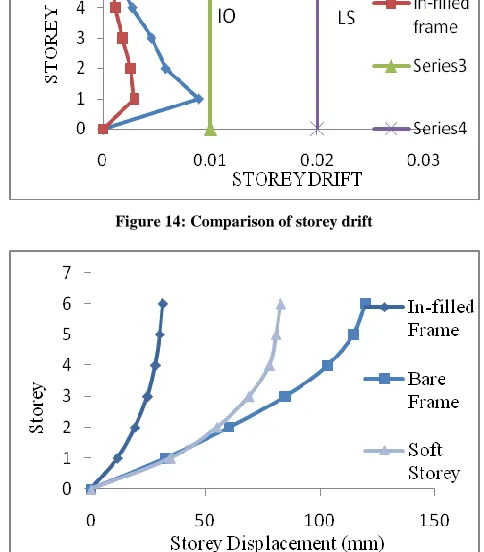
D. Lateral Drift and Displacement
At performance point, displacement for bare frame is 84 mm, which is much larger than in-filled frame for which displacement is 50 mm. Storey drift is maximum for ground floor as shown in fig. 11. From the fig. 12, it is seen that at performance point, displacement of different storey for in-filled frame is less than that of bare frame and each storey deforms uniformly. All the storey drift for in-filled frame is less than the maximum IO level which is 0.01. But for bare frame the storey drift for ground floor just cross the Immediate Occupancy level. So considering lateral drift and displacement it can be said that, the in-filled frame structure has better performance than that of bare frame structure.
Figure 11: Comparison of storey drift
Figure 12: Comparison of storey displacement
VII. EVALUATION OF ASOFT STOREY STRUCTURE
A. Description Of The Structure
A regular structure which has all the storey height same was designed first and then to use the ground floor as a car parking its partition walls were removed, which has become a soft storey. Loading condition, material property and salient features of the structure are same as the full in-filled structure described in the previous article. In the following analysis the soft storey structure will be compared with the full in-filled frame structure.
D. Deformation Pattern and Hinge Condition
The deformation pattern of a soft storey structure differs significantly from that of a full in-filled frame. Formation of column hinges is noticeable in the soft storey structure compared to full in-filled frame. So, soft storey structure is considered vulnerable for earthquake.
A-B B-IO
IO -LS
LS -CP
C P-C
C-D
D-E
> E
Tot al
Bare
682 122 90 2 0 0 0 0 896
In-filled
[image:7.612.42.291.290.401.2]International Journal of Emerging Technology and Advanced Engineering
Website: www.ijetae.com (ISSN 2250-2459,ISO 9001:2008 Certified Journal, Volume 3, Issue 11, November 2013)
[image:8.612.53.302.145.287.2]51 TABLE VI
Number of hinges formed in the full in-filled and soft storey structure at performance point
E. Performance Evaluation
From the fig. 13 it is seen that, the soft storey structure is slightly ductile than full in-filled structure. At performance point maximum tolerable base shear for soft storey structure is 2394 KN, which is lower than regular structure (2526 KN).
Figure 13: Comparison of capacity spectrum
[image:8.612.322.564.185.461.2]The storey displacement as illustrated in fig. 15 is highest for the bare frame and soft storey structure has higher displacement than in-filled frame. Maximum drift as fig. 14 occurs at ground floor which is the soft storey. So designer should be careful about the soft storey behavior. Drift for the both structure are below the maximum IO limit. So, they are safe from drift criteria.
[image:8.612.84.268.363.489.2]Figure 14: Comparison of storey drift
Figure 15: Comparison of storey displacement
VIII. EVALUATION OF ASTRUCTURE WITH NO PARTITION
WALLS ON APARTICULAR FLOOR
A. Description of the Structure
A regular structure which has infill masonry panel in all the floors was designed first and then to use the fourth floor as a commercial hall, its partition walls were removed. Loading condition, material property and salient features of the structure are as same as the full in-filled structure. A-B
B-IO
IO -LS
LS-CP
C P -C
C-D
D-E
> E
Tot al
Soft
storey 732 102 60 2 0 0 0 0 896
In-filled
International Journal of Emerging Technology and Advanced Engineering
Website: www.ijetae.com (ISSN 2250-2459,ISO 9001:2008 Certified Journal, Volume 3, Issue 11, November 2013)
52
A. Performance Evaluation
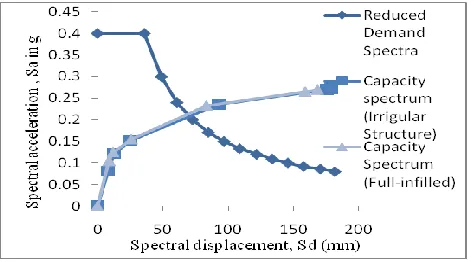
[image:9.612.52.289.212.343.2]By comparing capacity spectrum of full in-filled frame and irregular structure, it is seen that irregular structure deforms more than the full in-filled frame and at performance point maximum tolerable base shear is slightly greater for full in-filled frame (fig. 16).
Figure 16: Comparison of capacity spectrum
[image:9.612.49.291.436.688.2]The roof displacement is greater for irregular structure than full in-filled frame (fig. 18). The storey drift as shown in fig. 17 is very high for that particular soft storey. Drift for the both structure are below the maximum IO limit. So, they are safe from drift criteria. But the performance for full in-filled frame is much better than irregular structure.
Figure 17: Comparison of storey drift
Figure 18: Comparison of storey displacement
IX. CONCLUSIONS
Both bare and in-filled frame buildings designed as per BNBC were considered and their seismic performance and soft storey behavior under seismic action were evaluated in a detailed way. Performance of a regular structure designed according to BNBC meets performance objectives for design basis earthquake, serviceability earthquake and maximum considered earthquake. The seismic performance of full in-filled frame has been observed to be better than that of bare frame. But the addition of infill in the upper stories leaving the ground floor open makes extreme soft storey case which can be fatal for earthquake. The overall performance of regular structures is found to be better than that of irregular structures.
REFERENCES
[1] ACI Committee 318.(2002) Building Code Requirement for Structural Concrete, American Concrete Institute, Detroit, USA. [2] ATC (1996) Seismic Evaluation and Retrofit of Concrete Building
(volume 1), Report (ATC-40), Applied Technology Council, California, USA.
[3] BNBC (2006) Bangladesh National Building Code, Housing and Building Research Institute, Mirpur, Dhaka, Bangladesh.
[4] Computer and Structures Inc., ETABS Nonlinear Version 8.5.0, California, USA.
[5] FEMA 356, 273.(2002) Pre-standard and Commentary for the Seismic Rehabilitation of Buildings, Federal Emergency Management Agency, Washington D.C., USA.
[6] Habibullah, A. and Pyle, S., (1998), Practical Three Dimensional Nonlinear Pushover Analysis, Structure Magazine, Winter. [7] National Information Center of Earthquake Engineering (2011), EQ
tips.
[8] Nilson, A.H., Darwin, D., and Dolan, C.W.(2003) Design of Concrete Structure (Thirteenth edition), Mc Graw Hill, New York, USA.