International Journal of Emerging Technology and Advanced Engineering
Website: www.ijetae.com (ISSN 2250-2459,ISO 9001:2008 Certified Journal, Volume 4, Issue 6, June 2014)
529
Data Mining Techniques and Research Challenges and Issues
Girish Kumar Sorot
Arya Institute of Engineering and Technology, Kukas Industrial Area(RIICO), Delhi Road, Jaipur, Rajasthan(India)
Abstract-- Data mining is considered to deal with huge amounts of data which are kept in the database, to locate required information and facts. Data mining is the exploration and analysis of large quantities of data in order to discover valid, novel, potentially useful, and ultimately understandable patterns in data. Non trivial extraction of implicit, previously unknown and potentially useful information from data Exploration & analysis, by automatic or semi-automatic means, of large quantities of data in order to discover meaningful patterns. In this paper, we discuss the data mining techniques and functionalities with application. Also discuss the research challenges in science and engineering, from the data mining perspective, with a focus on the data mining issues.
Keyword-- data mining, data mining techniques and functionalities, research challenges, data mining issues.
I. INTRODUCTION
With the enormous amount of data stored in files, databases, and other repositories, it is increasingly important, if not necessary, to develop powerful means for analysis and perhaps interpretation of such data and for the extraction of interesting knowledge that could help in decision-making.
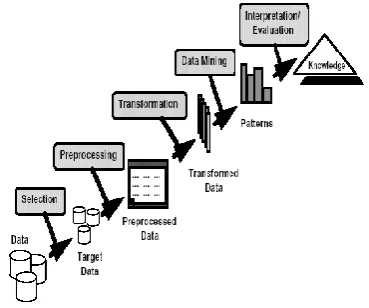
[image:1.595.70.255.524.678.2]Data Mining, also popularly known as Knowledge Discovery in Databases (KDD), refers to the nontrivial extraction of implicit, previously unknown and potentially useful information from data in databases.
Figure 1 Data mining (Knowledge discovery in database)
While data mining and knowledge discovery in databases (or KDD) are frequently treated as synonyms, data mining is actually part of the knowledge discovery process. Figure1 shows data mining as a step in an iterative knowledge discovery process.
The development of Information technology has paved way to generate large amount of databases and huge data in various areas. The research in databases and information technology has given rise to approach to store and manipulate precious data for further decision making [1]. Data mining is a process to extract the implicit information and knowledge by extracting from the mass, incomplete, noisy, fuzzy and random data with knowing the data well in advance and which is potentially useful to various fields [2].
Topics of interest include but are not limited to practical areas that span a variety of aspects of data integration and mining including Large-scale data integration and mining , Metadata integration and management, Data security and privacy, Social media data analysis and computing,
Web-scale data mining and semantic discovery, Network data integration and delivery, Data filtering and cleaning,
Data integration environments and applications, Data models, schemas, Database integration systems, Data management and analysis in specific application domains Data mining algorithms are widely used today for the analysis of large corporate and scientific datasets stored in databases and data archives. Industry, science, and commerce fields often need to analyze very large datasets maintained over geographically distributed sites by using the computational power of distributed and parallel systems.
II.DATA MIMINING TECHNIQES AND FUNCTIONALITIES
The data mining functionalities and the variety of knowledge they discover are briefly presented in the following list:
A. Characterization:
International Journal of Emerging Technology and Advanced Engineering
Website: www.ijetae.com (ISSN 2250-2459,ISO 9001:2008 Certified Journal, Volume 4, Issue 6, June 2014)
530
B. Discrimination:Data discrimination produces what are called discriminant rules and is basically the comparison of the general features of objects between two classes referred to as the target class and the contrasting class. For example, one may want to compare the general characteristics of the customers who rented more than 30 movies in the last year with those whose rental account is lowerthan 5. The techniques used for data discrimination are very similar to the techniques used for data characterization with the exception that data discrimination results include comparative measures.
C. Association analysis:
Association analysis is the discovery of what are commonly called association rules. It studies the frequency of items occurring together in transactional databases, and based on a threshold called support, identifies the frequent item sets. Another threshold, confidence, which is the conditional probability than an item appears in a transaction when another item appears, is used to pinpoint association rules. Association analysis is commonly used for market basket analysis. For example, it could be useful for the OurVideoStore manager to know what movies are often rented together or if there is a relationship between renting a certain type of movies and buying popcorn or pop. The discovered association rules are of the form: P->Q [s,c], where P and Q are conjunctions of attribute value-pairs, and s (for support) is the probability that P and Q appear together in a transaction and c (for confidence) is the conditional probability that Q appears in a transaction when P is present. For example, the hypothetic association rules:
RentType(X, “game”) ɅAge(X, “13-19”) ->Buys(X, “pop”) [s=2% ,c=55%] would indicate that 2% of the transactions considered are of customers aged between 13 and 19 who are renting a game and buying a pop, and that there is a certainty of 55% that teenage customers who rent a game also buy pop.
1) Association Rule Discovery: Application
1.1 Supermarket shelf management.
Goal: To identify items that are brought together by sufficiently many customers.
Approach: Process the point-of-sale data collected with barcode scanners to find dependencies among items.
A classic rule - If a customer buys diaper and milk, then he is very likely to buy beer. So, don’t be surprised if you find six-packs stacked next to diapers!
1.2 Inventory Management:
Goal: A consumer appliance repair company wants to anticipate the nature of repairs on its consumer products and keep the service vehicles equipped with right parts to reduce on number of visits to consumer households.
Approach: Process the data on tools and parts required in previous repairs at different consumer locations and discover the co-occurrence patterns.
D. Classification:
Classification analysis is the organization of data in given classes. Also known as supervised classification, the classification uses given class labels to order the objects in the data collection. Classification approaches normally use a training set where all objects are already associated with known class labels. The classification algorithm learns from the training set and builds a model. The model is used to classify new objects. For example, after starting a credit policy, the OurVideoStore managers could analyze the customers’ behaviours vis-à-vis their credit, and label accordingly the customers who received credits with three possible labels ―safe‖, ―risky‖ and ―very risky‖. The classification analysis would generate a model that could be used to either accept or reject credit requests in the future.
1) Classification: Application
1.1 Direct Marketing
Goal: Reduce cost of mailing by targeting a set of consumers likely to buy a new cell-phone product.
Approach: Use the data for a similar product introduced before. We know which customers decided to buy and which decided otherwise. This {buy, don’t buy} decision forms the class attribute.
Collect various demographic, lifestyle, and company interaction related information about all such customers. Type of business, where they stay, how much they earn, etc. Use this information as input attributes to learn a classifier model.
1.2 Fraud Detection
Goal: Predict fraudulent cases in credit card transactions. Approach: Use credit card transactions and the information on its account-holder as attributes. When does a customer buy, what does he buy, how often he pays on time, etc.
Label past transactions as fraud or fair transactions. This forms the class attribute.
Learn a model for the class of the transactions. Use this model to detect fraud by observing credit card transactions on an account.
E. Prediction:
International Journal of Emerging Technology and Advanced Engineering
Website: www.ijetae.com (ISSN 2250-2459,ISO 9001:2008 Certified Journal, Volume 4, Issue 6, June 2014)
531
Once a classification model is built based on a training set, the class label of an object can be foreseen based on the attribute values of the object and the attribute values of the classes. Prediction is however more often referred to the forecast of missing numerical values, or increase/ decrease trends in time related data. The major idea is to use a large number of past values to consider probable future values.F. Clustering:
Similar to classification, clustering is the organization of data in classes. However, unlike classification, in clustering, class labels are unknown and it is up to the clustering algorithm to discover acceptable classes. Clustering is also called unsupervised classification, because the classification is not dictated by given class labels. There are many clustering approaches all based on the principle of maximizing the similarity between objects in a same class (intra-class similarity) and minimizing the similarity between objects of different classes (inter-class similarity).
1) Clustering: Application
1.1. Market Segmentation:
Goal: subdivide a market into distinct subsets of customers where any subset may conceivably be selected as a market target to be reached with a distinct marketing mix.
Approach: Collect different attributes of customers based on their geographical and lifestyle related information. Find clusters of similar customers. Measure the clustering quality by observing buying patterns of customers in same cluster vs. those from different clusters.
1.2. Document Clustering:
Goal: To find groups of documents that are similar to each other based on the important terms appearing in them.
Approach: To identify frequently occurring terms in each document. Form a similarity measure based on the frequencies of different terms. Use it to cluster.
Gain: Information Retrieval can utilize the clusters to relate a new document or search term to clustered documents.
G. Outlier analysis:
Outliers are data elements that cannot be grouped in a given class or cluster. Also known as exceptions or surprises, they are often very important to identify. While outliers can be considered noise and discarded in some applications, they can reveal important knowledge in other domains, and thus can be very significant and their analysis valuable.
H. Evolution and deviation analysis:
Evolution and deviation analysis pertain to the study of time related data that changes in time. Evolution analysis models evolutionary trends in data, which consent to characterizing, comparing, classifying or clustering of time related data. Deviation analysis, on the other hand, considers differences between measured values and expected values, and attempts to find the cause of the deviations from the anticipated values. It is common that users do not have a clear idea of the kind of patterns they can discover or need to discover from the data at hand. It is therefore important to have a versatile and inclusive data mining system that allows the discovery of different kinds of knowledge and at different levels of abstraction. This also makes interactivity an important attribute of a data mining system.
III. ISSUES IN DATA MINING
Data mining algorithms embody techniques that have sometimes existed for many years, but have only lately been applied as reliable and scalable tools that time and again outperform older classical statistical methods. While data mining is still in its infancy, it is becoming a trend and ubiquitous. Before data mining develops into a conventional, mature and trusted discipline, many still pending issues have to be addressed. Some of these issues are addressed below. Note that these issues are not exclusive and are not ordered in any way.
A. Security and social issues:
International Journal of Emerging Technology and Advanced Engineering
Website: www.ijetae.com (ISSN 2250-2459,ISO 9001:2008 Certified Journal, Volume 4, Issue 6, June 2014)
532
B. User interface issues:The knowledge discovered by data mining tools is useful as long as it is interesting, and above all understandable by the user. Good data visualization eases the interpretation of data mining results, as well as helps users better understand their needs. Many data exploratory analysis tasks are significantly facilitated by the ability to see data in an appropriate visual presentation. There are many visualization ideas and proposals for effective data graphical presentation. However, there is still much research to accomplish in order to obtain good visualization tools for large datasets that could be used to display and manipulate mined knowledge. The major issues related to user interfaces and visualization are ―screen real-estate‖, information rendering, and interaction. Interactivity with the data and data mining results is crucial since it provides means for the user to focus and refine the mining tasks, as well as to picture the discovered knowledge from different angles and at different conceptual levels.
C. Mining methodology issues:
These issues pertain to the data mining approaches applied and their limitations. Topics such as versatility of the mining approaches, the diversity of data available, the dimensionality of the domain, the broad analysis needs (when known), the assessment of the knowledge discovered, the exploitation of background knowledge and metadata, the control and handling of noise in data, etc. are all examples that can dictate mining methodology choices. For instance, it is often desirable to have different data mining methods available since different approaches may perform differently depending upon the data at hand. Moreover, different approaches may suit and solve user’s needs differently. Most algorithms assume the data to be noise-free. This is of course a strong assumption. Most datasets contain exceptions, invalid or incomplete information, etc., which may complicate, if not obscure, the analysis process and in many cases compromise the accuracy of the results. As a consequence, data preprocessing (data cleaning and transformation) becomes vital. It is often seen as lost time, but data cleaning, as time consuming and frustrating as it may be, is one of the most important phases in the knowledge discovery process. Data mining techniques should be able to handle noise in data or incomplete information. More than the size of data, the size of the search space is even more decisive for data mining techniques. The size of the search space is often depending upon the number of dimensions in the domain space. The search space usually grows exponentially when the number of dimensions increases. This is known as the curse of dimensionality. This ―curse‖ affects so badly the performance of some data mining approaches that it is becoming one of the most urgent issues to solve.
D. Performance issues:
Many artificial intelligence and statistical methods exist for data analysis and interpretation. However, these methods were often not designed for the very large data sets data mining is dealing with today. Terabyte sizes are common. This raises the issues of scalability and efficiency of the data mining methods when processing considerably large data. Algorithms with exponential and even medium-order polynomial complexity cannot be of practical use for data mining. Linear algorithms are usually the norm. In same theme, sampling can be used for mining instead of the whole dataset. However, concerns such as completeness and choice of samples may arise. Other topics in the issue of performance are incremental updating, and parallel programming. There is no doubt that parallelism can help solve the size problem if the dataset can be subdivided and the results can be merged later. Incremental updating is important for merging results from parallel mining, or updating data mining results when new data becomes available without having to re-analyze the complete dataset.
F. Data source issues:
International Journal of Emerging Technology and Advanced Engineering
Website: www.ijetae.com (ISSN 2250-2459,ISO 9001:2008 Certified Journal, Volume 4, Issue 6, June 2014)
533
IV. MAJOR RESEARCH CHALLENGESIn this section, we will examine several major challenges raised in science and engineering from the data mining perspective, and point out some promising research directions.
A. Information network analysis
With the development of Google and other effective web search engines, information network analysis has become an important research frontier, with broad applications, such as social network analysis, web community discovery, terrorist network mining, computer network analysis, and network intrusion detection. However, information net- work research should go beyond explicitly formed, homogeneous networks (e.g., web page links, computer networks, and terrorist e-connection networks) and delve deeply into implicitly formed, heterogeneous, and multidimensional information networks. Science and engineering provide us with rich opportunities on exploration of networks in this direction.
There are a lot of massive natural, technical, social, and information networks in science and engineering applications, such as gene, protein, and microarray networks in biology; highway transportation networks in civil engineering; topic- or theme-author-publication-citation networks in library science; and wireless telecommunication networks among commanders, soldiers and supply lines in a battle field. In such information networks, each node or link in a network contains valuable, multidimensional information, such as textual contents, geographic information, traffic flow, and other properties. Moreover, such networks could be highly dynamic, evolving, andinter-dependent.
Many domains of interest today are best described as a network of interrelated heterogeneous objects. As future work, link mining may focus on the integration of link mining algorithms for a spectrum of knowledge discovery tasks. Furthermore, in many applications, the facts to be analyzed are dynamic and it is important to develop incremental link mining algorithms. Besides mining knowledge from links, objects and networks, we may wish to construct an information network based on both ontological and unstructured information.
B. Discovery, understanding, and usage of patterns and knowledge
Scientific and engineering applications often handle massive data of high dimensionality. The goal of pattern mining is to find item sets, subsequences, or substructures that appear in a data set with frequency no less than a user-specified threshold. Pattern analysis can be a valuable tool for finding correlations, clusters, classification models, sequential and structural patterns, and outliers.
Frequent pattern mining has been a focused theme in data mining research for over a decade [HCXY07]. Abundant literature has been dedicated to this research, and tremendous progress has been made, ranging from efficient and scalable algorithms for frequent item set mining in transaction databases to numerous research frontiers, such as sequential pattern mining, structural pattern mining, correlation mining, associative classification, and frequent-pattern-based clustering, as well as their broad applications.
The promotion of effective application of pattern analysis methods in scientific and engineering applications is an important task in data mining. Moreover, it is important to further develop efficient methods for mining long, approximate, compressed, and sophisticated patterns for advanced applications, such as mining biological sequences and networks and mining patterns related to scientific and engineering processes. Furthermore, the exploration of mined patterns for classification, clustering, correlation analysis, and pattern understanding will still be interesting topics in research.
C. Stream data mining
Stream data refers to the data that flows into and out of the system like streams. Stream data is usually in vast volume, changing dynamically, possibly infinite, and containing multi-dimensional features. Typical examples of such data include audio and video recording of scientific and engineering processes, computer network information flow, web click streams, and satellite data flow. Such data cannot be handled by traditional database systems, and moreover, most systems may only be able to read a data stream once in sequential order. This poses great challenges on effective mining of stream data [BBD+02, Agg06].
First, the techniques to summarize the whole or part of the data streams are studied, which is the basis for stream data mining. Such techniques include sampling [DH01], load shedding [TcZ+03] and sketching techniques [Mut03], synopsis data structures [GKMS01], stream cubing [CDH+02], and clustering [AHWY03]. Progress has been made on efficient methods for mining frequent patterns in data streams [MM02], multidimensional analysis of stream data (such as construction of stream cubes) [CDH+02], stream data classification [AHWY04], stream clustering [AHWY03], stream outlier analysis, rare event detection [GFHY07], and so on. The general philosophy is to develop single-scan algorithms to collect information about stream data in tilted time windows, exploring micro-clustering, limited aggregation, and approximation.
International Journal of Emerging Technology and Advanced Engineering
Website: www.ijetae.com (ISSN 2250-2459,ISO 9001:2008 Certified Journal, Volume 4, Issue 6, June 2014)
534
Algorithms have been developed to count frequency using tilted windows [GHPY02] based on the fact that users are more interested in the most recent transactions; approximate frequency counting based on previous historical data to calculate the frequent patterns incrementally [MM02] and track the most frequent k items in the continuously arriving data [CM03].Stream data is often encountered in science and engineering applications. It is important to explore stream data mining in such applications and develop application-specific methods, e.g., real-time anomaly detection in computer network analysis, in electric power grid supervision, in weather modeling, in engineering and security surveillance, and other stream data applications.
D. Mining moving object data, RFID data, and data from sensor networks
With the popularity of sensor networks, GPS, cellular phones, other mobile devices, and RFID technology, tremendous amount of moving object data has been collected, calling for effective analysis. This is especially true in many scientific, engineering, business and homeland security applications.
Sensor networks are finding increasing number of applications in many domains, including battle fields, smart buildings, and even the human body. Most sensor networks consist of a collection of light-weight (possibly mobile) sensors connected via wireless links to each other or to a more powerful gateway node that is in turn connected with an external network through either wired or wireless connections. Sensor nodes usually communicate in a peer-to-peer architecture over an asynchronous network. In many applications, sensors are deployed in hostile and difficult to access locations with constraints on weight, power supply, and cost. Moreover, sensors must process a continuous (possibly fast) stream of data. Data mining in wireless sensor networks (WSNs) is a challenging area, as algorithms need to work in extremely demanding and constrained environment of sensor networks (such as limited energy, storage, computational power, and bandwidth). WSNs also require highly decentralized algorithms.
Development of algorithms that take into consideration the characteristics of sensor networks, such as energy and computation constraints, network dynamics, and faults, constitute an area of current research. Some work has been done in developing localized, collaborative, distributed and self-configuration mechanisms in sensor networks.
In designing algorithms for sensor networks, it is imperative to keep in mind that power consumption has to be minimized. Even gathering the distributed sensor data in a single site could be expensive in terms of battery power consumed, some attempts have been made towards making the data collection task energy efficient and balance the energy-quality trade-offs.
Clustering the nodes of the sensor networks is an important optimization problem. Nodes that are clustered together can easily communicate with each other, which can be applied to energy optimization and developing optimal algorithms for clustering sensor nodes. Other works in this field include identification of rare events or anomalies, finding frequent item sets, and data preprocessing in sensor networks.
Recent years have witnessed and enormous increase in moving object data from RFID records in supply chain operations, toll and road sensor readings from vehicles on road networks, or even cell phone usage from different geographic regions. These movement data, including RFID data, object trajectories, anonymous aggregate data such as the one generated by many road sensors, contain rich information. Effective management of such data is a major challenge facing society today, with important implications into business optimization, city planning, privacy, and national security. Interesting research has been conducted on warehousing RFID data sets [GHLK06], which could handle moving object data sets by significantly compressing such data, and proposing a new aggregation mechanism that preserves their path structures. Mining moving objects is a challenging problem due to the massive size of the data, and its spatiotemporal characteristics. The methods developed along this line include Flow Graph [GHL06b], which is a probabilistic model that captures the main trends and exceptions in moving object data, and FlowCube [GHL06a], which is a multi-dimensional extension of the FlowGraph and an adaptive fastest path algorithm [GHL+07] that computes routes based on driving patterns present in the data. RFID systems are known to generate noisy data so data cleaning is an essential task for the correct interpretation and analysis of moving object data, especially when it is collected from RFID applications and thus demands for cost-effective cleaning methods (such as [GHS07]). One important application with moving objects is automated identification of suspicious movements. A framework for detecting anomalies [LHKG07] is proposed to express object trajectories using discrete pattern fragments, extract features to form a hierarchical feature space and learn effective classification rules at multiple levels of granularity. Another line of work on outlier detection in trajectories focuses on detecting outlying sub-trajectories [LHL08] based on partition-and-detect framework, which partitions a trajectory into a set of line segments, and then, detects outlying line segments for trajectory outliers. The problem of clustering trajectory data [LHW07] is also studied where common sub-trajectories are discovered using the minimum description length (MDL) principle.
International Journal of Emerging Technology and Advanced Engineering
Website: www.ijetae.com (ISSN 2250-2459,ISO 9001:2008 Certified Journal, Volume 4, Issue 6, June 2014)
535
For example, how to explore correlation and regularity to clean noisy sensor network and RFID data, how to integrate and construct data warehouses for such data, how to perform scalable mining for peta-byte RFID data, how to find strange moving objects, how to classify multidimensional trajectory data, and so on. With time, location, moving direction, speed, as well as multidimensional semantics of moving object data, likely multi-dimensional data mining will play an essential role in this study.F. Spatial, temporal, spatiotemporal, and multimedia data mining
Scientific and engineering data is usually related to space, time, and in multimedia modes (e.g., containing color, image, audio, and video). With the popularity of digital photos, audio DVDs, videos, YouTube, web-based map services, weather services, satellite images, digital earth, and many other forms of multimedia, spatial, and spatiotemporal data, mining spatial, temporal, spatiotemporal, and multimedia data will become increasingly popular, with far-reaching implications [MH01, SC03]. For example, mining satellite images may help detect forest fire, find unusual phenomena on earth, predict hurricane landing site, discover weather patterns, and outline global warming trends.
Spatial data mining is the process of discovering interesting and previously unknown, but potentially useful patterns from large spatial data sets [SZHV04]. Extracting interesting and useful patterns from spatial data sets is more difficult than extracting the corresponding patterns from traditional numeric and categorical data due to the complexity of spatial data types, spatial relationships, and spatial autocorrelation. Interesting research topics in this field include prediction of events at particular geographic locations, detecting spatial outliers whose no-spatial attributes are extreme relative to its neighbors, finding co-location patterns where instances containing the patterns often located in close geographic proximity, and grouping a set of spatial objects into clusters. Future research is needed to compare the difference and similarity between classical data mining and spatial data mining techniques, model semantically rich spatial properties other than neighborhood relationships, design effective statistical methods to interpret the mined spatial patterns, investigate proper measures for location prediction to improve spatial accuracy and facilitate visualization of spatial relationships by representing both spatial and non-spatial features.
The problems of incorporating domain knowledge into mining when data is scarce and integrating data collection with mining are worth studying in spatial data mining, and both theoretical analyses toward general studies of spatial phenomena and empirical model designs targeted for specific applications represent the trends for future research.
Research in this domain needs the confluence of multiple disciplines including image processing, pattern recognition, geographic information systems, parallel processing, and statistical data analysis. Automatic categorization of images and videos, classification of spatiotemporal data, finding frequent/sequential patterns and outliers, spatial collocation analysis, and many other tasks have been studied popularly. With the mounting of such data, the development of scalable analysis methods and new data mining functions will be an important research frontier for years to come.
G. Mining text, Web, and other unstructured data Web is the common place for scientists and engineers to publish their data, share their observations and experiences, and exchange their ideas. There is a tremendous amount of scientific and engineering data on the web. For example, in biology and bioinformatics research, there are GenBank, ProteinBank, GO, PubMed, and many other biological or biomedical information repositories available on theWeb. Therefore, theWeb has become the ultimate information access and processing platform, housing not only billions of link-accessed \pages", containing textual data, multimedia data, and linkages, on the surface Web, but also query-accessible \databases" on the deep Web.With the advent of Web 2.0, there is an increasing amount of dynamic \work°ow" emerging. With its penetrating deeply into our daily life and evolving into unlimited dynamic applications, the Web is central in our information infrastructure. Its virtually unlimited scope and scale render immense opportunities for data mining.
H. Data cube-oriented multidimensional online analytical mining
International Journal of Emerging Technology and Advanced Engineering
Website: www.ijetae.com (ISSN 2250-2459,ISO 9001:2008 Certified Journal, Volume 4, Issue 6, June 2014)
536
Some researchers began to investigate how to conduct traditional data mining and statistical analysis in the multi-dimensional manner efficiently. For example, regression cube [CDH+06] is designed to support efficient computation of the statistical models. In this framework, each cell can be compressed into an auxiliary matrix with a size independent of the number of tuples and then the statistical measures for any data cell can be computed from the compressed data of the lower-level cells without accessing the raw data. In a prediction cube [CCLR05], each cell contains a value that summarizes a predictive model trained on the data corresponding to that cell and characterizes its decision behavior or predictiveness. The authors further show that such cubes can be efficiently computed by exploiting the idea of model decomposition. In [LH07], the issues of anomaly detection in multi-dimensional time-series data are examined. A time-series data cube is proposed to capture the multi-dimensional space formed by the attribute structure and facilitate the detection of anomalies based on expected values derived from higher level, more general time-series. Moreover, an efficient search algorithm is proposed to iteratively select subspaces in the original high-dimensional space and detect anomalies within each one. Recent study on sampling cubes [LHY+08] discuss about the desirability of OLAP over sampling data, which may not represent the full data in the population. The proposed sampling cube framework could efficiently calculate confidence intervals for any multidimensional query and uses the OLAP structure to group similar segments to increase sampling size when needed. Further, to handle high dimensional data, a Sampling Cube Shell method is proposed to effectively reduce the storage requirement while still preserving query result quality. Such multi-dimensional, especially high-dimensional, analysis tools will ensure data can be analyzed in hierarchical, multidimensional structures efficiently and flexibly at user's finger tips. This leads to the integration of online analytical processing with data mining, i.e., OLAP mining. Some efforts have been devoted along this direction, but grand challenge still exist when one needs to explore the large space of choices to find interesting patterns and trends [RC07].We believe that OLAP mining will substantially enhance the power and flexibility of data analysis and lead to the construction of easy-to-use tools for the analysis of massive data with hierarchical structures in multidimensional space. It is a promising research field for developing effective tools and scalable methods for exploratory-based scientific and engineering data mining.
I. Visual data mining
A picture is worth a thousand words. There have been numerous data visualization tools for visualizing various kinds of data sets in massive amount and of multidimensional space [Tuf01].
Besides popular bar charts, pie charts, curves, histograms, quantile plots, quantitle-quantile plots, boxplots, scatter plots, there are also many visualization tools using geometric (e.g., dimension stacking, parallel coordinates), hierarchical (e.g., treemap), and icon-based (e.g., Chernoff faces and stick figures) techniques. Moreover, there are methods for visualizing sequences, time-series data, phylogenetic trees, graphs, networks, web, as well as various kinds of patterns and knowledge (e.g., decision-trees, association rules, clusters and outliers) [FGW01]. There are also visual data mining tools that may facilitate interactive mining based on user's judgement of intermediate data mining results [AEEK99]. Recently, we have developed a DataScope system that maps relational data into 2-D maps so that multidimensional relational data can be browsed in Google map's way [WLX+07]. We believe that visual data mining is appealing to scientists and engineers because they often have good understanding of their data, can use their knowledge to interpret their data and patterns with the help of visualization tools, and interact with the system for deeper and more effective mining. Tools should be developed for mapping data and knowledge into appealing and easy-to-understand visual forms, and for interactive browsing, drilling, scrolling, and zooming data and patterns to facilitate user exploration. Finally, for visualization of large amount of data, parallel processing and high-performance visualization tools should be investigated to ensure high performance and fast response.
J. Domain-specific data mining:
Data mining by integration of sophisticated scientific and engineering domain knowledge besides general data mining methods and tools for science and engineering, each scientific or engineering discipline has its own data sets and special mining requirements, some could be rather different from the general ones. Therefore, in-depth investigation of each problem domain and development of dedicated analysis tools are essential to the success of data mining in this domain. Here we examine two problem domains: biology and software engineering.
1) Biological data mining
International Journal of Emerging Technology and Advanced Engineering
Website: www.ijetae.com (ISSN 2250-2459,ISO 9001:2008 Certified Journal, Volume 4, Issue 6, June 2014)
537
We believe substantial research is badly needed to produce powerful mining tools in many biological and bioinformatics subfields, including comparative genomics, evolution and phylogeny, biological data cleaning and integration, biological sequence analysis, biological network analysis, biological image analysis, biological literature analysis (e.g., PubMed), and systems biology. From this point view, data mining is still very young with respect to biology and bioinformatics applications. Substantial research should be conducted to cover the vast spectrum of data analysis tasks.2) Data mining for software engineering
Software program executions potentially (e.g., when program execution traces are turned on) generate huge amounts of data. However, such data sets are rather di®erent from the datasets generated from the nature or collected from video cameras since they represent the executions of program logics coded by human programmers. It is important to mine such data to monitor program execution status, improve system performance, isolate software bugs, detect software plagiarism, analyze programming system faults, and recognize system malfunctions.
Data mining for software engineering can be partitioned into static analysis and dynamic/stream analysis, based on whether the system can collect traces beforehand for post-analysis or it must react at real time to handle online data. Different methods have been developed in this domain by integration and extension of the methods developed in machine learning, data mining, pattern recognition, and statistics. For example, statistical analysis such as hypothesis testing) approach [LFY+06] can be performed on program execution traces to isolate the locations of bugs which distinguish program success runs from failing runs. Despite of its limited success, it is still a rich domain for data miners to research and further develop sophisticated, scalable, and real-time data mining methods.
V. CONCLUSION
In this paper, we have examined a few important research challenges and issues in science and engineering data mining. Also examine data mining techniques for Data security and privacy like fraud detection and direct marketing , Social media data analysis and computing , Web-scale data mining and semantic discovery , Large-scale data integration and mining .
REFERENCES
[1] Venkatesh Ganti, Johannes Gehrke, and Raghu Ramakrishnan, "demon: mining and monitoring evolving data" IEEE transactions on knowledge and data engineering, vol. 13, no. 1, january/february 2001
[2] Philip K. Chan, Florida Institute of Technology Wei Fan, Andreas L. Prodromidis, and Salvatore J. Stolfo, Columbia University" Distributed Data Mining in Credit Card Fraud Detection" november/december 1999 1094-7167/99/$10.00 © 1999 IEEE [3] Rachna Somkunwar, "A study on Various Data Mining
Approaches of Association Rules " IJARCSSE Volume 2, Issue 9, September 2012 ISSN: 2277 128X
[4] Hongjun Lu, Member, IEEE Computer Society, Rudy Setiono, and Huan Liu, Member, IEEE, " Effective Data Mining Using Neural Networks" IEEE transactions on knowledge and data engineering, vol. 8, no. 6, december 1996
[5] Daniel A. Keim, " Information Visualization and Visual Data Mining" IEEE transactions on visualization and computer graphics, vol. 7, no. 1, january-march 2002
[6] Mario Cannataro, Antonio Congiusta, Andrea Pugliese, Domenico Talia and Paolo Trunfio, " Distributed Data Mining on Grids: Services, Tools, and Applications" IEEE transactions on systems, man, and cybernetics—part b: cybernetics, vol. 34, no. 6, december 2004
[7] Michael Goebel, Le Gruenwald, "A survey of data mining and knowledge Discovery software tools" SIGKDD Explorations. Copyright 1999 ACM SIGKDD, June 1999. Volume 1, Issue 1 – page 21
[8] S.Hameetha Begum, "Data Mining Tools and Trends – An Overview " International Journal of Emerging Research in Management &Technology ISSN: 2278-9359
[9] Tipawan Silwattananusarn1 and Assoc.Prof. Dr. KulthidaTuamsuk" Data Mining and Its Applications for KnowledgeManagement : A Literature Review from 2007 to2012" International Journal of Data Mining & Knowledge Management Process (IJDKP) Vol.2, No.5, September 2012
BIBLOGRAPHY
Girish Kumar Sorot received his B.Tech. degree in computer science & engineering from Rajasthan Technical University, Kota and currently pursuing M.Tech. degree in computer science & engineering from Rajasthan
Technical University, Kota