Anthropology Theses Department of Anthropology
12-12-2018
The Educational Experience of Virtual Reality: An
Archaeological Case Study of the Maya Site, Vista
Alegre
Jessica M. Moss
Follow this and additional works at:https://scholarworks.gsu.edu/anthro_theses
This Thesis is brought to you for free and open access by the Department of Anthropology at ScholarWorks @ Georgia State University. It has been accepted for inclusion in Anthropology Theses by an authorized administrator of ScholarWorks @ Georgia State University. For more information, please [email protected].
Recommended Citation
Moss, Jessica M., "The Educational Experience of Virtual Reality: An Archaeological Case Study of the Maya Site, Vista Alegre." Thesis, Georgia State University, 2018.
CASE STUDY OF THE MAYA SITE, VISTA ALEGRE
by
JESSICA M. MOSS
Under the Direction of Jeffrey B. Glover, Ph.D.
ABSTRACT
Archaeological visualization has a long history within the discipline, relying on
technological advancements to aid in recording, interpreting, and educating about sites and
projects. Though computer graphics have been used as archaeological visualizations for
decades, hardware advancements have begun to allow for broader consumer use of Virtual and
Augmented Reality platforms in homes, schools, and museums. This thesis explores the
applications of Virtual and Augmented Reality platforms for archaeological visualization,
specifically in the area of public education. To this end, a 3D model and virtual experience of
the Maya site of Vista Alegre in Mexico are created, methodologically explained, and examined
to relate history, theory, and the goals of utilizing this medium within the archaeological
discipline while expanding on the ethical requirements and empirical methods of praxis. In all,
this technology both produces tangible, quantifiable, and accurate data and makes these data
more accessible to the general public.
by
JESSICA M. MOSS
A Thesis Submitted in Partial Fulfillment of the Requirements for the Degree of
Master of Arts
in the College of Arts and Sciences
Georgia State University
Copyright by Jessica Marie Moss
by
JESSICA M. MOSS
Committee Chair: Jeffrey B. Glover
Committee: Kathryn Kozaitis
Dominique Rissolo
Nicola Sharratt
Electronic Version Approved:
Office of Graduate Studies
College of Arts and Sciences
Georgia State University
DEDICATION
I don’t know if I will ever have a speech at the Oscars or a Nobel Prize ceremony, so I
will use this chance to give my thanks to the most important people in my life, for supporting
me, watching out for me, and allowing me to somehow exist comfortably in modern society.
First, my parents: you dealt with me through a lot of madness, and if it were not for the
balancing forces of both of you in my life, I never would have had the patience, support, and
drive to do any of this. Literally. Next, to my fiancé: you keep me grounded, and we make the
perfect team. You are the best other half a girl could wish for, AND you understand my
obsession with animals, especially our kittens. Tyson and Firefly, you have contributed many
hours of purrs and sleep next to me while I work on this thesis. You did this as much as I did.
To Loren Bouchard and H. Jon Benjamin: I know it is silly, but I would have given up
ages ago without the optimism that your creative efforts bring to the world (just ask my fiancé).
And finally, to whomever happens to be reading this, thank you. What is the point of spending
so much time, energy, and stress to write unread words? From experience, I know that the main
audience for this thesis is my committee members and other students. My committee members, I
have already thanked (though no amount will ever be enough), but to any future students, I
dedicate this lastly to you. I am aware that this could feel hollow, since it is most likely we have
never met, but I hope that something in here is helpful to you in your pursuits. Mine the
references, visit the websites, follow the recommended tutorials, but whatever you find, I hope it
is useful. If it weren’t for hundreds of moments of silent support from the other students,
teachers, and staff of the anthropology department, I never would have finished this. For them
and for you, I plan to keep spreading anthropology like Wonder Woman spreads justice, because
ACKNOWLEDGEMENTS
This project would not exist without the help of a great many people. Primarily, my
advisor Jeffrey Glover provided endless support and much-needed direction. I would like to
extend my gratitude for his patience and guidance through this entire process. Through him, I
met the rest of the Proyecto Costa Escondida team and became introduced to the wonders of the
Maya world, two things that I am very thankful for. Dominique Rissolo, another PCE teammate
and member of my committee, also facilitated my introduction to the Maya and many of the
technological methodologies used by the industry. Nicola Sharratt graciously joined my
committee at a late stage to guide the application of my project to the history of visualization and
for an iteration destined for a museum. The final member of my committee, none of which I
could have done without, is Kathryn Kozaitis, who introduced me to the world of praxis. In this,
I found the way to apply my passion for archaeology to my goals of educating the public outside
of academia. I am so grateful for everyone on my committee for devoting the time to guide me
to find the knowledge that I seek to gain the foundation to ethically educate others.
In addition to my committee, I would like to acknowledge that this work is built off of the
countless hours of research from other archaeologists, especially though providing the
background data associated with this project. These other members of the PCE exposed me to
the many niches of archaeology as they apply practically to individual projects, and through
them and their work, I have been able to see the interconnections and wider scope archaeological
research. I am also very grateful for the residents and local stakeholders that allow us to work in
these locations, often on personal land, and entrust us with investigating and handling their
TABLE OF CONTENTS
ACKNOWLEDGEMENTS ... v
LIST OF TABLES ... x
LIST OF FIGURES ... xi
1 INTRODUCTION ... 1
1.1 Project Statement ... 4
1.2 Summary of Thesis ... 5
2 ARCHAEOLOGICAL VISUALIZATION AND VIRTUAL REALITY ... 8
2.1 A Brief History of Archaeological Visualization ... 8
2.2 Interactive and Immersive Visualization - The Next Step... 18
2.3 Case Studies ... 23
2.3.1 Academic Projects ... 25
2.3.2 Laser Scanning, Industry and Nonprofit ... 29
2.3.3 Television and Visualization ... 33
3 ARCHAEOLOGICAL PRAXIS ... 37
3.1 Technology and Change: ... 38
3.2 Praxis and Accessibility ... 42
3.3 Benefits of Immersive and Experiential Learning through Technology ... 44
3.4 Praxis and Display ... 46
4 SITE BACKGROUND: VISTA ALEGRE ... 53
4.1 Research Background ... 55
4.2 Interpreted Site Chronology ... 64
4.2.1 Vista Alegre I (800/700 – 400 BCE) ... 64
4.2.2 Vista Alegre IIa (75 BCE -CE 400/450) ... 65
4.2.3 Vista Alegre IIb (CE 400/450-700) ... 65
4.2.4 Vista Alegre III (CE 750/800-1050/1100) ... 65
4.2.5 Vista Alegre IV (CE 1100-1521) ... 66
4.2.6 The Historic Era (CE 1552- present) ... 67
4.3 Relevant Feature Descriptions ... 67
4.3.1 Structure 1: ... 68
4.3.2 Structure 2 ... 71
4.3.3 Structure 3 ... 71
4.3.4 Structure 4 ... 72
4.3.5 Structure 5 ... 72
4.3.6 Structure 6 ... 73
4.3.7 Structure 8 ... 73
4.3.8 Structure 13 ... 73
4.3.9 Structure 14 ... 74
4.3.11 Structure 16 ... 74
4.3.12 Structure 17 ... 74
4.4 The Extension of Background Research ... 75
5 MODELLING METHODOLOGY AND LIMITATIONS... 76
5.1 Background ... 77
5.2 Methodological Steps ... 81
5.2.1 Step 1: The Background Information ... 83
5.2.2 Step 2: The Map ... 87
5.2.3 Step 3: The Model ... 93
5.2.4 Step 4: The Texture ... 97
5.2.5 Step 5: The Platform and Presentation ... 99
5.3 Visualizing Future Stages of the Model... 102
6 PRAXIS AND THE FUTURE ... 105
6.1 Findings and Effects on Theory ... 105
6.2 Archaeological Praxis and Virtual Worlds ... 108
6.3 Visualizing Praxis with VA/VR ... 111
7 CONCLUSIONS ... 114
7.1 Critiques ... 114
7.2 Plan Going Forward... 115
REFERENCES ... 119
APPENDICES ... 129
Appendix A: Technical Glossary ... 129
LIST OF TABLES
Table 2.1: Harvard Site Typology for Copán reconstruction ... 27
LIST OF FIGURES
Figure 1-1: Palmyra before and after IS ... 3
Figure 1-2: Recreation of Palmyra Temple from #NEWPALMYRA project ... 4
Figure 2-1: Reconstruction of Philae Main Temple, Hypostyle Hall ... 9
Figure 2-2: Artifact detail drawings for chronological assessment ... 10
Figure 2-3: Reconstruction of Assyrian Palace by Layard, c. 1849 ... 12
Figure 2-4: Line-sketch of Existing Hieroglyphic Staircase ... 12
Figure 2-5: Waldeck hieroglyphic documentation (c.1830s) ... 13
Figure 2-6: Maudslay photograph (1891) of El Castillo in Chichen Itza ... 14
Figure 2-7: Visualizations of Rosalila ... 16
Figure 2-8: Evans' reconstruction of Palace of Knossos ... 17
Figure 2-9: Digital reconstruction of the Mortuary Temple of Raneferef, 1988 ... 19
Figure 2-10: Digital model used in viewshed interpretation ... 21
Figure 2-11: Educational VR examples ... 22
Figure 2-12: In-progress reconstruction of Temple 18 at Copán, Honduras ... 24
Figure 2-13: Virtual Tour of Copán in a web-based interface ... 25
Figure 2-14: Sketch-up Models of Template by Type ... 28
Figure 2-15: Morgantina project ... 29
Figure 2-16: 3D model of pyramid at Chichen Itza ... 31
Figure 2-17: Digital 3D Scan of Ordered 16-steps ... 32
Figure 2-18: Digital scans of individual stair front-pieces ... 32
Figure 2-19: Still of excavation unit in 3D created with Photogrammetry ... 33
Figure 2-21: Screenshot from Ancient Invisible City's VR point-cloud render of Hagia Sophia 36
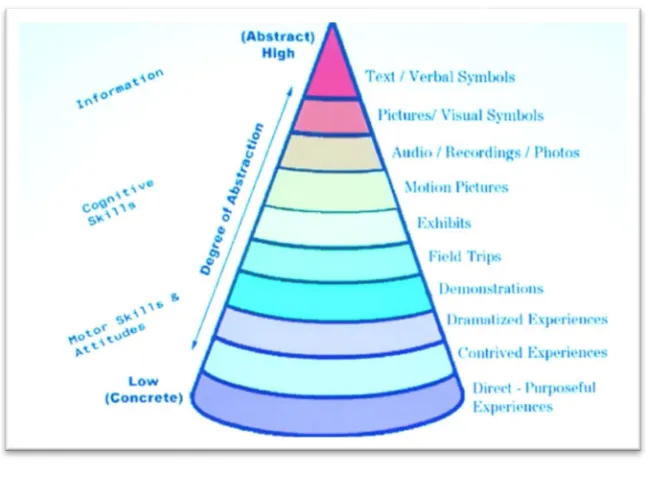
Figure 3-1: Value of Experiential Learning ... 45
Figure 3-2: VR photogrammetric visualization ... 47
Figure 3-3: AR integrated into museum exhibit at Detroit Institute of Art ... 48
Figure 3-4: Map of locations of Vista Alegre ... 49
Figure 4-1: Map of Vista Alegre and surrounding area ... 53
Figure 4-2: Site map of Vista Alegre showing locations of major structures and features. ... 54
Figure 4-3: Excavation units (U) at Vista Alegre, 2008 and 2011 field seasons ... 57
Figure 4-4: Location of Vista Alegre in northern Maya lowlands... 59
Figure 4-5: Map of work at Vista Algre during 2016 season ... 61
Figure 4-6: Elevation and water table data obtained by transect excavation ... 61
Figure 4-7: Illustration of Vista Alegre reconstruction by Mark Garrison ... 63
Figure 4-8: Modern condition of Structure 1, Vista Alegre Main Pyramid ... 68
Figure 4-9: Muyil, Structure 8I-13, Castillo ... 69
Figure 4-10: A palapa in Mexico ... 70
Figure 4-11: Maya serpent head sculptures in two settings ... 70
Figure 5-1: Spatially oriented sitemap in game engine to create virtual reconstruction ... 78
Figure 5-2: 3D modeled site using GIS data for accurate structure location ... 79
Figure 5-3: A 3D Model of Rosalila Intended to be Viewed as a VR Experience ... 85
Figure 5-4: San Bartolo Mural Showing Red, Yellow, White, and Black Color Scheme ... 85
Figure 5-5: Bonampak Room Murals ... 86
Figure 5-6: Landscape Mural from Chichen Itza, Temple of the Warriors ... 86
Figure 5-8: Vista Alegre map, vector to raster ... 90
Figure 5-9: 3D Volumetric rendering of site using ArcScene ... 91
Figure 5-10: Blender screenshot of initial georeferenced elevation model ... 92
Figure 5-11: Blender screenshot of initial volumetric meshes ... 92
Figure 5-12: Structural Reconstruction Workflow in Interdisciplinary Team ... 93
Figure 5-13: Low Resolution Construction ... 94
Figure 5-14: VA/VR model of Structure 1 ... 95
Figure 5-15: Using BlenderGIS for modeling scale ... 96
Figure 5-16: Primary structures on terrain reconstruction in Blender ... 96
Figure 5-17: Vista Alegre textured with True Terrain (top) ... 98
Figure 5-18: VA/VR textured model in Blender Cycles render engine without terrain smoothing ... 99
Figure 5-19: VA/VR close-up of Structure 1 plaster texture in Blender Cycles ... 99
1 INTRODUCTION
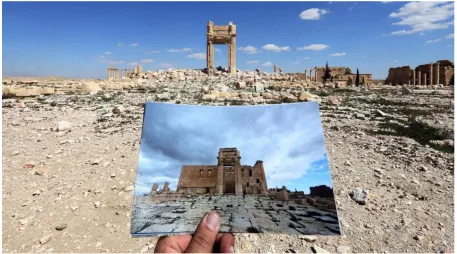
In May 2015, Islamic State (IS) militants seized the UNESCO World Heritage
archaeological site of Palmyra in Syria. The site represented material from a long history of
occupation spanning from the Neolithic in 7500 BCE through Assyrian, Roman, Persian, and
Ottoman rule as a populous trade hub between the Silk Road and the Mediterranean (UNESCO
2018). Owing to this varied and complex political history, Palmyra’s monumental architecture
drew inspiration from a variety of periods, traditions, and institutions providing unique insight
into the effects of social change upon the population and practices of this area over time. It was
also due to this extremely diverse history that Palmyra became targeted by the fundamentalist IS
militants who saw the site and the history that it represents as anathema to their religious beliefs
(Figure 1-1). While propaganda videos featuring the destruction of the temples, larger statues,
and other architectural elements flooded the internet, leaders within the Islamic State aimed to
seize anything that could be sold to fund their cause, extracting countless artifacts to be
leveraged on the black market. Palmyra native Khaled al-Assad had spent his forty-year career
as an archaeologist documenting the history of Palmyra, spending most of his professional life as
the site’s director of antiquities before retiring to care for Palmyra in partnership with UNESCO
(BBC World News). When IS invaded, they captured Assad, torturing him for over a month in
an attempt to extract information about potential valuables within the site. Assad never relented,
protecting what remained of his life’s work until he was publicly executed on the stage of
Palmyra’s ancient amphitheater by his captors (BBC World News).
Willful human destruction of ancient sites has happened through time for a variety of
reasons; in many ways, it is the only way that society can progress forward. Urban development
label and protect the most significant and ancient sites currently remaining. However, natural
disasters, climatological change, or physical degradation from time will eventually damage all
archaeological sites. The ephemeral nature of archaeological material requires constant vigilance
in advancing the tools used for data capture and storage. In the case of sites such as Palmyra, the
destruction of the site occurred publicly, quickly, and the previously collected data becomes all
that remains. By focusing on using visualization tools to capture the built environment of a site,
and using technological platforms developed for media industries, these data are able to provide
a digital representation and record of a site in a way that is not subject to natural degradation. As
the ubiquity of this practice increases, photorealistic models of sites are being incorporated into
archaeological data collection workflows. The goal of this thesis is to explore how these models
are created to maintain historical accuracy and the intersections of using these models for
preservation, interpretation, and education.
The IS occupation of Palmyra lasted until March 2017, and whatever was not looted by
the militants was either destroyed in battle or for religious and political propaganda. The rich
deposits of history woven into the landscape have purposefully been all but erased within two
years of a contentious war. Seeing this impact so directly etched on the archaeological terrain
during the early phases of my graduate school education highlighted the unstable nature of
human history, reflecting in Palmyra the countless number of potential wells of archaeological
knowledge that have been extinguished during the approximately 10,000 years of human
settlement. Art, writing, and oral tradition maintain impressions of the past, and technology
often develops in tandem with the needs of human expression. Photographs, video, digital scans,
of the physical environment, and they are rapidly being incorporated into many archaeologists’
[image:18.612.106.563.126.380.2]tool-boxes for preservation, remote analysis, and educational presentation.
Figure 1-1: Palmyra before and after IS (Photo from Worley 2016)
Though the physical Palmyra is mostly lost, use of these modern technologies has
allowed for the virtual reconstruction of the site to begin, recreating many of the empirical
aspects of experiencing the site as it was before the IS occupation. The #NEWPALMYRA
(http://www.newpalmyra.org/) project runs on crowd-sourced creative commons visual imagery
to digitally recreate many of the important architectural elements that defined Palmyra within the
archaeological record (Figure 1-2). Bridging the realms of software design, activism, and
archaeology, the project’s software and the visual data are open-sourced, democratizing the
access and ability to contribute to the project (#NEWPALMYRA 2018). The community
engagement and international awareness of the socio-political situation of Palmyra weaves
#NEWPALMYRA represent an ideal of praxis-based archaeology through actively directing
social change towards education in the aftermath of devastation. The use of modern digital
technologies can enhance preservation, public education, and archaeological education in a way
that is available to everyone with access to a computer. Through exposing the public to areas,
times, and people outside of their daily reach, we can encourage a more well-informed and
compassionate public. This is the goal that inspired this thesis, and through the work of digital
reconstruction and virtual preservation, I aim to continue expanding the educational benefits of
immersive visual media within an archaeological context` with my work at the Maya site of
[image:19.612.212.401.360.495.2]Vista Alegre.
Figure 1-2: Recreation of Palmyra Temple from #NEWPALMYRA project (Image from #NEWPALMYRA 2018)
1.1 Project Statement
Modern visualization technologies are allowing archaeologists new ways to document,
research, and inform the public. Exploring how digital archaeological site data can be gathered
and utilized to create immersive educational experiences is one of the goals of this thesis through
practical application. The other primary goal is to consider the praxis-based utilization of this
investigating the connections between immersive digital experiences and lasting educational
practices as they apply to the archaeological discipline.
Utilizing the latest interactive visualization technology, this project expands on the ideas
of virtual tourism and digital archaeology to make educational, accurate, and immersive
experiences within Virtual Reality (VR) and, in future iterations of this project, Augmented
Reality (AR) platforms1. Though this thesis will explore the broader theoretical implications of
this technology, the practical aspect of this project will focus on the applications of these
innovations in an archaeological context. At the Maya site of Vista Alegre, and in conjunction
with the Proyecto Costa Escondida (PCE), I first reproduce the current environment within a
virtual framework, one that can be visited online and within a Virtual Reality headset. The next
stage involves creating accurate renderings of what this site would have looked like using current
archaeological data, which supports an approximation of the site’s appearance during the
Terminal Classic / Postclassic periods (A.D. 850 – 1100/1200). The final product of this project,
a fully immersive view of Vista Alegre in VR, will be referred to as VA/VR.
1.2 Summary of Thesis
This thesis takes a dual approach to understanding the topic of reconstruction techniques
and digital applications of these for didactic use by scholars and the public, the layout of the
paper reflects this division. Chapters 2 examines the history, introduction, and current usage of
reconstructive and immersive visualization in archaeology, particularly how it relates to the field
of Maya archaeology. The second portion of Chapter 2 is devoted to analyzing several case
1 VR is a totally immersive experience where a headset is worn that blocks off hearing and
studies with similar goals to that of the digitalization of Vista Alegre, including an academic
project geographically nearby, a team working to digitally preserve cultural heritage with
UNESCO, and an archaeologist working with PBS to educate the public using point-cloud
visualization and VR. Though these case studies share many educational goals, the methods
utilized in this project are different owing to the nature of the site. The case studies provide a
nuanced understanding of the variety of solutions available for site digitalization based on the
needs, goals, and nature of the site.
Chapter 3 turns more directly to theory, analyzing archaeological praxis and associated
archaeological and anthropological theoretical frameworks. The main themes discussed are
technology, accessibility, immersive and experiential learning, museum and other forms of
display, and the application of praxis within the PCE. Following the theoretical foundation of the
project, Chapters 4 examines the history of Vista Alegre, including the research undertaken at the
site to date and the goals and methods of each PCE expedition. Chapter 4 also examines the
current interpreted site chronology for Vista Alegre, with special attention to what will be
represented in the 3D visualization for this project. The last portion of Chapter 4 is spent
examining the particulars of the individual structures to be modeled at Vista Alegre, providing
much of the background information for the stylistic details used in modeling.
Chapter 5 turns to the methodological steps utilized to create the model of Vista Alegre
used for this project, beginning with the site background and description of the primary
structures and features. There are many methods available to create similar visualizations, just as
there are many different methods for data collection, and these are also discussed within the
chapter(s), as well as my reasoning for selecting the methods and platforms used. Additionally,
time of this writing that were not available at the start of this endeavor. Footnotes have been
added where appropriate to both describe elements of the technology as well as provide insight
into the developments in both hardware and software. As this section delves into technology that
may be outside of the knowledge-base of those less familiar with computing applications, a
glossary is provided in Appendix A. Appendix B also lists the external learning resources and
material sources that I used for this project, including the tutorials that I accessed for modeling in
Blender. One of the greatest challenges of crafting this thesis has been embracing the
ephemerality of technical knowledge; it often seems as though once a technique is mastered, it is
rendered obsolete. Throughout this project, and described in detail in these subsections, I have
endeavored to highlight the most sustainable forms of this burgeoning technology when possible.
With the methodology for the model explained, Chapter 6 places the construction of this
model within the discussed theoretical framework, looking towards the future potential of
synthetic reality use within the discipline. Chapter 7 reviews the relationship of this particular
project with the theories and enactment of praxis discussed in Chapters 2 and 3 and explores
necessary elements of praxis in its future application. As the scope of future integration of this
technology is unknown, there is much speculation and development opportunity to set precedent
of educational practice that center around praxis. As the first section of this introduction shows,
community action and directed change can be achieved through education, democratization of
data, and empathy, even following the most atrocious human actions. This thesis’ conclusion
summarizes this approach alongside the findings of this project and future plans of its
2 ARCHAEOLOGICAL VISUALIZATION AND VIRTUAL REALITY
Visualization is a powerful tool in both the interpretation and presentation of
archaeological data, and forms of visualizing archaeological material have been fundamental to
the data collection, analysis, and presentation techniques from the beginning of the discipline.
The unique attributes and spatial relationships of archaeological materials are exceedingly
important to the science of archaeology, as these relationships provide the context for
archaeological interpretation. In most situations, recording this information is much easier, more
reliable, and accurate through combining quantitative and qualitative description with imagery.
Reconstructions of site layouts and monumental architecture offer insights into questions of
spatial usage, sight-lines, and ideological embodiment. Reconstructions also allow for the public
to personally visualize sites in a relatable way. Museum exhibits use dioramas, maps, or
reconstructive illustrations to provide experiential context to archaeological collections.
Extending the idea of archaeological reconstructions into the realm of new visualization
technologies, particularly VR and AR, provides a new way to interface with archaeological
materials, leading to new interpretive and presentational possibilities. This chapter first focuses
on the history and necessity of archaeological visualization, culminating in the theories and
methods utilized in specific case studies relevant to the goals of this project.
2.1 A Brief History of Archaeological Visualization
In the eighteenth and nineteenth century, when archaeology was the pursuit of wealthy
gentlemen scholars who also sought the thrills and colonial-era accolades of exploring exotic
locales and collecting rare artifacts, sketches were commonly collected of the monumental
architecture, statues, and writings of these rediscovered worlds. Mostly, these early drawings
practitioners like Thomas Jefferson also began to use sketches to record their excavation
methodology. In the 1770s, Jefferson sketched the cross-section of a mound in what is believed
to be the first formal, systematic excavation in the United States (Trigger 2006:117). Napoleon
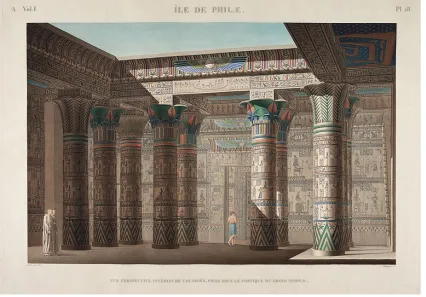
Bonaparte, during his attempted conquest of Egypt during the final years of the eighteenth
century, brought a large company of French scholars along to document and study the ancient
[image:24.612.101.527.376.673.2]monuments; some of their work included speculative recreations of the sites during their use
(Figure 2-1). These scholars formed an academy of researchers that worked alongside native
inhabitants of Egypt, and this tenuous collaboration resulted in several volumes for the
consumption by European elites of the highly illustrated Description de l’Egypte between the
years 1808 and 1828, fueling the European trend of exoticizing Orientalism (Al-Jabarti
2004[1798]:171-178).
The classification of artifacts became the common dating mechanism for archaeological
sites during the Culture-History phase of the nineteenth and early twentieth centuries. The idea
that similar styles came into and out of fashion in specific areas at specific times allowed for
details of pottery, iconography, and tools to be classified and ordered (Trigger 2006:224-230).
[image:25.612.158.458.318.521.2]This created a need for details to be recorded visually to create these classification systems
(Figure 2-2). As these details became the scientific basis for typological classification, these
drawings had to be as accurate and representative as possible, creating a shift away from the
fallacies seen in earlier interpretive work and placing more importance on meticulous
reproduction.
Figure 2-2: Artifact detail drawings for chronological assessment (Image from Oxford Handbooks Online 2018)
As the values and practices of modern archaeology solidified within the university system
during the early to middle decades of the twentieth century, systematic site mapping and
sketching the excavation process in addition to the iconography became a common practice,
especially as technological developments in mapping and chronology techniques continued to
documentation to attempt to provide a recreation of what the sites may have looked like during
their use. An early example, Austen Layard, who worked at the Mesopotamian sites of Nimrud
and Kuyunjik in modern Iraq, created architectural reconstructions of palace interiors (Figure
2-3) from the vast quantity of Neo-Assyrian sculptures and texts excavated during the mid-1800s
(Trigger 2006:70-71).
One of the most renowned early reconstructive artists in the New World, Tatiana
Proskouriakoff, entered the field of archaeology from an architectural background, lending a new
understanding to the engineering techniques used by the Maya (Solomon 2002:36). After
working in Piedras Negras, Copán, and Chichen Itza, Proskouriakoff published a book of artistic
reconstructions, An Album of Maya Architecture (1970[1946]). This remarkable book features
twenty-nine monuments and cityscapes that were reconstructed based on Proskouriakoff’s
knowledge of both the Maya and construction techniques, in addition to showing the
reconstruction next to a drawing of the current state of the monument or building (Figure 2-4).
Using solid lines to depict elements in-situ and dotted lines showing potentially associated
material found in relation to the monuments, Proskouriakoff not only provides an image of the
reconstructed world but also shows the reader what assumptions may have been taken in her
analysis. To give further context, she includes a few paragraphs for each drawing, thoughtfully
Figure 2-3: Reconstruction of Assyrian Palace by Layard, c. 1849 (Image from Royal Collection Trust 2018)
Figure 2-4: Line-sketch of Existing Hieroglyphic Staircase
Figure 2-5: Waldeck hieroglyphic documentation (c.1830s)
compared to Schele's (c.1970s) more accurate documentation. Note Waldeck’s elephants compared to Schele’s work. (Image from Cauty 2011)
Though it does have its strengths over worded description, visualization is still mediated.
Sketches, especially those depicting iconography, have often been recorded with unconscious
bias towards imposing familiar symbols into foreign design. The contextualization offered by
Proskouriakoff in her reconstruction is one way to mitigate against issues of misinterpretation
and inaccuracy, but unconscious association is still a potential problem in interpretation. One
classic example of this comes from the fieldwork of Jean Frederic Waldeck, who recorded the
Mayan hieroglyphs of Palenque during the 1830s. Waldeck, biased by personal beliefs of a
connection between the Phoenicians and the Maya, included drawings of non-native elephants
into his documentation (Figure 2-5) (Coe 2012:1442-1452). Photography obviously added more
uniformity to archaeological documentation, but even as cameras became more ubiquitous
during the early twentieth century, they were still too difficult to maneuver in remote locations or
general expense of the early cameras needed to catch the requisite details could not make up for
the benefits of film, such as its relative storage longevity once processed. Despite the early
difficulties of film camera use in the field, some archaeologists managed to capture some
remarkable images of remote Maya sites, such as the work of Alfred Maudslay and his wife
Anne during the late 1800s and early 1900s (Figure 2-6) (Sharer 1983).
Figure 2-6: Maudslay photograph (1891) of El Castillo in Chichen Itza above modern reconstructed state of the site (Image from Flickr 2016)
Camera technology continued to improve during the twentieth century, each decade
bringing smaller, more portable cameras and better solutions to keeping unprocessed film from
light. With the 21st century came the digital camera, eliminating the necessity of film, with
photography has solved many of the issues inherent with the earlier limitations of film, such as
its expense, finite image capacity, and transport issues owing to its requirement of staying cool
and dark. Further advancements in digital photography have created the many opportunities,
such as the capacity to capture more detail than then human eye can see, waterproof camera
housing for underwater photography, almost unlimited storage, video recording options within
the same camera body, and the ability to create 3D images through photogrammetry software.
Owing to the longevity, superior resolution, and tangibility of film, it is still the preference of
some artists and researchers, though usually in combination with digital photographic data.
Even with modern photographic and mapping technology, there is the often-unconscious
decisions of framing the image that can create assumptions of what is included, excluded, or
related when interpreting the site. This can be especially problematic when attempting to present
archaeological information to the public, as the public often lacks the expertise to interpret raw
data. Museums, a primary public educator on archaeological material, often strive to use
visualizations that are informative, unambiguous, and engaging, but this becomes difficult to do
authentically when the data is inherently incomplete (Stone 1997). Larger-scale representations,
such as models and dioramas, can help mitigate this interpretive gap, though they too have issues
Figure 2-7: Visualizations of Rosalila
(Left) Full-size and full-color Rosalila reconstruction model at Copán Sculpture Museum. Image from http://static.panoramio.com/photos/large/305469.jpg. (Right) Structure 16 of Copán Acropolis, reconstructive drawing showing
preservation of earlier phases of construction including Rosalila in red. Image from Flickr 2018)
Models and dioramas make it easy for people to imagine that they are within a space, as
these offer a more sensory experience than two-dimensional reconstructions. One beautiful
example is found in the center of the Copán Sculpture Museum, located near the archaeological
site of Copán in Honduras: a full-scale replica of the Rosalila structure (Figure 2-7). Oddly for
the Maya, this early building phase, dating to the late sixth century AD, was preserved carefully
before it was covered by subsequent construction, leading to Rosalila’s excellent state of
preservation when uncovered under the current pyramid in 1989 (Asociacion Copán 2017).
Archaeologist Barbara Fash worked with local masons and artists to recreate an exact replica of
what the archaeological teams found when they peeled back the layers of plaster and paint
protecting the buried building (Fash and Fash 1996). Fash noted the multiple paint layers that
were used during Rosalila’s period of use, and the team chose to represent the color scheme that
adorned the building directly prior to its ceremonial burial to use on the replica (Fash and Fash
1996). This same polychrome scheme is used most often in reconstructions of Maya buildings,
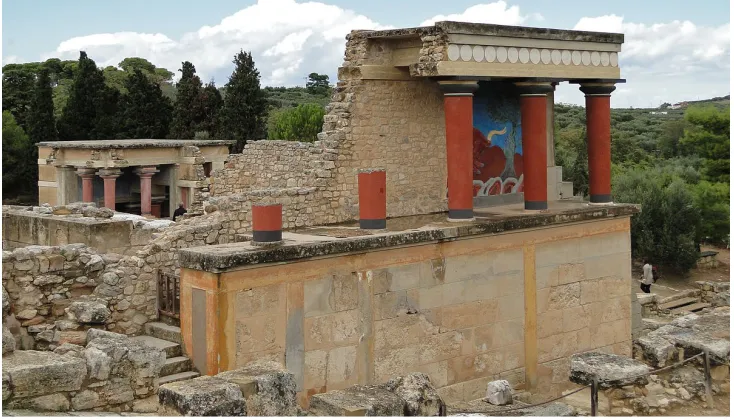
Figure 2-8: Evans' reconstruction of Palace of Knossos (Image from Gagnon 2012)
However, not all reconstructions are as effective as Rosalila. One of the strengths of
Rosalila’s reconstruction was that it was also an act of preservation; the original Rosalila was
reburied and a full-sized replica was created, also acting as a form of experimental archaeology.
The same cannot be said about the reconstruction efforts of Sir Arthur Evans working with the
remains of the Minoan civilization in Knossos, originally dating to c.1600-1300 BCE. Coming
from a very different ethical background than modern archaeologists, Evans excavated and
‘reconstructed’ many of the buildings around what he determined to be a palace during the early
years of the twentieth century (Figure 2-8). Allan Klynne (1998) points to noted similarities
between the reconstructions of Evans’ palaces with the Art Deco style of architecture that was
popular at the time, though he also points to the argument that the Art Deco style was itself
inspired by other archaeological finds around Knossos, thus creating a feedback loop making
accuracy nearly impossible to assess (Klynne 1998:208). There is much that is difficult to verify
in Evans’ reconstruction, as he greatly altered the archaeological evidence in his recreation of the
Palace of Knossos itself have been questioned by current site researchers for their legitimacy
during more modern archaeological investigations (Klynne 1998:215-220). Additionally, the
fame of the site and its visual reproduction on posters, postcards, and other tourism outlets has
reified many of the inaccuracies and potential fallacies of Evans’ work within the public’s mind
(Klynne 1998:207-213).
Modern ethical responsibilities recognize archaeology as a destructive science, and one
that needs to mitigate this destruction through preservation and contextualization which is aided
by technological developments. Klynne (1998:222-225) suggests that to make reconstructions
viable sources of public education and interpretive data, they need to be part of the scientific
dialogue, able to change and evolve visually through collaborative conversation and continued
research. Critics were quick to point out that, while specifying some primary theoretical issues
underpinning all of archaeological interpretation, the methodology for a self-reflexive
reconstruction was vaguely developed within Klynne’s article (Hitchcock 1999; Molyneaux
1999). Technology had not yet caught up to the idea for a version controlled, collaborative
reconstruction at the time of Klynne’s article in 1998, but now with the power of VR, AR, and
open-source version control platforms such as GitHub, we may be on a path to crafting Klynne’s
ideal reconstruction.
2.2 Interactive and Immersive Visualization - The Next Step
Constructing accurate digital models of archaeological sites using computer graphics has
been a goal of many archaeologists since the genesis of computing. One early example in 1984
focused on creating an educational game called Mound Dig aimed at 11 to 14-year-olds to
educate them about Viking history and archaeological methodology (Dean and Nichol 1984).
interactive turn-base system, similar to the classic Oregon Trail. Computer graphics swiftly
improved through the 1980s, propelled by the early video game systems, such as Atari, and
increased demand for CAD (computer aided drafting) software for the architecture and design
industries. Though the creation of digital terrain modeling has its roots in the late 1970s, it was
not until the mid-1980s that the computing technology allowed for more detailed 3D
reconstructions of sites based on these data (Eisler et al. 1988:109-111; Reilly 1991). Early
creation and use of these models required a great deal of specialized knowledge in low-level
computer programming and database management, though Eisler et al. (1988) point to the
benefits of this emerging form of visualization through their work in Egypt, in part to create a
series of reconstructions showing the Mortuary Temple of Raneferef through various stages of
construction (Figure 2-9). The list of benefits for this form of visualization includes “the
flexibility and modifiability of the model and its individual parts”, “the capability of constructing
very extensive models at a considerable degree of detail”, “the capability of making use of
different graphic outputs based on a single set of data and a single model”, and “the suitability of
the model as a base of a topological component of a database of archaeological excavation
information”, among others (Eisler et al. 1988:121).
Paul Reilly refers to these digital model reconstructions as ‘solid modelling’ and points to
their use in animated tours and museum exhibits as early as 1985 “enable[ing] people to fully
appreciate the scale and relationship of elements within a limited number of archaeological
remains” (Reilly 1991:2). “Impressive though such enormous projects are,” Reilly (1991:2)
cautions, “a gap still remains between the interpretation and the original data. It is not readily
apparent how one gets from the dig to the interpretation”. As with the work of Proskouriakoff,
Reilly emphasizes the importance of in-situ and interpretive demarcation.
Third party game engines like Unity or Unreal have been used in forms of archaeological
display since they became commercially available in the 1990s; prior to this, most high-quality
computer graphics rendering was either proprietary to a game console or prohibitively expensive
(Kantner 2000). As the medium began to require less specialized knowledge and expense,
digital modeling and visualization became more accessible to archaeologists as tools for both
presentation and enhanced inquiry. Through the intersections of GIS, advanced computer
processing and graphics, questions began to be asked regarding space that were previously
unable to be addressed quantifiably, such as those examined in Michael Anderson’s (2004) work
using digital model-based visibility analysis (along with the Unreal game engine) to understand
use and privacy within a Pompeii residence (Figure 2-10). Though the use of the media became
more common, the issues of accuracy and interpretation remained at the forefront of academic
discussions regarding digital visualization. In John Kantner’s work of reconstructing the kivas of
Chaco Canyon, he and his team of advanced students focused intently on the compromises and
inferences made by the modeler, as much of the relevant data is always lacking to produce
Figure 2-10: Digital model used in viewshed interpretation
Casa di Trebius Valens in Pompeii. (Left) residence floorplan, (Right) viewshed analysis (Image from Anderson 2004:185-186)
During the last decade, advancements in laser scanning, both airborne and terrestrial,
have allowed for the digital reconstruction of highly accurate models of features, artifacts, and
landscapes through point-cloud generation. Many modern techniques for digital modeling of
archaeological sites rely on generating point-clouds through laser scanning or photogrammetric
software, though the earlier methods of building digital models on geographical information
systems (GIS) data still remains a common practice (as seen in this very project). Point-clouds
are collections of individual points within three-dimensional space that record visual and
locational data. Dense point-clouds can be indistinguishable from photos until manipulated in
3D space. Point-clouds, along with advancements in computer imaging software, game design,
presentation in the form of accurate immersive environments with details recorded earnestly and
accurately at the time of the data collection.
Constructing and navigating space is an experiential process, most accurately represented
through full sensory immersion. Though technology has not yet brought us a form of full
sensory immersion, it allows VR and AR users to engage more organically with the items and
places. However, this technology is often used as an entertaining experience for the public, and
is created in consultation with historians and archaeologists, though not under their direct
control. Museums have contracted with technological visualization studios to create many
experiences that seem more akin to amusement park rides than the VR and AR systems that are
available on the commercial market (Figure 2-11). However, we are experiencing a rise in the
commercial availability of VR and AR platforms, broadening opportunities for both use and
program development by making it easier to access and learn these technologies. Some
archeologists have extended their research into virtual reconstructions, both for public education
and as interpretive frameworks, as will be explored further in the following case studies.
Figure 2-11: Educational VR examples
(Left) StonehengeVR by Voyager VR, currently featured at the Pacific Coast Science Center in Seattle, WA. From https://i.ytimg.com/vi/M1er49GWjA8/maxresdefault.jpg. (Right) Pulseworks VR Transporter at the Georgia Aquarium. (Image
2.3 Case Studies
During the course of this study, the usage of VR and AR has continued to expand in both
the academic and commercial markets. When I first approach this project in early 2016, Oculus
Rift had just started shipping a consumer model and only a few dozen experiences were
available. Pokemon Go had just introduced the smartphone-wielding public to the power of AR
visualization by turning major cities into a global scavenger hunt for adorable animal sightings.
The rapid adoption of these visualizations over the past two years speaks to their accessibility,
and though this increase of usage for the mass market has only recently begun, the technology
behind capturing and rendering 3D visualizations has been used in the industrial and academic
settings for two decades, as discussed in Section 2.2. For this project, many examples paved the
way for the techniques and methods used in data capture, interpretation, and presentation and are
mentioned where applicable throughout this thesis.
The following three areas are featured below representing aspects of VR and
archaeological integrations, and the specific case studies singled out from this larger body of
work for particular study are owing to some key similarities to VA/VR. MayaArch3D, though
not initially developed as a VR platform, weaves together photosphere tours, 3D renderings of
the major site features, and acts as a detailed database for the project’s interpretive branch.
Developed by archaeologists and art historians, MayaArch3D provides a great example of a
digital visualization focused on an important Maya center.
While many institutions and industries use laser scanning, the work of nonprofit CyArk
for UNESCO world heritage is inspiring and well-presented in a public interface. CyArk’s
projects span the globe, and their primary focus is on accurate digital documentation of existing
versions of our international cultural heritage and can be analyzed to reveal changes in these
structures, from ecological or tourist factors, to aid in the mitigation of any preventable
degradation. Their efficient methods and accurate results placed this UNESCO-partnered project
within the case studies for VA/VR, though their methodology is very different than the methods
selected for this project.
Though there are many examples of digital models and advanced 3D visualization used
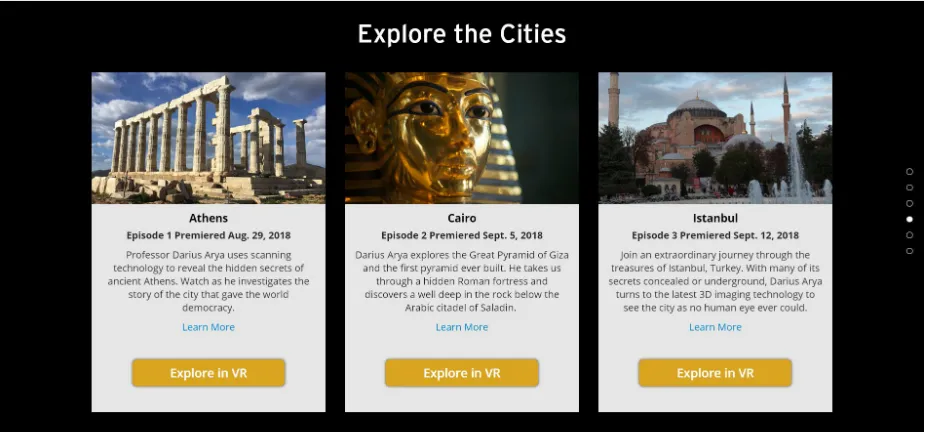
for public education in documentary television, PBS’ Ancient Invisible Cities not only uses the
medium extremely well, but it is also hosted by an archaeologist. Ancient Invisible Cities is a
short documentary series containing three episodes featuring 3D scanning visualization as a
primary narrative technique to interpret and show the historical events of three cities, Athens,
Cairo, and Istanbul. A companion website provides the scans highlighted in the series as VR
environments that the public can explore. This admirable piece of public archaeology, hosted by
archaeologist Darius Arya, provides a compelling example of deploying these visualizations in a
multiplicity of media. As television is more accessible than VR hardware, this series emphasizes
the value of public education and accessibility within this project.
though the object is still removed from context in web-based 3D viewer (Image from MayaArch 3D 2018)
Figure 2-13: Virtual Tour of Copán in a web-based interface
provides limited interactivity and immersion, but it still represents a powerful democratizing tool (Image from MayaArch3D 2018)
2.3.1 Academic Projects
There are some examples of current projects using digital modeling for both interpretive
and educational purposes, and many of these are for projects in the Maya area. For example,
Heather Richards-Rissetto and the work of the MayaArch3D team in Copán, Honduras, have
used a combination of 3D modeling of buildings and features (Figure 2-12) and virtual tourism
(Figure 2-13), which functions a lot like Google Street View (von Schwerin et al. 2013). Though
not fully immersive, this form of visualization allows for visitors to the project website to
explore the site by moving between photospheres creating an active engagement with the site.
Photospheres recreate the 360º field of view and are placed at various points, usually several
meters from each other to provide a remote guided tourist experience through the main avenues
of the site. Unlike videos or photographs, individuals can spend time exploring details within
In addition to the photosphere-based visualization of the existent site, MayaArch3D’s
project website also hosts a visual database of 3D models of important structures and sculptural
elements. This approach combining the individual models with the modern condition of the site
provides a foundation for the VA/VR project. Utilizing this website and visual database format
adds accessible related information to the fully immersive virtual environment. In the case of
MayaArch3D, the project began with individual structure modeling and web interface, planning
to later expand to a fully immersive VR platform utilizing this data (von Schwerin et al. 2013).
Owing to this, the structure and methodology utilized to reach their goals provides a uniquely
applicable roadmap for the future development of VA/VR.
The MayaArch3D project also extends to ideas not yet encountered by VA/VR, but may
be of particular use as the project expands. Owing to the size of the site, the MayaArch3D team
constructed a way to use the size, height, and other quantifiable data for programmatic
construction based off statistically created building typology (Table 2.1) and trigonometry to
reconstruct the average size, height, and structural style (Table 2.2) from the archaeological
footprint and construction material (Richards-Rissetto 2013). Once the typology has been
determined, design templates based on well-researched reconstructions of the smaller site
buildings can be placed within the model (Figure 2-14). In many ways, this is a more systematic
and statistically meaningful answer to the 3D Atlanta issue of ‘dummy buildings’ (see below) as
these are more than placeholders, and my goal is to use this form of typological modeling to fill
in lesser known areas of Vista Alegre, where appropriate.
Though not directly applicable in Vista Alegre owing to its compactness, programmatic
model generation can also speed up the reconstruction of dense urban centers, where most of the
site coverage (Richards-Risseto 2015). The smaller buildings in Vista Alegre contain little
remaining archaeological data and were most likely constructed from perishable material, such
as the ‘Ancillary’ type and the Type 1 and 2 in Figure 2-14. It is also interesting to note the
MayaArch3D team copes with issues of interpretation. Though these methods are very different
than those applicable to Vista Alegre, this example demonstrates how to use this form of
typology and associated visualization within 3D modeling.
Table 2.1: Harvard Site Typology for Copán reconstruction
(from Richards-Rissetto 2013:520) Site
Type No. of Mounds Mound Height (max) Construction Materials
1 3-5 0.25-1.25m Small/medium-sized earth fill; undressed
stones
2 6-8 2.5m-3m Mostly undressed stones
3 6-8 4.75m Mostly undressed stones
4 Multiple
Plazas 10m Large rough and dressed stones; often have vault stones
Table 2.2: Variables affecting structure heights
used with Harvard site typology for Copán Reconstruction (from Richards-Rissetto 2013:520). Site Type Platform Height (m) Wall Height (m) Roof Pitch Wall Thickness
1 0.20 2.0 45° N/A*
2 0.54 2.0 45° N/A*
3 0.97 2.0 45° N/A*
4 1.15 2.5 60° 1.0
Figure 2-14: Sketch-up Models of Template by Type (Image from Richards-Rissetto 2013:521)
To examine a project that is currently based in VR, Jeffrey Vadala (2009) examines the
Maya site of T’isil in Quintana Roo, Mexico through modeling it in GIS and the Unreal game
engine to use for spatial analysis. Moving around Vadala’s T’isil operates like navigating
through a video game as the user can see the view-sheds and spatial separations created by the
building and plaza placement (Vadala 2009). The methods used by Vadala to create a
reconstruction based on survey data is very similar to those used within this project.
At his field-site in Sicily, Jeff Emanuel (2017) uses handheld AR tracking to show
reconstructions of the Roman site of Morgantina (Figure 2-15). This type of visualization
expands on the relationship between objects and space, situating them specifically where they
would be in the modern place, thus making the experience both more immersive and tangible
while at the physical site. However, when these types of experiences are made available through
phone apps, Google plugins, or on websites, this approach to virtual tourism democratizes the
to the site, adding additional benefits to supplementing on-site programs with remote
accessibility.
Obviously, these case studies have the most relevance to creating a VR reconstruction of
Vista Alegre, especially with regards to structuring the project for future use and technological
development. As these represent goals that I aspire to with a future version of Vista Alegre, they
provide an excellent roadmap for the current VA/VR project.
Figure 2-15: Morgantina project
showing hand-held tablet-based AR reconstruction of site (Image from Emanuel 2017)
2.3.2 Laser Scanning, Industry and Nonprofit
According to the mission statement presented on their website, “CyArk is a nonprofit
organization founded in 2003 to digitally record, archive and share the world's most significant
cultural heritage and ensure that these places continue to inspire wonder and curiosity for
decades to come” (CyArk 2018). Non-profit digital preservation companies, such as CyArk
photorealistic, volumetric point-clouds that can be explored for quantitative and qualitative data,
in addition to creating manipulatable 3D objects for viewing (CyArk 2018). Laser scanning can
also provide some interpretive functions as well. For example, the restoration of the Maya
Hieroglyphic Stairway in Copán required the rearrangement of the hieroglyphic segments of the
staircase that had fallen away (Figure 2-17). As the staircase told a narrative, it was important
that the blocks be placed in their original order, but many of these blocks were quite fragile, and
relocating them by hand multiple times would be time-consuming and potentially destructive to
the archaeological record. Harvard’s Peabody Museum sent a team to scan the hieroglyphic
blocks individually so that they could be digitally reconstructed (Figure 2-18), allowing for a
more systematic and efficient reconstruction of the staircase (Tokovinine 2013).
Currently, laser scanners are very expensive, and they require specialized knowledge to
use them. An alternative method of collecting data to create 3D point-clouds comes from
advancements in digital photography and photogrammetric algorithms. Using a fixed-lens
camera and taking a series of photographs with around 80% overlap can now create
photorealistic 3D images (Figure 2-19). with excellent detail of features, excavation process,
artifacts, whole sites, or landscapes (Prins et at. 2014). Both forms of 3D point-cloud generation
require software, heavy computing power, and time, but as the technology improves, it is also
becoming more common in the consumer market. During the last decade, 3D visualizations have
entered the immersive virtual world of VR and AR frameworks with increasing frequency and
accessibility, as seen by these case studies. The use of LiDAR is expanding into the heavily
funded field of self-driving cars, so future units will be smaller and more cost efficient as the
hardware manufactures rush to meet the demand of car-based systems (Cameron 2017.)
when expanding the project in the future. Though the site’s current state is unsuitable for
detailed laser scanning or photogrammetry for modeling purposes owing to the overgrown state
of the site, elements of these technologies are useful for artifacts or smaller feature visualization
within the larger project moving forward. For example, displaying these photorealistic
visualizations as discrete web-based elements (e.g., Figures 2-16 through 2-19), specific
educational material can be connected to these objects. Though not fully immersive, 3D
navigation of the objects facilitates curiosity and exploration, creating enjoyable web-based
educational experiences. CyArk excels at this format specifically for individual structures within
UNESCO heritage sites, creating a visual database that can be contextualized through maps,
associated structures, and research material. Combining this with photogrammetric
visualizations of the excavation process (review Figure 2-19) would provide a further contextual
element revealing some of the common methodology of archaeological practice to a web-based
audience.
Figure 2-17: Digital 3D Scan of Ordered 16-steps
of Hieroglyphic Stairway in Copán by Peabody Museum for digital reassembly (Image from Tokovinine 2013:7)
Figure 2-18: Digital scans of individual stair front-pieces
[image:47.612.78.534.377.603.2]Figure 2-19: Still of excavation unit in 3D created with Photogrammetry (Image from Glover and Rissolo 2015)
2.3.3 Television and Visualization
Encountering high quality 3D computer graphics on television is commonplace.
Cartoons and documentaries alike make use of computer graphics, no longer with the laughable
effect of graphics in many late 1990s television series (see episodes of Xena: Warrior Princess
for many delightful examples). The History Channel, for example, employs 3D graphics at a
mind-boggling pace; often using multiple split-second realistic animations within a swelling,
sensational montage (cue Ancient Aliens). Educational documentaries on television have been
used to differing effect, and they often oversimplify and sensationalize topics to garner viewer
interest (again, cue Ancient Aliens). This powerful medium that exposes many to their basic
overly influenced by the demands of advertising. The majority of any work, when looked at
from a day-to-day perspective, is tedious and makes for terrible television, and archaeology is no
exception. When compiled with the abstract nature of archaeological data, garnering true public
interest in the process and real work of archaeology through the television audience is difficult.
The inclusion of 3D models allows for a direct visual connection through interactive digital
manipulation, granting a deeper connection between subject and audience (Reilly 1990).
Despite the many uses directed specifically at entertainment, several educational outlets
on both cable and public television have used 3D graphics and immersive supplementary
material supplied on websites to more instructionally successful ends. In one especially
impressive example mentioned above, archaeologist and digital visualizer Darius Arya partnered
with PBS to bring a three-part documentary series to the public that utilizes photorealistic
point-cloud visualization to educate the public. Owing to the direction the show takes of allowing the
archaeologist to act as narrator and expert, the perspective of the show reflects the theory and
methodology used by archaeologists to interpret the built environment. As theoretical
approaches shape the type of questions asked (Huggett 1995), the utilization of an archaeological
perspective guiding the explanations, visualizations, and narrative of the program allow it to be a
more direct conduit between the academic expert and the viewing audience.
Ancient Invisible Cities also utilizes a website to provide supplemental data and
visualizations, including versions of the VR tours featured in the show (Figure 2-20) utilizing
dense point-cloud visualizations (Figure 2-21). These work in a 2D video player straight from
the web browser, but they are also viewable in higher end VR headsets when recognized from
interaction, creates greater contextualization with the environment through spatial recognition
and awareness.
As VR technology is not nearly as accessible as television and the internet, using
examples like Ancient Invisible Cities helps explore productive ways to share elements of VR
data with larger audiences and engage a wider population. Though lacking in some of the
immersive benefits of VR technology, it is possible to use the same methods, collection
[image:50.612.75.539.265.481.2]practices, and data to create visualizations for multiple platforms.
3 ARCHAEOLOGICAL PRAXIS
Randall H. McGuire (2008:51) explains praxis as the process of acquiring knowledge of
the world, critiquing the world based on that knowledge, and then taking informed action.
Understanding that knowledge is always informed and interpreted through a social and political
lens is essential and creates the need for theoretically informed self-awareness in research.
Archaeological praxis is founded on a strong ideal of community engagement to aid in a more
accurate and holistic interpretation and presentation of the past, and this requires both education
and active engagement in cooperation with the affected stakeholders to challenge system issues
and create beneficial and sustainable change (Mullings 2007). This is especially poignant
regarding issues of race and class, examinations of structural violence and marginalized
communities, and how these processes have shaped current lifeways, ideologies, and
assumptions (Mullings 2007).
Cultural heritage can play an active role in how an individual self-identifies and in
creating a shared sense of identity for a group. Studying archaeology and cultural heritage is
also important because learning from the past helps us improve our future (Little 2002:4).
Exposure to the lessons of the past also leads to the development of critical and analytical skills,
especially in the early stages of education, as students can explore how events of the past have
shaped the present (Little 2002:6-7). Archaeology is uniquely suited to dispel many nationalistic
and racist agendas through a recounting of evidence and truth within the past, and it also has the
power to remove the political veils of historical rewriting by the prevailing power structures over
time (McGuire 2008). There is also a beauty to exposing everyone to the experience of being in
remote locations of the world, of seeing the Pyramids of Giza and the Great Sphinx, of visiting
world, especially in the K-12 years, reveals life beyond an individual’s enculturated worldview.
Objects of massive scale, such as the Pyramids of Giza, are difficult to convey in 2D formats.
Bringing this view through VR to the classroom, especially in marginalized communities where
technology and opportunities may be limited within our educational structure, opens up the
world at an age where wonder and excitement can especially shape goals and ambition. It is this
type of democratization of knowledge and community engagement that I argue for at the end of
this paper, though it needs to be approached through a strong understanding of theory to avoid
misrepresenting the past and to mitigate any potential adverse consequences. In short, it needs to
be approached with praxis.
3.1 Technology and Change:
Technological development is often seen in anthropological literature as having a
deterministic effect upon the flow of people, ideas, goods, and change, especially through the
lens of neoliberal development policies (Ervin 2015:75-94). This determinism comes in many
forms of technological use, including standardization influences, development, energy use, and
urbanization, and most often these technologies are the feature of anthropological critique on
globalizing initiatives towards neoliberal agendas of development, resource extraction, and
market expansion (Ervin 2015:111-133). Examples of this can be found in the work of Marvin
Harris (1981), who views the technology associated with a society’s infrastructure as
determining the institutional structures of relationships and thereby influencing the
superstructure of that society, seen through the expression of beliefs and cultural values (Ervin
2015:10-19). Though this critique is frequently apt regarding forced globalized change, and
quite necessary to include in promoting a holistic understanding of the process of cultural