Diffusion Limitation for Atrazine Biodegradation in Soil
Teresa A. Johnson1, Timothy R. Ellsworth2, Robert J. M. Hudson2, Gerald K. Sims3*
1Younkin Success Center, Ohio State University, Columbus, USA
2Department of Natural Resources and Environmental Sciences, University of Illinois, Urbana, USA 3Department of Entomology Plant Pathology and Weed Science, New Mexico State University, Las Cruces, USA
Email: *[email protected]
Received July 13, 2013; revised August 8, 2013; accepted August 15,2013
Copyright © 2013 Teresa A. Johnson et al. This is an open access article distributed under the Creative Commons Attribution
Li-cense, which permits unrestricted use, distribution, and reproduction in any medium, provided the original work is properly cited.
ABSTRACT
Effects of sub-millimeter scale heterogeneity in chemical and microbial distributions on atrazine degradation were ex- amined using Pseudomonas sp. strain ADP introduced into soil at a population mimicking atrazine-adapted soils (~2000 cells/g), and employing a range of soil water pressures (−100, −300, −500 kPa). Heterogeneous cell distribution was employed in all treatments whereas uniformity of distribution was a variable for atrazine introduction. Two methods of initially distributing atrazine in soil were examined. Proximally-applied atrazine (PAA) was intended to yield elevated atrazine concentrations in the vicinity of the degraders. Dispersed atrazine (DA) was introduced to distribute the chemi- cal uniformly as compared to the distribution of degraders. Both rate and extent of degradation were greater than PAA, regardless of water content, presumably due to proximity of atrazine to degraders. Biodegradation decreased with de- creasing water content for both application methods, attributed to decreases in atrazine’s effective diffusion. Minerali- zation of nearly 100% of DA in soils receiving a heterogeneous inoculum with a greater cell density (~107 cells/g) indi- cates that biodegradation was limited by the distance atrazine had to diffuse. Results support the hypothesis that en- hanced populations of atrazine degraders, as reported elsewhere for atrazine-adapted soils, though heterogeneously dis- tributed, may overcome bioavailability limitations.
Keywords: Biodegradation; Environmental; Agriculture; Degradation; Soil; Atrazine; Pseudomonas sp.
1. Introduction
The herbicide, atrazine (2-Chloro-4-(ethylamino)-6-(iso- propylamino)-s-triazine) has been used for more than fifty years [1], and remains among the most widely used herbicides globally, though recently banned in the Euro- pean Union in 2004 [2]. Atrazine is considered somewhat persistent, with a reference t1/2 of 60 d [3], however, in the case of atrazine-adapted soils, the t1/2 can be as short as 3.5 days [4-6]. The ecology of atrazine degraders has been examined to use a variety of approaches [7,8], in- cluding most recently, stable isotope probing [9]. Though theoretically feasible [10], applications of 15N-DNA-stable isotope probing to examine organisms causing enhanced degradation of atrazine at field rates provided equivocal results, owing to bioavailability limitations [6]. Using RNA-based 13C-stable isotope probing, it was shown that the diversity of atrazine degraders varies over millimeter scales in soil [9], though it was necessary to use 13C- atrazine at three orders of magnitude beyond the solubil- ity limit to detect these relationships.
Bioavailability and active degrader populations are ranked among the most influential factors in biodegrada- tion of organic substrates [11]. Adsorbed substrates are typically unavailable to microorganisms, even in aqueous suspensions [12], and soil sorption can similarly reduce availability of herbicides to target weeds [13], reducing effectiveness. Diffusion within micro-porous (impene- trable by bacteria) soil aggregates can further slow sorp- tion kinetics and biodegradation [14-17]. Atrazine deg- radation can be limited by bioavailability, though the herbicide is less hydrophobic than many herbicides, such as trifluralin [18]. Only 50% to 80% of atrazine applied to soil becomes sorbed [19], however detection of the herbicide in drainage water several years following its last application [20,21], suggests atrazine residues ex- hibit limited bioavailability despite modest sorption, pos- sibly due to physical inaccessibility.
Based on viable counting methods, atrazine degraders are apparently few in number in non-adapted agricultural soils (in some cases undetectable) whereas populations increase to >103 degraders g-soil−1 in atrazine-adapted soils [5,22]. Gonod, et al. [23], showed that 2,4-D de-
graders (typically present at similar or greater numbers than atrazine degraders) are heterogeneously distributed on scales of a few millimeters. At small (~one millimeter) scales, cells would be restricted to the pores of sufficient size to satisfy life support requirements. An inhabitable (to a bacterium) water-filled pore could be assumed to be a spherical volume with a radius of >1-m [15], while most pores in silt loam soils are <100-m in size [24] with up to 50% of the pore volume occurring in pores of <1-m [15], indicating many unoccupied pores. If we approximate the >1-m pores as spheres with an average diameter of 10-m, then one g of an atrazine-adapted silt loam soil (30% porosity and 103 degraders) would have 106 spherical pores and assuming organisms are uni- formly distributed, at most 0.07% of the pores would contain degraders. In unsaturated soils, larger pores are relatively dry while smaller pores may remain filled, and this network of pores is connected by tortuous paths through water films or pore throats [25]. For a given spa- tial separation, diffusion of solutes between adjacent pores is slower than within pores due to tortuosity. Thus, degradation of substrates is likely hindered by tortuous diffusion between unoccupied and occupied (by degrad- ers) pores in unsaturated soils, resulting in isolation of a considerable fraction of soluble pesticide from degraders [26,27]. Constraints on diffusion imposed by compart- mentalization thus limit competition among microbial populations, contributing to the diversity and functional redundancy [28]. Though these relationships are clear from the existing literature, it remains unclear the degree to which heterogeneity on this small scale affects biodeg- radation kinetics.
Impact of soil compartmentalization on microbial processes also depends on the fraction of water-filled pore space. As water content decreases, diffusion of non- volatile solutes decreases, thus xenobiotic degradation also tends to decrease with decreasing soil water content [29-31]. Harris [32] concluded that solute diffusion was more likely than osmotic stress to limit microbial proc- esses at low water content. The characteristic spatial scales (L) of concentration gradients are related to the time scales (T) over which they may form or break down and to the effective diffusion coefficient (Deff) by a scal- ing relationship of the form [15]:
2 eff
T L D (1)
This suggests that atrazine persistence may be linked to slow diffusion at relevant spatial scales. The observed persistence of atrazine for time scales considerably long- er than a month requires a concentration gradient with a length scale greater than 0.2 - 1 mm. Spatial variability at this scale and larger likely arise due to non-uniform pes- ticide application and low degrader populations.
Models of pesticide fate in soil generally assume that
there exists a local continuum scale, which is treated as being the same for each of the physical continua, as well as for each “site” or sorptive region within a continuum. Microbial cell density and other variables of interest (substrate concentration, soil water pressure, volumetric water content, etc.) are assumed to be “well-mixed” properties within the local continuum scale. This local continuum scale is commonly referred to as a Represen- tative Elementary Volume, or REV [33]. Biodegradation rates (R) may be expressed as mass per unit time as sec- ond-order functions of a local scale degrader population (Ndegrader) and a local scale average bulk concentration of soluble pesticide (Cbulk) [15,34]:
apparent degrader bulk
Rk N C (2) The apparent rate coefficient (kapparent) depends on the Michaelis-Menten parameters for degradation (Vmax and Km) and the ratio of xenobiotic concentrations at the cell
surface (Ccell) to that in bulk solution (Cbulk):
max cell apparent
bulk
m
V C
k
K C
(3)
The latter ratio is typically assumed to be unity, since diffusion limitation is not commonly considered as a factor. Thus, this expression assumes the existence of a local spatial volume, in which the influence of variations in the chemical concentration at microbial cell surfaces, with respect to the average solution concentration within the volume, is assumed negligible. Whether or not this is justified it is difficult to address, as diffusion kinetics are difficult to measure at small scales within soils, and are often inferred from experimental systems in which only overall mass transfer rates are measurable. Despite ex- perimental difficulties, accounting for pesticide diffusion limitation at scales relevant to processes controlling mi- crobial access have potential to improve our understand- ing of both persistence and enhanced degradation of pes- ticides [35-37], and may provide insight into the drivers of microbial functional redundancy in soils.
and degraders. In this case, the ratio Ccell/Cbulk would ini- tially be greater than unity. Initial degradation rates should reflect these differences in the ratio Ccell/Cbulk, whereas the subsequent degradation rates should reflect the rate of atrazine diffusion and redistribution. Complete degradation of the pesticide would require it to diffuse from uninhabited to inhabited pores, driven by concen- tration gradients created by biodegradation.
2. Materials and Methods
2.1. Soil
Cisne silt loam soil (fine, montmorillonitic, mesic, Mol- lic Albaqualf) was obtained from the surface of an agri- cultural field in Brownstown, Illinois, USA. The Cisne is a deep, poorly drained, slowly permeable soil formed in loess on glacial till plains. After air-drying, soil was sieved to obtain 0.4 to 2.0 mm diameter aggregates, typ- ical at the surface of the site. The soil had a particle den- sity of approximately 2.6 g·cm−3, and within the incuba- tion vessels, settled to a bulk density of 1.3 g·cm−3, yield- ing a total porosity of 0.51. The average bulk density of individual Cisne soil aggregates within this size class is approximately ~1.7 g·cm−3 (K. Olson, pers. comm.), yielding an intra-aggregate porosity of 0.36. The soil had a pH of 6.0, an organic carbon content of 1.1%, and a cation exchange capacity of 8.5 cmolc kg-soil−1. Ex-tractable 4 and 3 concentrations were 6.1 and 14.9 mg·kg−1 respectively, as determined by the micro-scale Berthelot method as modified by Sims [38].
NH -N NH -N
2.2. Chemicals
Atrazine (>99% purity) was acquired from Chem Service, West Chester, PA. Radiolabeled atrazine [UL-14C] (spe- cific activity 6.3 × 10⁸ Bq·mmol−1; >99% radiochemical purity) was purchased from Sigma Chemical Co., St. Louis, MO. Water and methanol were Optima™ grade (Fisher Scientific, Pittsburgh, PA). All other chemicals were ACS reagent grade and purchased from either Fisher or EM Science (Gibbstown, NJ).
2.3. Microorganism and Culture Conditions We chose to use Pseudomonas sp. strain ADP (P. ADP, provided by the University of Minnesota, St. Paul) as it has been shown to degrade atrazine constitutively [39], with rates unaffected by exogenous soil inorganic N sources [40], which can otherwise inhibit atrazine degra- dation in some soils [41]. The organism has been shown to succeed as a soil inoculum [39,40], and mineralizes the atrazine ring with insignificant metabolite production in soil [40]. The organism was cultured at 22˚C - 27˚C in a defined medium containing glucose (0.5 g·L−1) and atrazine (8.1 mg N·L−1) as sole N-source [42] with agita-
tion at 90 rev·min−1. Prior to each experiment, cells were harvested by centrifugation and washed once with sterile growth medium without a C, or N source.
2.4. Soil Degradation Experiments
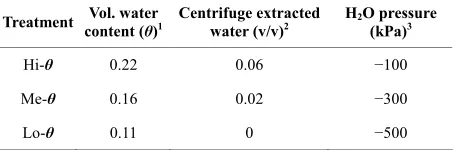
Mineralization of 14C-labeled atrazine by P. ADP was measured in replicate, soil biometers treated as described below. Prior to each experiment, 150-g quantities of air- dried soil were immersed in a methanol pretreatment for 24-h. Next, the methanol was allowed to evaporate (ap- proximately 24-h) in a sterile environment and 5-g sub- samples of soil were aseptically transferred into sterile 20-mL scintillation vials (24-mm ID 8.5-mm HT). Af- ter this methanol pre-treatment, the dehydrated soil was sterile and contained only 0.7% (w/w) water. To start the experiments, 100 μL (14 drops) of aqueous buffer con- taining P. ADP, to deliver 2000 cells g·soil−1 were ap- plied drop-wise onto the surface of the soil sub-samples, filling approximately 5% of the total pore space within and between aggregates, or 10% of the intra-aggregate pore space (Table 1). After the inoculum droplets were rapidly drawn into the dry aggregates that they first con- tacted (roughly 10% of the aggregates present), the sam- ple was inverted with a spatula to expose dry soil. Imme- diately thereafter, enough additional water to bring the soil to the desired water content was added (Table 1) and the soil aggregates were then mixed. The vials were sealed and incubated at 22˚C - 27˚C, with aeration at each sampling event. The mixing procedure above en- sured heterogeneity of P. ADP distribution and mini- mized aggregate destruction.
2.5. Atrazine Introduction
Table 1. Water content of soils used in experiments.
Treatment content (Vol. water θ)1 Centrifuge extracted water (v/v)2 H2O pressure (kPa)3
Hi-θ 0.22 0.06 −100
Me-θ 0.16 0.02 −300
Lo-θ 0.11 0 −500
1Computed using gravimetric water content and bulk density of 1.3 g·cm−3;
2Water recovered by centrifugation (see methods); 3Values derived from
moisture retention curve determined using standard methods [57].
solved in the 100 µL aqueous inoculum solution that was applied to each soil sample (see above).
Mineralization of atrazine was measured by liquid scintillation spectrometry (LSS) of 14CO
2 trapped on fil- ter paper (treated with 200 µL 0.2 M NaOH) suspended from the cap of each vial. A time series was obtained by repeatedly removing and replacing traps over 15 - 61 days. On days 15 and 60, atrazine in soil solution was obtained by placing replicate 5-g samples in 10-mL sy- ringes containing a stainless steel frit (2-µm pore), which were centrifuged at 17,200 g for 20-min and recovered pore water collected for analysis. To measure reversibly- sorbed atrazine, centrifuged soil solids were extracted sequentially with 0.01 M CaCl2 (4 mL) and methanol (4 mL) and 14C in the extracts analyzed using LSS [45]. The chemical form of detected radioactivity was confirmed as atrazine in extra replicate samples using HPLC analysis (radioactivity detection) as described by Bichat et al. [40]. The term sorbed atrazine is defined herein as the sum of these two extracts. Unextractable label (bound residue) was quantified by measuring 14CO
2 released during com- bustion of extracted soil samples (Biological Oxidizer- OX500, R. J. Harvey).
Water loss, determined gravimetrically after day-61, did not exceed 5% of the total water content. In one ex- periment, water content was increased to 0.24 mL·g−1 soil on day-18 by adding water without mixing. Aseptic technique was employed throughout the experiments.
2.6. Statistical Analyses
Statistical analyses of cumulative mineralization and bio- degradation rates consisted of analysis of variance using multivariate repeated-measures and mean comparisons via the SAS system (SAS Institute, Cary, NC), and the data analysis tools in Microsoft Excel. Analyses were run separately for time points before and after addition of water to the treatments at 18 d.
3. Results and Discussion
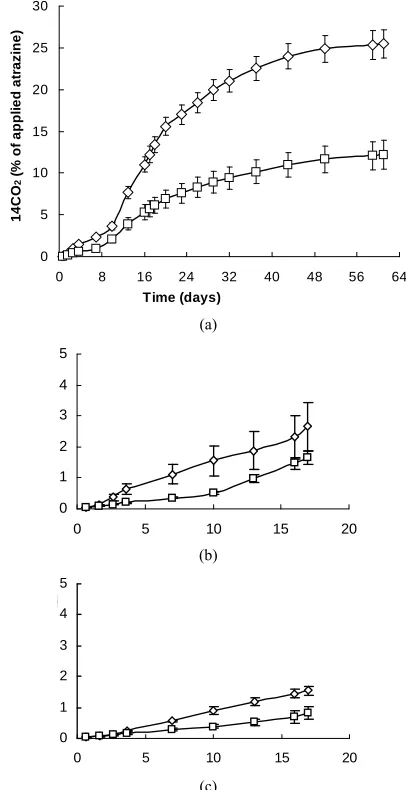
No metabolites were detected, thus mineralization and bound residues were assumed the only degradation prod- ucts. 14CO
2 evolution data presented for the dispersed
atrazine treatments in Figure 1 show a profound effect of initial P. ADP population on degradation kinetics. Nearly complete degradation of dispersed DA atrazine (up to 98% in 15 d) when elevated populations of P. ADP. (107 cells·g−1) were introduced into −100 kPa soil indicates that DA atrazine was immediately bioavailable. Degra- dation kinetics for the −100 and −300 kPa treatments were initially identical, but diverged after about 45% of the atrazine was degraded in the elevated P. ADP treat- ments (Figure 1). The −300 kPa treatment contained about 75% as much total water and about 40% as much centrifuge extracted water as the −100kPa treatment (Ta- ble 1), and would be expected to exhibit reduced solute transport. These findings were attributed to rapid deple- tion of atrazine near the cells creating a concentration gradient driving atrazine movement toward the organ- isms.
Herein, when the initial P. ADP population was 2000 cells·g-soil−1, whether atrazine was dispersed (DA) with the methanol or applied in the inoculum (PAA), cumula- tive mineralization curves at a water content of −100 kPa were S-shaped (Figure 2), with rates increasing for the first ~15 days and then slowing (effectively ceasing) be- tween days 40 - 50. No degradation was observed in uninoculated soil. In both application methods, most of the atrazine was not degraded (88% in the DA versus 76% in the PAA) implying that either the atrazine was no longer available to the P. ADP, or another factor de- creased activity of the degrader. Bound residues ac- counted for 40% - 50% of the applied atrazine, which is consistent with published results for soils exhibiting lim- ited atrazine degradation [46]. Approximately 30% of the initial atrazine remained bioavailable in dissolved or re- versibly sorbed forms on day-61 (Table 2). Measure- ments of bulk solution atrazine concentrations decreased ~3-fold between days 18 and 61 while the degradation rates decreased ~10-fold (Table 2), suggesting the supply rate to the degraders was controlled by a localized pool of atrazine that decreased more than the bulk solution.
Table 2. Distribution of 14C among phases as measured during experiments.
Day 18 of incubation Day 61 of incubation
Atrazine application
Water pressure
(kPa)†
Water content
(ml/g)† 14CO2
(% of initial) Cwa (mg/L) Cs
a
(mg/kg)
Kdb
(L/kg)
14CO 2
(% of initial)
Cwc
(mg/L)
Csc
(mg/kg)
14C Bound
(% of initial)
Kdb
(L/kg)
PAA −100 0.17 12.22 0.28 0.40 1.39 24.35 0.11 0.15 39.0 1.41
PAA −300 0.12 2.78 0.39 0.62 1.58 15.51 0.19 0.22 44.0 1.18
PAA −500 0.08 1.42 (0.44)d 0.65 14.29 (0.17)d (0.25)d 41.2
DA −100 0.17 5.83 0.41 0.59 1.46 12.70 0.13 0.24 49.5 1.88
DA −300 0.12 1.72 0.40 0.60 1.49 5.79 0.18 0.27 43.7 1.47
DA −500 0.08 0.78 (0.37)d 0.54 6.30 (0.21)d (0.31)d 40.9
aAtrazine concentrations,
Cw, (soil solution) and Cs (sorbed) are means of 9 replicates; bKd = Cs/Cw. Cs includes reversibly-sorbed (exchangeable) species only.
In abiotic sorption studies on the same soil, a Kd of 1.9 0.7 L/kg was obtained; cMeans of 6 replicates for −100 kPa and 3 replicates for −300 and −500 kPa;
dDissolved concentration calculated from average
Kd and Cs for this experiment.
†Analyses performed by A & L laboratories, Ft. Wayne, IN. performed as
described by Dane and Hopmans [57]. b 2.6 g·cm
−3, Aggregate porosity 0.32, bulk porosity 0.51.
0 20 40 60 80 100
0 100 200 300 400 500
Time (hours)
%
A
p
pl
ie
d R
a
di
o
car
b
o
n
10^3 (-100 kPa)
10^3 (-300 kPa)
10^7 (-100 kPa)
10^7 (-300 kPa)
0 5 10 15 20 25 30
0 8 16 24 32 40 48 56 64 Time (days)
14CO
2
(
%
of
a
p
pl
ie
d
at
ra
z
ine
)
[image:5.595.108.241.289.429.2]A. -100kPa
Figure 1. Cumulative mineralization of atrazine using an inoculation density of 103 or 107 viable cells g-soil−1. Atrazine was dispersed (DA) with methanol and soils adjusted to specified water pressures: −100 kPa (0.24 θ),−300 kPa (0.18
θ). Error bars indicate σ. If there are no error bars shown, bars are smaller than symbol.
(a)
0 1 2 3 4 5
0 5 10 15 20
B. -300kPa
dation was not caused by differences in bulk dissolved atrazine concentrations (Cw), which fell within a 10% range as expected for linear partitioning with the sorbed mass predominant (Table 2).
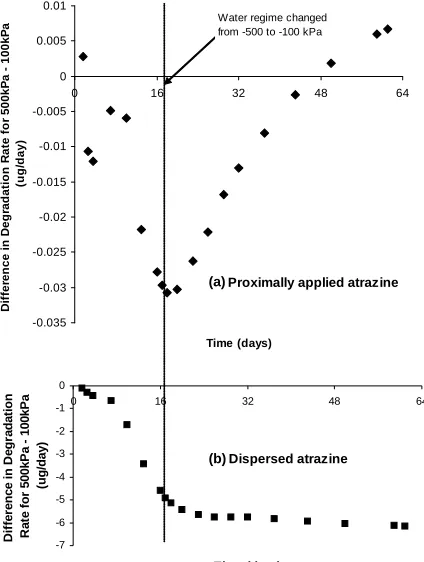
The difference in degradation rates (D, µg/d) between
−500 kPa and −100 kPa incubations (D−500 kPa – D−100 kPa) is reported in Figure 3 for the PAA and DA application methods. Since degradation rates were initially acceler- ating in −100kPa treatments, D−500 kPa – D−100 kPa de- creases over time. When water was added (without stir- ring) to achieve −100 kPa on day 18 in the −500 kPa incubations, the degradation rate increased (D−500 kPa – D−100 kPa ceased to decrease). Cumulative extents of atra- zine degradation in the two PAA treatments after water addition were nearly identical and the rates immediately after wetting were 2- to 5-fold higher than beforehand. Response of degradation rate to rewetting was much more subtle in the case of the DA application method (Figure 3(b)), likely owing to greater distances required
(b)
Proximally Applied Dispersed
0 1 2 3 4 5
0 5 10 15 20
C. -500kPa
(c)
[image:5.595.319.522.290.685.2]-7 -6 -5 -4 -3 -2 -1 0
0 16 32 48
Time (days) D if fer e n ce i n D eg rad at io n R at e f o r 500 kP a 1 00 k P a (ug/day ) 64 -0.035 -0.03 -0.025 -0.02 -0.015 -0.01 -0.005 0 0.005 0.01
0 16 32 48 6
Time (days) D if fer e n ce i n D eg ra d ati o n R a te f o r 5 00 k P a - 10 0k P a (ug/ da y ) 4 Water regime changed
from -500 to -100 kPa
A. Proximally applied atrazine
B. Dispersed atrazine
(a)
[image:6.595.65.277.86.367.2](b)
Figure 3.Impact of water regime on atrazine mineralization rate with an initial microbial population of 5 × 10³ cells g-soil−1. Data are for difference in degradation rates (D
−500 kPa - D−100 kPa expressed in µg atrazine/day) when soil was incubated initially at −100 kPa (D−100 kPa) versus initially in- cubated at −500 kPa and adjusted to −100 kPa at day 18 (D−500 kPa). Panel (a) shows results for proximally applied atrazine and panel (b) shows results for dispersed atrazine.
for atrazine movement to the cells compared to the PAA treatment. Increases in degradation rates upon water ad-dition to the PAA treatment are consistent with increases in net diffusion.
The general decrease in rates at low water pressures can be readily explained by reduced diffusion. Atrazine diffusion coefficients in these soil systems (Deff) were estimated using a semi-empirical solution-phase diffu- sivity for atrazine [34], the modified Millington-Quirk tortuosity relation, and standard retardation factor to ac- count for reversible adsorption [47], yielding Deff rang- ing between 4 × 10⁻⁹ cm2·s−1 at –100 kPa to 1 × 10⁻¹⁰ at –500 kPa. We calculated diffusion-limited initial degra- dation rates assuming cellular boundary layers are inde- pendent and regions containing degraders do not have depleted atrazine concentrations relative to bulk soil. For PAA/–500 kPa, the observed rate of ~0.4 ng·g-soil−1·d−1 was approximately 10-fold greater than the calculated diffusion-limited rate of 0.03 ng·g-soil−1·d−1. Similarly, the observed initial degradation rates in the PAA/–300 kPa and PAA/–100 kPa treatments were 3- and 1.5-fold above the theoretical maximum rates. Most likely, the
Deff are too low, especially for the PAA/–500 kPa treat- ment. Bulk empirical Deff measurements for other triaz- ine herbicides have been reported in the range of 8 × 10⁻⁹ cm2·s−1 to 7 × 10⁻⁸ cm2·s−1 in soils with similar volumet- ric water content and physical properties [48].
Degradation kinetics observed herein using a popula- tion (2000 cells·g−1) meant to simulate an atrazine- adapted soil were slower than observed at known adapted sites estimated to harbor 103 to 104 degraders·g−1, using mineralization of 14C-ring labeled atrazine for MPN detection [22,49]. Slower kinetics observed here may be due partly to limited ability of P. ADP to adapt to the Cisne soil, or to underestimation of populations by MPN methods used in published literature. Using P. ADP as a model for predicting populations at adapted sites (t1 2 < 10 days), approximately 104 to 105 degraders would be expected per gram, about one or two orders of magnitude greater than values commonly reported from 14C-ring labeled atrazine MPN studies, and about one order of magnitude greater than studies using 14C-ethyl-labeled atrazine [22]. Counting efficiencies of most MPN meth- ods are reported to underestimate indigenous microbial populations by one or more orders of magnitude, based on activity measurements [50,51], and failed to detect degraders in some non-adapted soils that exhibited sig- nificant degradation [22]. Thus, the discrepancies be- tween activity and estimates of microbial counts at atra- zine-adapted sites is consistent with the use of viable counting methods. Based on activity, populations in the range of 104 - 105 cells·g−1 at atrazine-adapted sites would be expected to yield MPN data comparable to that reported in the literature, and are in agreement with esti- mates using quantitative PCR [52]. Increasing the popu- lation to 107 g−1 herein produced faster initial degradation (0.013 µg·h−1) than reported for natural soil populations, suggesting the two population sizes used here bracket in situ cell densities expected at adapted sites. Results here- in support the hypothesis that relatively modest popula- tion increases reported for adapted sites [22] are suffi- cient to overcome diffusion limitations which have been suggested to be important with degrader populations less than 104 cells·g-soil−1 [53], and may explain the loss of herbicidal effectiveness when atrazine is used repeatedly over a period of many years.
4. Conclusion
biodegradation rates to fall below those predicted from bulk concentrations, and the slowness of diffusion limita- tions effectively isolate a fraction of the xenobiotic from degraders. The occurrence of millimeter-scale isolated regions of pore space is apparently a function of degrader population density. Microbial population effects observed here support the hypothesis that increasing degrader populations to ~105 cells·g−1 can be sufficient to over- come diffusion barriers, and may result in strong en- hancement of biodegradation, as reported elsewhere for atrazine-adapted sites. Among common herbicides, atra- zine is relatively mobile in soil, having a diffusion coef- ficient only an order of magnitude lower than that re- ported for one of the most mobile herbicides, 2,4-D [55]. Many herbicides are far less mobile than atrazine (e.g., dinitroanilines exhibit Deff up to six orders of magnitude lower than atrazine [56]), thus it is expected that submil- limeter scale diffusion will limit biodegradation of most soil applied herbicides.
5. Acknowledgements
A culture of P. ADP and the organism’s Michaelis con- stant for atrazine was provided by M. L. DeSouza. Steve Wente’s assistance with statistical analyses is appreciated. This work was partially supported by The Agricultural Research Service, United States Department of Agricul- ture, project number 3611-12220-006-00D, and salary support for the corresponding author during the writing period was provided by the New Mexico State University Agricultural Experiment Station. The authors have no conflict of interest to declare.
REFERENCES
[1] H. M. LeBaron, J. E. MsFarland and O. Burnside, “The Triazine Herbicides: A Milestone in the Development of Weed Control Technology,” In: H. M. LeBaron, J. E. McFarland and O. Burnside, Eds., The Triazine Herbi- cides: 50 Years Revolutionizing Agriculture, Elsevier BV,
Oxford, 2008, pp. 1-12.
[2] F. Ackerman, “The Economics of Atrazine,” Interna- tional Journal of Occupational and Environmental Health,
Vol. 13, No. 4, 2007, pp. 437-444.
[3] R. D. Wauchope, T. M. Butler, A. G. Hornsby, P. M. Augustine-Bekcers and J. P. Burt, “The SCS/ARS/CES Pesticide Properties Database for Environmental Decision Making,” Reviews of Environmental Contamination and Toxicology, Vol. 123, 1992, pp. 1-155.
doi:10.1007/978-1-4612-2862-2_1
[4] D. L. Shaner and W. B. Henry, “Field History and Dissi- pation of Atrazine and Metolachlor in Colorado,” Journal of Environmental Quality, Vol. 36, No. 1, 2007, pp. 128- 134. doi:10.2134/jeq2006.0160
[5] J. L. Krutz, D. L. Shanerb, C. Accinelli, R. M. Zabloto- wicz, and W. B. Henry, “Atrazine Dissipation in s-Tria- zine-Adapted and Nonadapted Soil from Colorado and
Mississippi: Implications of Enhanced Degradation on Atrazine Fate and Transport Parameters,” Journal of En- vironmental Quality, Vol. 37, No. 3, 2008, pp. 848-857.
doi:10.2134/jeq2007.0448
[6] E. A. Shaffer, G. K. Sims, A. M. Cupples, C. Smyth, J. Chee-Sanford and A. Skinner, “Atrazine Biodegradation in a Cisne Soil Exposed to a Major Spill,” International Journal of Soil, Sediment and Water, Vol. 3, No. 2, 2010,
pp. 1-26.
[7] J. Mahía, S. J. González-Prieto, A. Martín, E. Bååth and M. Díaz-Raviña, “Biochemical Properties and Microbial Community Structure of Five Different Soils after Atra- zine Addition,” Biology and Fertility of Soils, Vol. 47, No.
5, 2011, pp. 577-589. doi:10.1007/s00374-011-0569-x [8] C. Monard, F. Martin-Laurent, M. Devers-Lamran, O.
Lima, P. Vandenkoornhuyse and F. Binet, “atz Gene Ex- pressions during Atrazine Degradation in the Soil Drilos- phere,” Molecular Ecology, Vol. 19, No. 4, 2010, pp.
749-759. doi:10.1111/j.1365-294X.2009.04503.x
[9] C. Monard, P. Vandenkoornhuyse, B. L. Bot and F. Binet, “Relationship between Bacterial Diversity and Function under Biotic Control: The Soil Pesticide Degraders as a Case Study,” The ISME Journal, Vol. 5, 2011, pp. 1048-
1056. doi:10.1038/ismej.2010.194
[10] A. M. Cupples, E. A. Shaffer, J. C. Chee-Sanford and G. K. Sims, “DNA Buoyant Density Shifts during 15N DNA Stable Isotope Probing,” Microbiological Research, Vol. 162, No. 4, 2007, pp. 328-334.
doi:10.1016/j.micres.2006.01.016
[11] Y. J. Tang, L. Qi and B. Krieger-Brockett, “Evaluating Factors That Influence Microbial Phenanthrene Biodeg- radation Rates by Regression with Categorical Variables,”
Chemosphere, Vol. 59, No. 5, 2005, pp. 729-741.
doi:10.1016/j.chemosphere.2004.10.037
[12] E. J. O’Loughlin, S. J. Traina and G. K. Sims, “Effects of Sorption on the Biodegradation of 2-Methylpyridine in Aqueous Suspensions of Reference Clay Minerals,” En- vironmental Toxicology and Chemistry, Vol. 19, No. 9, 2000, pp. 2168-2174. doi:10.1002/etc.5620190904 [13] G. K. Sims, S. Taylor-Lovell, G. Tarr and S. Maskel,
“Role of Sorption and Degradation in the Herbicidal Function of Isoxaflutole,” Pest Management Science, Vol. 65, No. 7, 2009, pp. 805-810. doi:10.1002/ps.1758 [14] P. M. Gschwend and S. C. Wu, “On the Constancy of
Sediment-Water Partition Coefficients of Hydrophobic Organic Pollutants,” Environmental Science and Tech- nology, Vol. 19, No. 1, 1985, pp. 90-96.
doi:10.1021/es00131a011
[15] M. Alexander and K. M. Scow, “Kinetics of Biodegrada- tion in Soil,” In: B. L. Sawhney and K. Brown, Eds., Re- actions and Movement of Organic Chemicals in Soils,
ASA and SSSA, Madison, 1989, pp. 243-269.
[16] K. M. Scow and M. Alexander, “Effect of Diffusion on the Kinetics of Biodegradation: Experimental Results with Synthetic Aggregates,” Soil Science Society of Ame- rica Journal, Vol. 56, No. 1, 1992, pp. 128-134.
doi:10.2136/sssaj1992.03615995005600010020x
siderations,” Soil Science Society of America Journal, Vol.
56, No. 1, 1992, pp. 119-127.
doi:10.2136/sssaj1992.03615995005600010019x
[18] E. Hiller, Z. Krascsenits and S. Cernanský, “Sorption of Acetochlor, Atrazine, 2,4-D, Chlorotoluron, MCPA, and Trifluralin in Six Soils from Slovakia,” Bulletin of Envi- ronmental Contamination and Toxicology, Vol. 80, No. 5,
2008, pp. 412-416. doi:10.1007/s00128-008-9430-9 [19] D. A. Laird and W. C. Koskinen, “Triazine Soil Intera-
tions,” In: H. M. LeBaron, J. E. McFarland and O. Burn- side, Eds., The Triazine Herbicides: 50 Years Revolution- izing Agriculture, Elsevier, Oxford, 2008, pp. 275-300. [20] A. R. Isensee, R. G. Nash and C. S. Helling, “Effect of
Conventional vs. No-Tillage on Pesticide Leaching to Shallow Groundwater,” Journal of Environmental Qual- ity, Vol. 19, No. 3, 1990, pp. 434-440.
doi:10.2134/jeq1990.00472425001900030014x
[21] D. D. Buhler, G. W. Randall, W. C. Koskinen and D. L. Wyse, “Atrazine and Alachlor Losses from Subsurface Tile Drainage of a Clay Loam Soil,” Journal of Environ- mental Quality, Vol. 22, No. 3, 1993, pp. 583-588.
doi:10.2134/jeq1993.00472425002200030024x
[22] K. Jayachandran, N. B. Stolpe, T. B. Moorman and P. J. Shea, “Application of 14C-Most-Probable-Number Tech- nique to Enumerate Atrazine-Degrading Microorganisms in Soil,” Soil Biology and Biochemistry, Vol. 30, No. 4,
1998, pp. 523-529. doi:10.1016/S0038-0717(97)00137-5 [23] L. V. Gonod, C. Chenu and G. Soulas, “Spatial Variabil-
ity of 2,4-Dichlorophenoxyacetic Acid (2,4-D) Minerali- sation Potential at a Millimetre Scale in Soil,” Soil Biol- ogy & Biochemistry, Vol. 35, No. 3, 2003, pp. 373-382.
doi:10.1016/S0038-0717(02)00287-0
[24] L. Wu, “Pore Size, Particle Size, Aggregate Size, and Water Retention,” Soil Science Society of America Jour- nal, Vol. 54, No. 4, 1990, pp. 952-956.
doi:10.2136/sssaj1990.03615995005400040002x
[25] M. Tuller, D. Or and L. M. Dudley, “Adsorption and Capillary Condensation in Porous Media: Liquid Reten- tion and Interfacial Configurations in Angular Pores,”
Water Resources Research, Vol. 35, No. 7, 1999, pp. 1949-1964. doi:10.1029/1999WR900098
[26] P. Duquenne, C. Chenu, G. Richard and G. Catroux, “Ef- fect of Carbon Source Supply and Its Location on Com- petition between Inoculated and Established Bacterial Strains in Sterile Soil Microcosm,” FEMS Microbiology Ecology, Vol. 29, No. 4, 1999, pp. 331-339.
doi:10.1111/j.1574-6941.1999.tb00624.x
[27] G. Soulas and B. Lagacherie, “Modeling of Microbial Degradation of Pesticides in Soils,” Biology and Fertility of Soils, Vol. 33, No. 6, 2001, pp. 551-557.
doi:10.1007/s003740100363
[28] J. Zhou, B. Xia, H. Huang, A. V. Palumbo and J. M. Tiedje, “Microbial Diversity and Heterogeneity in Sandy Subsurface Soils,” Applied and Environmental Microbi- ology, Vol. 70, No. 3, 2004, pp. 1723-1734.
doi:10.1128/AEM.70.3.1723-1734.2004
[29] T. A. Johnson, G. K. Sims, T. R. Ellsworth and A. M. Balance, “Effects of Moisture and Sorption on Biodegra- dation of p-Hydroxybenzoic Acid by Arthrobacter sp.,”
Microbiological Research, Vol. 153, No. 4, 1998, pp.
349-353. doi:10.1016/S0944-5013(99)80049-4
[30] D. R. Shelton and T. B. Parkin, “Effect of Moisture on Sorption and Biodegradation of Carbofuran in Soil,”
Journal of Agriculture and Food Chemistry, Vol. 39, No.
11, 1991, pp. 2063-2068. doi:10.1021/jf00011a036 [31] M. Mojasevic, C. S. Helling, T. J. Gish and M. A. Do-
herty, “Persistence of Seven Pesticides as Influenced by Soil Moisture,” Journal of Environmental Science and Health, Vol. 31, No. 3, 1996, pp. 469-476.
doi:10.1080/03601239609373009
[32] R. F. Harris, “Effect of Water Potential on Microbial Growth and Activity,” In: D. M. Kral, et al., Eds., Water Potential Relations in Soil Microbiology, Vol. 9, Soil Sci-
ence Society of America, Madison, 1981, pp. 23-95. [33] P. Baveye and C. W. Boast, “Physical Scales and Spatial
Predictability of Transport Processes in the Environ-ment,” Geophysical Monograph Series, Vol. 108, pp. 261-
280.
[34] R. P. Schwarzenbach, P. M. Gschwend and D. M. Im- boden, “Environmental Organic Chemistry,” John Wiley & Sons, Inc., New York, 1993.
[35] A. M. Cupples, G. K. Sims, R. P. Hultgren and S. E. Hart, “Effect of Soil Conditions on the Degradation of Cloran- sulam-Methyl,” Journal of Environmental Quality, Vol.
29, No. 3, 2000, pp. 786-794.
doi:10.2134/jeq2000.00472425002900030014x
[36] S. F. Simoni, A. Schafer, H. Harms and A. J. B. Zehnder, “Factors Affecting Mass Transfer Limited Biodegradation in Saturated Porous Media,” Journal of Contaminant Hy- drology, Vol. 50, No. 1-2, 2001, pp. 99-120.
doi:10.1016/S0169-7722(01)00099-7
[37] L. Y. Wick, T. Colangelo and H. Harms, “Kinetics of Mass Transfer-Limited Bacterial Growth on Solid PAH’s,”
Environmental Science and Technology, Vol. 35, No. 2,
2001, pp. 354-361. doi:10.1021/es001384w
[38] G. K. Sims, “Using the Berthelot Method for Nitrite and Nitrate Analysis,” Soil Science Society of America Jour- nal, Vol. 70, No. 3, 2006, p. 1038.
doi:10.2136/sssaj2005.0408l
[39] R. Mandelbaum, D. Allan and L. Wackett, “Isolation and Characterization of a Pseudomonas sp. That Mineralizes
the s-Triazine Herbicide Atrazine,” Applied and Envi-ronmental Microbiology, Vol. 61, No. 4, 1995, pp. 1451-
1457.
[40] F. Bichat, G. K. Sims and R. L. Mulvaney, “Microbial Utilization of Heterocyclic Nitrogen from Atrazine,” Soil Science Society of America Journal, Vol. 63, No. 1, 1999,
pp. 100-110.
doi:10.2136/sssaj1999.03615995006300010016x
[41] G. K. Sims, “Nitrogen Starvation Promotes Biodegrada- tion of N-Heterocyclic Compounds in Soil,” Soil Biology & Biochemistry, Vol. 38, No. 8, 2006, pp. 2478-2480. doi:10.1016/j.soilbio.2006.01.006
302.
[43] C. M. Hansen, “Hansen Solubility Parameters: A User’s Handbook,” 2nd Edition, CRC Press Taylor Francis Group, Boca Raton, p. 2007.
[44] T. A. Johnson and G. K. Sims, “Introduction of 2,4-Dich- lorophenoxyacetic Acid into Soil with Solvents and Re- sulting Implications for Bioavailability to Microorgan- isms,” World Journal of Microbiology and Biotechnology,
Vol. 27, No. 5, 2010, pp. 1137-1143. doi:10.1007/s11274-010-0560-y
[45] S. Clay and W. Koskinen, “Adsorption and Desorption of Atrazine, Hydroxyatrazine, and s-Glutathione Atrazine on Two Soils,” Weed Science, Vol. 38, No. 3, 1990, pp. 262-
266.
[46] S. Houot, E. Topp, A. Yassir and G. Soulas, “Dependence of Accelerated Degradation of Atrazine on Soil pH in French and Canadian Soils,” Soil Biology & Biochemistry,
Vol. 32, No. 5, 2000, pp. 615-625. doi:10.1016/S0038-0717(99)00188-1
[47] W. A. Jury and R. Horton, “Soil Physics,” 6th Edition, John Wiley and Sons, Inc., New York, 2004.
[48] A. Walker and D. V. Crawford, “Diffusion Coefficients for Two Triazine Herbicides in Six Soils,” Weed Re- search, Vol. 10, No. 2, 1970, pp. 126-132.
doi:10.1111/j.1365-3180.1970.tb00933.x
[49] R. M. Zablotowicz, M. A. Weaver and M. A. Locke, “Mi- crobial Adaptation for Accelerated Atrazine Mineraliza- tion Degradation in Mississippi Delta Soils,” Weed Sci- ence, Vol. 54, No. 3, 2006, pp. 538-547.
doi:10.1614/WS-04-179R3.1
[50] K. H. Baker and A. L. Mills, “Determination of the Num- ber of Respiring Thiobacillus Ferrooxidans Cells in Water Samples by Using Combined Fluorescent Antibody-2-(p- Iodophenyl)-3-(p-Nitrophenyl)-5-Phenyltetrazolium Chlo-
ride Staining,” Applied and Environmental Microbiology,
Vol. 43, No. 2, 1982, pp. 338-344.
[51] L. W. Belser and E. L. Mays, “Use of Nitrifier Activity Measurements to Estimate the Efficiency of Viable Nitri- fier Counts in Soils and Sediments,” Applied and Envi-ronmental Microbiology, Vol. 43, No. 4, 1982, pp. 945-
948.
[52] F. Martin-Laurent, L. Cornet, L. Ranjard, J. C. López- Gutiérrez, L. Philippot, C. Schwartz, R. Chassod, G. Ca- troux and G. Soulas, “Estimation of Atrazine-Degrading Genetic Potential and Activity in Three French Agricul- tural Soils,” FEMS Microbiology Ecology, Vol. 48, No. 3, 2004, pp. 425-435. doi:10.1016/j.femsec.2004.03.008 [53] Y. Comeau, C. W. Greer and R. Samson, “Role of Inocu-
lum Preparation and Density on the Bioremediation of 2,4-D-Contaminated Soil by Bioaugmentation,” Applied Microbiology and Biotechnology, Vol. 38, No. 5, 1993, pp. 681-687. doi:10.1007/BF00182810
[54] G. K. Sims and A. M. Cupples, “Factors Controlling Deg- radation of Pesticides in Soil,” Pesticide Science, Vol. 55, No. 5, 1999, pp. 566-614.
doi:10.1002/(SICI)1096-9063(199905)55:5<598::AID-PS 962>3.0.CO;2-N
[55] T. Y. Kim, S. S. Park, S. J. Kim and S. Y. Cho, “Separa- tion Characteristics of Some Phenoxy Herbicides from Aqueous Solution,” Adsorption, Vol. 14, No. 5, 2008, pp.
611-619. doi:10.1007/s10450-008-9129-6
[56] L. E. Bode, C. L. Day, M. R. Gebhardt and C. E. Goering, “Mechanism of Trifluralin Diffusion in Silt Loam Soil,”
Weed Science, Vol. 21, 1973, pp. 480-484.