http://www.scirp.org/journal/ijmpcero ISSN Online: 2168-5444
ISSN Print: 2168-5436
Generation of Dose Volume Histograms Using
Voxel Structure and the Monte Carlo Method in
Low Dose Rate Brachytherapy
Artur F. Menezes1*, Hidmer Laulate1, Juraci P. Reis Junior1, Lucia H. Bardella2, Alessandro Facure3, Ademir X. Silva1
1Programa de Engenharia Nuclear/COPPE, Universidade Federal do Rio de Janeiro, Rio de Janeiro, Brasil 2Seção de Física Médica, Instituto Nacional de câncer, Rio de Janeiro, Brasil
3Comissão Nacional de Energia Nuclear, Rio de Janeiro, Brasil
Abstract
The Dose Volume Histograms are tools commonly used in medical physics, for the analysis of doses delivered to the tumors and organs at risk, during radiotherapy treatments. However, there are few studies in the literature showing in details the steps of its construction. This work presents the implementation and evaluation of a computational methodology, for the construction of Dose Volume histograms, gen-erated from simulations using anthropomorphic and voxel phantoms, in conjunction with the Monte Carlo code MCNP. The methodology was evaluated considering brachytherapy planning of low dose rate, using 108 seeds of I-125 with individual ac-tivities of 0.33 mCi performed on the simulator in voxel recommended by ICRP 110. The dosimetric analysis after implantation showed that the prostate received doses ranging from 0 to 360 Gy. We found the values of 50, 145 and 160 Gy for the para-meters D100, D90 and D80 and 28%, 90%, 92% and 95% for the parameters V200, V100,
V90 and V80. The rectum and bladder received maximum doses equal to 41 and 60 Gy
and found the values of 39 and 22 Gy and 58 and 42 Gy to the parameters D0.1cc and
D2cc, respectively. The results after dosimetric implant proved satisfactory, which
va-lidate the methodology described above.
Keywords
DVHs, Voxel, ICRP 110, MCNPX
1. Introduction
Today, the Monte Carlo method has become a tool commonly used in various segments
How to cite this paper: Menezes, A.F., Laulate, H., Junior, J.P.R., Bardella, L.H., Facure, A. and Silva, A.X. (2016) Generation of Dose Volume Histograms Using Voxel Structure and the Monte Carlo Method in Low Dose Rate Brachytherapy. Internationa Journal of Medical Physics, Clinical Engi- neering and Radiation Oncology, 5, 230-241. http://dx.doi.org/10.4236/ijmpcero.2016.54024
Received: July 27, 2016 Accepted: October 24, 2016 Published: October 27, 2016
Copyright © 2016 by authors and Scientific Research Publishing Inc. This work is licensed under the Creative Commons Attribution International License (CC BY 4.0).
http://creativecommons.org/licenses/by/4.0/
of science and engineering to simulate problems that can be represented by stochastic processes, like simulations involving the transport of radiation applied to medical physics [1][2]. These codes can be used for photon, electron and neutron transport and can be applied to radiation protection and dosimetry, radiation shielding, medical physics among other areas [3].
The use of the Monte Carlo method, in conjunction with voxels phantoms made possible the reproduction of some radiotherapy treatment planning in computing en-vironments, simulating more realistic scenarios of the different structures of the human body. In this sense, for performing simulation involving the Monte Carlo method it is necessary to use voxel structure recognized by the MCNP radiation transport code. For this purpose, Boia et al. [4] developed a computational methodology to convert the pa-tient DICOM image in a voxel structure recognized by MCNP code. Alternatively, there are studies [5] using voxel simulator MAX and others [6] using REX simulator pub-lished by Kramer et al. [7] and for the ICRP110 [8], respectively.
For the analysis of the doses tools called Dose Volume Histograms (DVHs) have been used that are tools made available by different radiotherapy treatment planning systems, which are used to assess the radiation dose for each specific volume, and represent the frequency distribution of the dose values obtained in a three-dimensional voxel matrix, even for the target volume or to the critical adjacent structures [9].
Studies related to DVHs have been conducted by some researchers considering dif-ferent methodologies. Pyakuryal et al. [10] developed a MatLab program to analyze plans of exported doses of Pinacco treatment planning system. Bruno et al. [11] con-ducted a dosimetric comparative study of implants using I-125 and Pd-103 sources based on the analyses of the DVHs in conjunction with SISCODES program (Computer System for Dosimetry by Neutrons and Photons by Stochastic Methodos) and MCNP code.
Although there are studies in the literature reporting the use of the dose volume his-togram (DVHs), it can be seen that there is a lack of detail showing how these tools are built through simulation treatments using in voxels simulators and MCNP transport code. In this context, the application of a computational methodology will assist users in the construction of the DVHs, from simulations using anthropomorphic phantoms in voxels and the Monte Carlo method is justified. For this purpose, we used the MCNPX code to obtain a digital output file, with the dosimetric data to be evaluated, enabling the construction of Dose Volumes Histograms for organs that are the ob-jects of this study considering an implant of low dose rate brachytherapy using 125I
sources.
2. Methodology
2.1. Modeling and Validation of I-125 Source
The first step in this work consisted in to model and validate a brachytherapy source containing 125I, Amersham, model 6711 [12].
anisotropy function and radial dose function, recommended by the dosimetry protocol TG43U1 [13]. This source is constituted by two cylinders, the inner is composed of sil-ver, 𝜌𝜌= 10.5 g/cm3, and has a length of 3 mm and basis of 0.5 mm coated by an
emmi-ter thickness of 1 μm, containing 125I in the form of silver iodide (𝜌𝜌= 6.2 g/cm3). The
outer cylinder is composed of titanium (𝜌𝜌 = 4.54 g/cm3), has a length of 4.5 mm and
basis of 0.81 mm closed by two ellipsoides [12]. The energy distribution of the photons emitted by the simulated 125I source, used as an input parameter for the simulation, is
presented in Table 1.
2.2. Dose Volume Histogram (DVH)
For the generation and evaluation of the DVHs using the MCNP Monte Carlo code, a prostate treatment plan consisting of 108 125I seeds was elaborated, with seed activities
of 0.33 mCi, using the male phantom model recommended by ICRP110 [8]. Consider-ing that the prostate of the simulator has very small volume, the seeds were inserted with spacing of 5 mm.
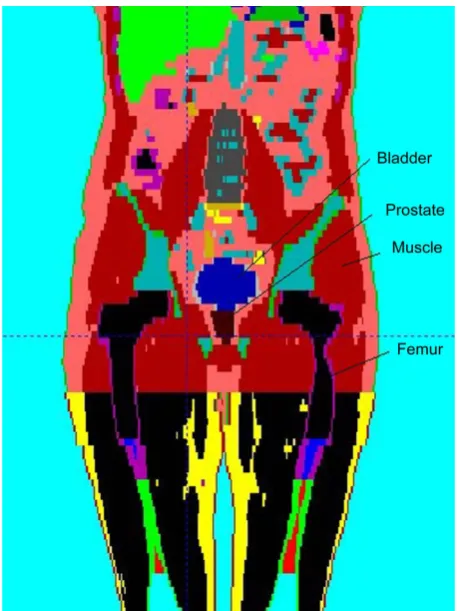
Figure 1 shows the mentioned model, that represents an adult of 38 years, with a
height of 176 cm and weight of about 73 kg. This simulator has voxels dimension of 2.137 × 2.137 × 8 mm3, which corresponds to a volume equal to 36.53 mm3 and
con-tains a total of 122 segmented structures.
The distribution of the 125I seeds inside the prostate was obtained using the automatic
replication program developed by Boia et al. [14]. The dose in each voxel of interest was obtained setting some plans, in order to define volumetrically the volume of each organ and using the MCNP code tools, that allow the individual calculation of the dose for all voxels delimited by the plans.
[image:3.595.194.553.573.702.2]The absorbed dose in the volume studied was obtained using the command tally * F8 (MeV) of the MCNP code, applied in each voxel of interest, considering the number (N) of the used sources divided by the mass (g) of each voxel, taking in account the integra-tion of the activity throughout the life of the source (Equaintegra-tion (1)). All simulaintegra-tions were performed considering the transport of photons and electrons (mode p e) with a cutoff energy of 5 keV and the dose of the prostate, bladder and rectum were evaluated using the methodology described above.
Table 1. Energy distribution of the fotons emitted by 125I sources [12].
Energy (MeV) Photons per disintegration
0.035492 0.0668
0.03171 0.0439
0.03098 0.202
0.027472 0.757
0.027202 0.406
Figure 1. Visualization of the different structures present in the male anthropomorphic simulator, recommended by ICRP110.
( )
10( )
0 8 MeV(
( )
)
Gy 1.602 10
g F A
D N
m λ −
= ×
(1)
Through the analysis of the doses obtained for all voxels in the organ of interest, it became possible to generate the Dose Volume Histogram, taking into account the class interval for the desired dose level and the frequency distribution of voxels for these dose levels. The simulation was performed using the MCNPX code, with uncertainties below 5%, thus guaranteeing satisfactory results according to the limits of reliability presented by the relative error interpretation guidelines of MCNP like can be seen in Table 2[15].
Figure 2 illustrates the computational diagram of the metotology for DVHs
genera-tion using the MCNP radiagenera-tion transport code applied to Low Dose Rate Brachytherapy implant using 125I sources.
3. Results and Discussion
3.1. Computational Modeling and Validation of 125I Source
Figure 3 shows two-dimensional cuts, obtained with the Moritz graphic viewer [16] il-lustrating the shape of different structures constituting the simulated 125I source. The
Table 2. Guidelines for interpretation of the relative errors (R) obtained for MCNP [15].
Range of R Tally Quality
0.5 - 1.0 Not Reliable
0.2 - 0.5 Hardly Reliable
0.1 - 0.2 Questionably
<0.1 Generally Reliable
<0.05 Reliable
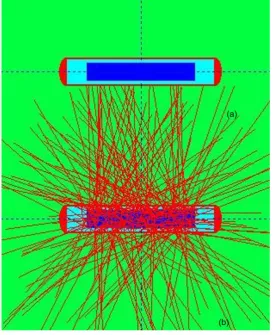
Figure 3. 125I sources modeled using MCNP code: (a) Two-dimensional
view; (b) Photons emitted by the source.
the ptrack card, provided by the MCNP code, permitted the illustration of the particle being emitted by modeled sources in the Figure 3(b).
Table 3 shows the results obtained in this work for the dose rate constant, in
com-parison with the results taken from the literature [17]-[19]. The good agreement is an indication of computational effectiveness of the performed modeling.
The results presented in this work (Table 3) showed a better agreement with those obtained in references [19]. It should be mentioned that the value associated with the TG-43 report is higher than those obtained in the other references, 4% higher when compared to the present work.
In Figure 4 the results for the anisotropy function are shown for 1 cm distance,
compared with other workers results obtained from the literature [13][18][19]. It Can be seen a good agreement with the literature results.
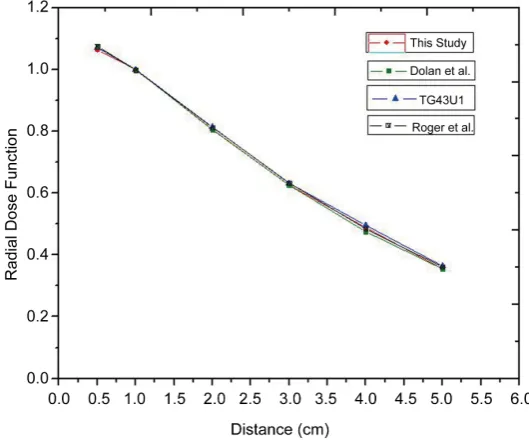
Figure 5 is showed the result for the radial dose functions obtained for 125I. They are
compared with the results of several studies reported in the literature [13][18][19]. It can be seen a good agreement with the literature results.
Table 3. Dose rate constant of 125I source.
References Dose Rate Constant (cGy/hU)
TG-43 Consensus Value (Rivard et al.) [17] 0.965
J. Dolan et al. (extrap/WAFAC (PTRAN)) [18] 0.942
R. E. Taylor, D. W. O. Rogers (WAFAC) [19] 0.924
R. E. P. Taylor. D. W. Rogers (Point) [19] 0.942
[image:7.595.240.505.462.682.2]This Study 0.928
Figure 4. Anisotropy function from 1 cm irradiation source.
3.2. Dose Volume Histogram
This section presents the DVHs results for the prostate, bladder and rectum using the methodology described above. In Table 4 the distributions of the Dose Volume Fre- quency are presented, considering all voxels of the prostate volume and intervals classes interval equal to 50 Gy. The prostate gland received doses ranging between 0 and 360 Gy when 108 seeds of 125I were simulated. The parameters F
Vol, Fac, represent the
volu-metric and accumulated frequency, respectively. The voluvolu-metric frequency (FVol) was
obtained by multiplying the number of voxels belonging to a range of dose and the vo-lume of individual voxel. The accumulated frequency (Fac) was obtained through the
sum of the accumulated volumes to the levels of doses considered.
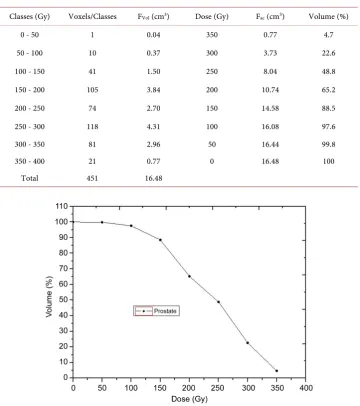
Figure 6 shows the DVH obtained through the distributions of frequency presented
[image:8.595.194.555.280.687.2]in Table 4. We found the values of 50, 145 and 160 Gy for parameters D100, D90 and D80,
Table 4. Dose volume frequency for the prostate grand.
Classes (Gy) Voxels/Classes FVol (cm3) Dose (Gy) Fac (cm3) Volume (%)
0 - 50 1 0.04 350 0.77 4.7
50 - 100 10 0.37 300 3.73 22.6
100 - 150 41 1.50 250 8.04 48.8
150 - 200 105 3.84 200 10.74 65.2
200 - 250 74 2.70 150 14.58 88.5
250 - 300 118 4.31 100 16.08 97.6
300 - 350 81 2.96 50 16.44 99.8
350 - 400 21 0.77 0 16.48 100
Total 451 16.48
and 28%, 90%, 92% and 95% for volumetric parameters V200, V100, V90 and V80,
respec-tively. The DVH shows that 90% of the volume of the prostate receives a value of dose equal to 145 Gy, which is typically used as a reference [20]-[22] for the prescription dose in Low Dose Brachytherapy using 125I sources. Based on these dosimetric
[image:9.595.209.536.433.684.2]parame-ters the implant was considered satisfactory for the purpose of this study.
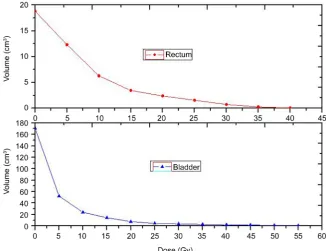
Figure 7 illustrates the DVHs for the rectum and bladder, using class intervals of 5
Gy. It can be seen that the rectum and bladder received maximum doses equal to 41 and 60 Gy, respectively. The DVH show that 0.1 and 2 cm3 (D
0.1cc and D2cc) of the rectum
received doses of 39 and 22 Gy. The bladder received doses of 58 and 42 Gy in 0.1 and 2 cm3 of volume. These values are in agreement with reference values presented in the
li-terature [20]-[22].
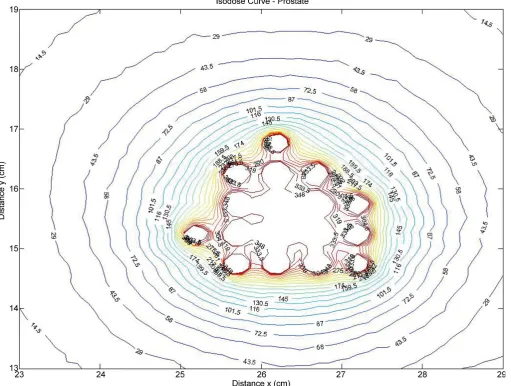
The isodose curves were obtained in a region of the prostate using the MCNP com-mand mesh tally. The mesh tally was used to quantify the absorbed dose in a matrix of dose defined by voxels of dimensions 0.12 × 0.12 × 0.12 cm3.
The absorbed dose obtained for each voxel of the mesh tally array was recorded in a binary file. The values of doses were obtained primarily in rem/h and subsequently converted to Gy/s per particle emitted by the source. For the construction of the isodose curves a program in MATLAB was developed.
Figure 8 shows that the curve of 145 Gy was used as prescription cover all volumetric extension of the prostate gland.
4. Conclusions
The results generated to the DVHs applying the methodology adopted for the implan-
Figure 8. Isodose curves using the Matlab program.
tation of 108 seeds of 125I proved satisfactory for the assessment of doses in the prostate
gland and in adjacent organs of males’ anthropomorphic phantom of the ICRP.
The prostate gland received doses between 0 and 360 Gy. We found the values of 50, 145 and 160 Gy for the parameters D100, D90 and D80 and 28%, 90%, 92% and 95% for
the parameters V200, V100, V90 and V80.
The rectum and bladder received maximum doses equal to 41 and 60 Gy and found the values of 39 and 22 Gy and 58 and 42 Gy to the parameters D0.1cc and D2cc,
respec-tively.
Taking into account the results found for the prostate gland and for the adjacent or-gans, it was concluded that the implants present the requirements indicative of good quality for 125I implants in treatment using Low Dose Rate brachytherapy. Given this
This methodology is not restricted to brachytherapy and can be used to construct Dose Volume Histogram using dose data file generated with external beam irradiation and patient DICOM image. Although it is necessary for the user to model and validate the irradiation source and convert the patient DICOM image in voxel structure file recognized by MCNP Monte Carlo Code. However, the user should only make com-parative studies between DVHs generated by simulation and the respective obtained using treatment planning systems if it guarantees the same volumes for organs studied.
Acknowledgements
The authors wish to thank Cecilia Khalil Haddad and Tatiana Midori of SirioLibanes Hospital for the collaboration and the financial support of the Fundação Carlos Chagas Filho de Amparo à Pesquisa do Estado do Rio de Janeiro (FAPERJ), the Coordenação de Aperfeiçoamento de Pessoal de Nível Superior (CAPES) and the Conselho Nacional de Desenvolvimento Científico e Tecnológico (CNPQ), Brazil.
References
[1] Yoriyaz, H. (2009) Monte Carlo Method: Principles and Application in Medical Physics.
Revista Brasileira de Física Médica, 3, 141-149.
[2] Reis Junior, J.P., Menezes, A.F., Souza, E.M., Facure, A. Medeiros, J.A.C. and Silva, A.X. (2012) Dose Optimization in 125I Permanent Seed Implants Using the Monte Carlo Method.
Computer Physics Communications, 183, 847-852.
http://dx.doi.org/10.1016/j.cpc.2011.12.005
[3] Pelowitz, D.B. (2005) MCNPXTM User’s Manual, Version 2.5.0. Los Alamos National
La-boratory Report LA-CP-05-0369.
[4] Boia, L.S., Menezes, A.F., Cardoso, M.A.C., et al. (2012) Application of Digital Image Processing for the Generation of Voxels Phantoms for Monte Carlo Simulation. Applied
Radiation and Isotopes, 70, 144-148. http://dx.doi.org/10.1016/j.apradiso.2011.08.017
[5] Thalhofer, J.L., Rebello, W.F., Correa, S.C.A., Silva, A.X., Souza, E.M. and Batista, D.V.S. (2013) Calculation of Dose in Healthy Organs, during Radiotherapy 4-Field Box 3D Con-formal for Prostate Cancer, Simulation of the Linac 2300, Radiotherapy Room and MAX Phantom. International Journal of Medical Physics, Clinical Engineering and Radiation
Oncology, 2, 61-68. http://dx.doi.org/10.4236/ijmpcero.2013.22009
[6] Martins, M.C., Cordeiro, T.P.V., Silva, A.X., Souza-Santos, D., Queiroz-Filho, P.P. and Huant, J.G. (2013) Dose Conversion Coefficients for ICRP 110 Voxel Phantom in the Geant4 Monte Carlo Code. Radiation Physics and Chemistry, 95, 309-312.
http://dx.doi.org/10.1016/j.radphyschem.2013.04.030
[7] Kramer, R., Vieira, J.W., Khoury, H.J., Lima, F.R.A. and Fuelle, D. (2003) All about MAX: A Male Adult Voxel Phantom for Monte Carlo Calculations in Radiation Protection Dosi-metry. Physics in Medicine and Biology, 48, 1239-1262.
http://dx.doi.org/10.1088/0031-9155/48/10/301
[8] ICRP (2009) Adult Reference Computational Phantom. International Commission on Ra-diological Protection. Pergamon Press, Oxford.
[9] Drzymala, R.E., Mohan, R., Brewster, L., et al. (1991) Dose-Volume Histograms.
Interna-tional Journal of Radiation Oncology, Biology and Physics, 21, 71-78.
[10] Pyakuryal, A., Myint, W.K., Gopalakrishnan, M., Jang, S., Logemann, J.A. and Mittal, B.B. (2010) A Computational Tool for the Efficient Analysis of Dose-Volume Histograms for Radiation Therapy Treatment Plans. Journal of Applied Clinical Medical Physics, 11, 3013- 3041.
[11] Trinidade, B.M., Chistóvão, M.T., Trindade, D. de F.M., Falcão, P.L. and de Campos, T.P.R. (2012) Comparative Dosimetry of Prostate Brachytherapy with I-125 and Pd-103 Seeds via SISCODES/MCNP. Radiologia Brasileira, 45, 1443-1450.
[12] Duggan, D.M. (2004) Improved Radial Dose Function Estimation Using Current Version MCNP Monte-Carlo Simulation: Model 6711 and ISC3500 125I Brachytherapy Sources.
Ap-plied Radiation and Isotopes, 61, 1443-1450.
http://dx.doi.org/10.1016/j.apradiso.2004.05.070
[13] Rivard, M.J. (1999) Refinements to the Geometry Factor Used in the AAPM Task Group Report No. 43 Necessary for Brachytherapy Dosimetry Calculations. Medical Physics, 26, 2445-2450. http://dx.doi.org/10.1118/1.598764
[14] Boia, L.S., Junior, J.P.R., Menezes, A.F. and Silva, A.X. (2014) Computational System to Create an Entry File for Replicating I-125 Seeds Simulating Brachytherapy Case Studies Using the MCNPX Code. International Journal of Cancer Therapy and Oncology, 2, 2445- 2450. http://dx.doi.org/10.14319/ijcto.0202.3
[15] Briesmeister, J.F. (1997) MCNP—A General Monte Carlo N-Particle Transporte Code, Version 4B. Report No. LA12625-M. Los Alamos National Laboratory, Los Alamos.
[16] Riper, K.A.V. (2004) MORITZ—Geometry Tool User’ Guide. White Rock Science, Los Alamos.
[17] Rivard, M.J., Coursey, B.M., DeWerd, L.A., et al. (2004) Update of AAPM Task Group No. 43 Report: A Revised AAPM Protocol for Brachytherapy Dose Calculations. Medical Phys-ics, 31, 633-674. http://dx.doi.org/10.1118/1.1646040
[18] Dolan, J., Li, Z. and Williamson, J.F. (2006) Monte Carlo and Experimental Dosimetry of an 125I Brachytherapy Seed. Medical Physics, 33, 4675-4684.
http://dx.doi.org/10.1118/1.2388158
[19] Taylor, R.E.P. and Rogers, D.W.O. (2008) An EGSnrc Monte Carlo-Calculated Database of TG-43 Parameters. Medical Physics, 35, 4228-4242. http://dx.doi.org/10.1118/1.2965360 [20] Nath, R., Bice, W.S., Butler, W.M., et al. (2009) AAPM Recommendations on Dose
Pre-scription and Reporting Methods for Permanent Interstitial Brachytherapy for Prostate Cancer: Report of the American Association of Physicists in Medicine Task Group 137.
Medical Physics, 36, 5310-5322. 2445-2450.
[21] Marcu, L. and Quach, K. (2006) The Role of Post-Implant Dosimetry in the Quality As-sessment of Prostate Implants. The RAH Experience. Australasian Physical and
Engineer-ing Science in Medicine, 29, 310-314. http://dx.doi.org/10.1007/BF03178396
[22] Yu, Y, Anderson, L.L., Li, Z., et al. (1999) Permanent Prostate Seed Implant Brachytherapy: Report of the American Association of Physicists in Medicine Task Group No. 64. Medical
Submit or recommend next manuscript to SCIRP and we will provide best service for you:
Accepting pre-submission inquiries through Email, Facebook, LinkedIn, Twitter, etc. A wide selection of journals (inclusive of 9 subjects, more than 200 journals)
Providing 24-hour high-quality service User-friendly online submission system Fair and swift peer-review system
Efficient typesetting and proofreading procedure
Display of the result of downloads and visits, as well as the number of cited articles Maximum dissemination of your research work
Submit your manuscript at: http://papersubmission.scirp.org/
![Table 1. Energy distribution of the fotons emitted by 125I sources [12].](https://thumb-us.123doks.com/thumbv2/123dok_us/7835665.733332/3.595.194.553.573.702/table-energy-distribution-fotons-emitted-i-sources.webp)
![Table 2. Guidelines for interpretation of the relative errors (R) obtained for MCNP [15]](https://thumb-us.123doks.com/thumbv2/123dok_us/7835665.733332/5.595.193.550.67.682/table-guidelines-interpretation-relative-errors-r-obtained-mcnp.webp)