The Effect of Baroreflex Function on Blood Pressure
Variability
Xiufang Wei, Xinhui Fang, Lina Ren, Yanyan Meng, Zixin Zhang, Yongquan Wang, Guoxian Qi
Department of Cardiology, The First Affiliated Hospital, China Medical University, Shenyang, China. Email: [email protected]
Received May 16th, 2013; revised June 19th, 2013; accepted July 1st, 2013
Copyright © 2013 Xiufang Wei et al. This is an open access article distributed under the Creative Commons Attribution License, which permits unrestricted use, distribution, and reproduction in any medium, provided the original work is properly cited.
ABSTRACT
Objective: The aim of this study was to assess the relationship of blood pressure variability (BPV) and heart rate vari- ability (HRV) to investigate the effect of baroreflex function on blood pressure variability. Methods: This study consisted of 111 subjects, including 32 normotensives and 79 hypertensives. All the subjects were given two concurrent tests: 24-hour Holter ECG and ambulatory blood pressure monitoring. According to standard deviation of normal-to-normal sinus RR intervals (SDNN) derived from the Holter ECG, the hypertensives were divided into two groups: an HRV normal group with SDNN > 100 ms and an HRV abnormal group with SDNN < 100 ms. HRV analysis used the time domain measure SDNN and two frequency domain analyses using low-frequency and high-frequency power. BPV analysis involved a formula correlated to each blood pressure value. Results: BPV was significantly higher in the HRV abnormal group compared with the HRV normal group in the hypertensives (0.018 ± 0.0033 vs 0.014 ± 0.0032, P < 0.05). In the HRV abnormal group, BPV value of the older hypertensive participants was higher than the younger par- ticipants (0.019 ± 0.0024 vs 0.017 ± 0.0037, P = 0.048). BPV and HRV were correlated in the younger hypertensives (r = −0.314, P < 0.05) and older hypertensives (r = −0.692, P < 0.001). Conclusions: Baroreflex function had effect on BPV. Factors like aging could cause damage to the baroreflex sensitivity, which in turn had influence on BPV. There may be benefits in restoration of baroreflex function to reduce BPV, especially in hypertensive patients.
Keywords: Blood Pressure Variability; Heart Rate Variability; Baroreflex Function; Hypertension
1. Introduction
The variation of blood pressure with sleep, emotional stimulation or physical activity has been recognized for many years. Continuous blood pressure monitoring has shown that the 24-hour blood pressure profile is charac- terized by a marked variability due to the large difference in daytime and nighttime blood pressure, and spontane- ous shifts in blood pressure that takes place in hour-to- hour, even minute-to-minute. Studies have shown that blood pressure variability is related to target organ dam- age, which makes blood pressure variability to be a new goal to predict the risk of cardiovascular disease [1-6]. However, the factors that are responsible for the variabil- ity of blood pressure have not been specifically clarified. Beat-by-beat analysis of blood pressure in animals has provided insight into the role of baroreflex effect on blood pressure variability. In this study, we attempted to investigate the baroreflex function on human beings, to find the effect of baroreflex function on blood pressure variability.
Previous work has shown that baroreflex activity can be studied by examining heart rate variability (HRV) [7, 8], and the activity declines with aging [9-11]. Thus, we assessed the correlation of BPV and HRV with aging.
There are several ways to express variability. The sim- plest could be the mean value and the standard deviation from the mean of all readings during a day. However, these parameters indicate only a steady distribution of blood pressure readings without reflecting time-related information. In the present study, a mathematical formula was introduced to represent hemodynamic characteristics of blood pressure.
2. Methods
2.1. Patient Population
greater than 140 mmHg, or diastolic blood pressure greater than 90 mmHg on at least three occasions, and the normotensives had been examined and had blood pressure less than 140 mmHg systolic and 90 mmHg diastolic. In the hypertensive group, there were 37 hy- pertensives who were older than 65 and 42 who were younger than 65. All subjects had either never been treated or had stopped treatment one to two weeks before the study. Subjects were excluded from the study if there was any evidence of sinus node or conduction system disease on the electrocardiogram, or if they had a history of angina pectoris, myocardio infarction, heart failure, nephropathy, chronic liver disease, diabetes mellitus, obstructtive sleep apnea, or cerebral ischemic. Subjects with a history of drug abuse and those who required other drugs affecting BP also were excluded. All patients gave informed consent to the enrollment, which was ap- proved by the Hospital Ethics Committee.
2.2. Recording Procedures
Twenty-four hour blood pressure was measured with Tonoport V (GE Medical system IT Inc., Milwaukee WI, USA) using the software CardioSoft V6.0 Software (GE Medical System IT Inc.). Analysis of the 24-hour HRV was performed using the MARS PC system (GE Health- care Inc., Milwaukee, WI, USA) with running software version 7.2. All subjects were administered 24-hour Hol- ter ECG and 24-hour ambulatory blood pressure moni- toring, and both tests were started and stopped concur- rently. The examinations were performed when the pa- tients were relaxed; they went to sleep at 22:00 and woke up at 6:00.
2.3. Baroreflex Function
Previous work have shown that HRV can be used as a noninvasive index to represent baroreflex function. The data sampled from a 24-hour Holter ECG can be ex- pressed as HRV using a time domain measure: standard deviation of normal-to-normal sinus RR intervals during a 24-hour period (SDNN), and two frequency domain analysis estimates respiratory-dependent low-frequency (LF) and high-frequency (HF) power through spectral analysis. Low-frequency power (LF: 0.04 - 0.15 Hz) was analyzed as an index of sympathetic and parasympathetic nervous system activity, and high-frequency power (HF: 0.15 - 0.4 Hz) was analyzed as an index of parasympa- thetic nervous system activity [7,12]. SDNN can be used to analyze HRV in as long a range as 24 hours. As HRV analysis in this study was applied in 24 hours, we chose to use SDNN to represent baroreflex function, and we divided the hypertensives into two groups according to SDNN: the HRV normal group with SDNN > 100 ms and the HRV abnormal group with SDNN < 100 ms. The
normotensives were screened as normal HRV with SDNN > 100 ms. In the literature, SDNN < 100 ms was considered a cutoff value of the HRV decrease [13].
2.4. Blood Pressure Variability
Noninvasive ambulatory blood pressure monitoring was set up to record BP every 30 minutes during the day and every hour at night. Mean systolic blood pressure (mSBP) and diastolic blood pressure (mDBP), and the coefficient of variability of systolic blood pressure (cvSBP) and dia-stolic blood pressure (cvDBP) were calculated. The BPV was calculated by the following formula which correlated to each blood pressure value [14,15]: N = total number of measurements, n = number of sequential measurements.
2 1
1
1 n n n
n
n
SBP SBP
BPV
N SBP
2.5. Statistical Analysis
SPSS version 17.0 (SPSS Inc., Chicago, IL, USA) was used for data analysis. All values were presented as mean and standard deviation (SD). Continuous variables were performed by Student’s t-test. A value of P < 0.05 was considered statistically significant. Linear correlation was estimated by the Pearson product-moment correla- tion coefficient.
3. Results
Baseline physical characteristics in the normotensives and the two hypertensive groups were similar. Baseline values for blood urea nitrogen, serum creatinine, triglyc- eride, total cholesterol, fasting blood glucose, and the thickness of left ventricular posterior wall were also comparable at baseline (Table 1).
Table 1. Characteristics of the study subjects and 24-h HRV and BPV indexes.
Normotensives Hypertensives
HRV abnormal group HRV normal group
No. 32 38 41
Age (yrs) 58.47 ± 7.73 61.74 ± 8.18 60.83 ± 12.48
BMI (kg/m2) 25.07 ± 3.66 26.67 ± 2.49 25.94 ± 2.91
BUN (mmol·L−1) 5.35 ± 0.85 5.67 ± 0.93 5.00 ± 1.25
Scr (umol·L−1) 58.96 ± 8.40 59.95 ± 9.99 61.95 ± 12.38
TG (mmol·L−1) 1.67 ± 0.85 1.54 ± 0.87 1.53 ± 0.55
TC (mmol·L−1) 4.89 ± 1.01 5.34 ± 0.97 5.20 ± 0.95
FBG (mmol·L−1) 5.73 ± 0.57 5.75 ± 0.70 5.96 ± 0.54
LVPW (mm) 8.19 ± 0.84 8.54 ± 1.11 8.58 ± 0.78
HRV
LF power (ms) 16.56 ± 3.32 11.57 ± 3.17a 14.77 ± 4.47
HFpower (ms) 11.56 ± 4.11 6.98 ± 2.67a 10.87 ± 3.21
SDNN (ms) 127.91 ± 16.41 84.42 ± 8.86a 126.90 ± 15.98
BPV
mSBP (mmHg) 115.36 ± 5.78b 135.14 ± 12.20 135.68 ± 10.60
mDBP (mmHg) 74.09 ± 6.24b 87.88 ± 8.01 86.56 ± 7.42
cvSBP (ratio) 0.083 ± 0.0234 0.092 ± 0.0232 0.089 ± 0.0281
cvDBP (ratio) 0.100 ± 0.0298 0.126 ± 0.0374 0.116 ± 0.0295
BPV (ratio) 0.014 ± 0.0035 0.018 ± 0.0033a 0.014 ± 0.0032
BMI = body mass index; BUN = blood urea nitrogen; Scr = serum creatinine; TG = triglyceride; TC = total cholesterol; FBG = fasting blood glucose; LVPW = left ventricular posterior wall; HRV = heart rate variability; LF = low-frequency power; HF = high-frequency power; SDNN = standard deviation of all normal sinus RR intervals during a 24-hour period; BPV = blood pressure variability; mSBP = mean systolic blood pressure in a 24-hour period; mDBP = mean dia-stolic blood pressure in a 24-hour period; cvSBP = coefficient of variation of sydia-stolic blood pressure; cvDBP = coefficient of variation of diadia-stolic blood pres-sure. aGroup HRV abnormal hypertensives versus group HRV normal hypertensives, P < 0.001; bGroup HRV normal hypertensives versus group normoten-sives, P < 0.001.
difference between the two hypertensive groups (0.126 ± 0.0374 vs 0.116 ± 0.0295, P = 0.183) (Table 1).
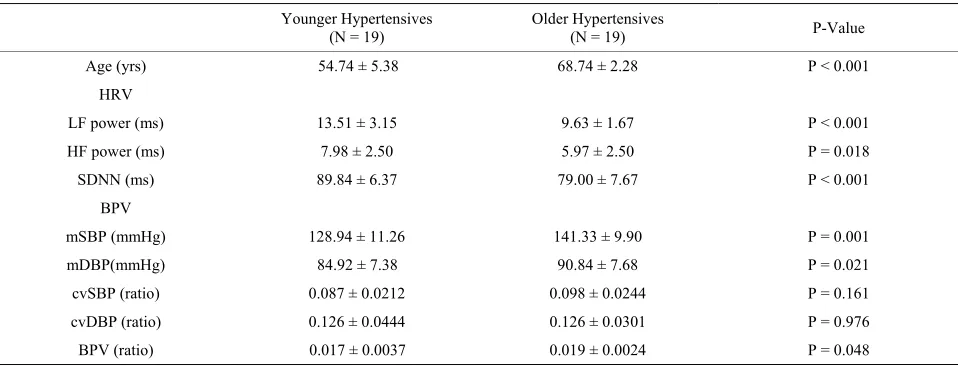
We divided the HRV abnormal hypertensives into two groups according to the cutoff value of age 65, and there was a significant difference between the younger hyper- tensives and the older hypertensives (0.017 ± 0.0037 vs 0.019 ± 0.0024, P = 0.048) (Table 2).
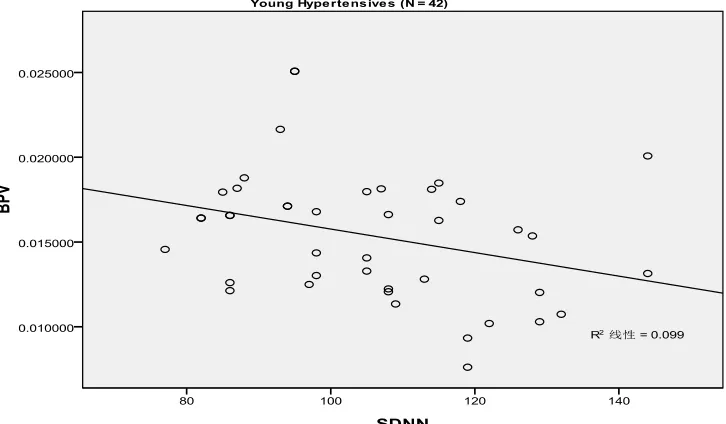
Regarding the relationship of BPV and HRV, we studied both the younger hypertensives and the older hypertensives from the hypertensive group. We con-cluded that BPV and HRV were moderately correlated in both the younger hypertensives (r = −0.314, P = 0.043) and the older hypertensives (r = −0.692, P < 0.001) ( Fig-ure 1).
4. Discussion
The purpose of the study was to examine the effect of the baroreflex function on BPV. Kathleen et al. [16]. Admin- istered nitroprusside intravenous to change their subjects’ baroreflex function, and Bartels et al. [17]. Changed the baroreflex function through exercise. In this study, we chose to use HRV to represent the baroreflex function, as
the analysis of HRV from 24-hour Holter ECG has aris- ing as a simple and non-invasive measure of the auto- nomic impulses among the techniques used in the baro- reflex function evaluation [7].Changes in the HRV pat- terns provided a sensible and advanced indicator of the baroreflex function.
In regards to the parameters that can be used to repre- sent BPV, there are several ways. According to many articles, the simplest representations could be the mean value and the standard deviation (SD) from the mean of all readings during a day or a certain time. Rothwell et al
Table 2. HRV and BPV indexes in different age groups of HRV abnormal hypertensives.
Younger Hypertensives
(N = 19) Older Hypertensives (N = 19) P-Value
Age (yrs) 54.74 ± 5.38 68.74 ± 2.28 P < 0.001
HRV
LF power (ms) 13.51 ± 3.15 9.63 ± 1.67 P < 0.001
HF power (ms) 7.98 ± 2.50 5.97 ± 2.50 P = 0.018
SDNN (ms) 89.84 ± 6.37 79.00 ± 7.67 P < 0.001
BPV
mSBP (mmHg) 128.94 ± 11.26 141.33 ± 9.90 P = 0.001
mDBP(mmHg) 84.92 ± 7.38 90.84 ± 7.68 P = 0.021
cvSBP (ratio) 0.087 ± 0.0212 0.098 ± 0.0244 P = 0.161
cvDBP (ratio) 0.126 ± 0.0444 0.126 ± 0.0301 P = 0.976
BPV (ratio) 0.017 ± 0.0037 0.019 ± 0.0024 P = 0.048
HRV = heart rate variability; LF = low-frequency power; HF = high-frequency power; SDNN = standard deviation of all normal sinus RR intervals during a 24-hour period; BPV = blood pressure variability; mSBP = mean systolic blood pressure in a 24-hour period; mDBP = mean diastolic blood pressure in a 24-hour period; cvSBP = coefficient of variation of systolic blood pressure; cvDBP = coefficient of variation of diastolic blood pressure.
In the study, we observed that in the hypertensives, BPV was elevated in the HRV abnormal group. As to the two HRV normal groups, although there were significant differences in mean systolic and diastolic blood pressure between the normotensives and the hypertensives, there was no difference in BPV. In the HRV abnormal hyper- tensives, the older hypertensives had a greater BPV value than the younger ones, which showed more variation of blood pressure. In addition, we found there was a linear correlation between BPV and HRV.
As we know, arterial blood pressure is the product of cardiac output and systemic vascular resistance, which is regulated through various local, humoral, and neural factors. Neural regulation of BP occurs via tonic and reflexive modulation of autonomic nervous system out- flow, which in turn makes the baroreflex function play a critical role on BP regulation [19]. As we observed in the study, BPV was significantly higher in the HRV abnor- mal group compared with the HRV normal group in the hypertensives. Comparing the two HRV normal groups, although the hypertensives had a greater mean value of systolic and diastolic blood pressure than the normoten- sives, the BPV showed no difference. Thus we concluded that baroreflex dysfunction, not hypertension itself, has an impact on the BPV. Correspondingly, Mancia et al.
[20]. observed that baroreflex mechanisms account for a fraction of the overall difference in BPV and Imai et al.
[21]. Suggested that decreases in the cardiovagal-baro- reflex function contribute to an increase in BPV. Laitinen
et al [22]. Demonstrated that a sympathovagal balance of cardiovascular regulation was the major determinant of BPV.
Many studies have demonstrated that aging is associ- ated with decreased cardiovagal-baroreflex sensitivity.
Vagally-modulated HRV continues to decline with ad- vancing age [9-11]. This is further supported by our finding that the mean value of BPV was significantly higher in the HRV abnormal group of the older hyper- tensives than the younger hypertensives. The BPV and HRV correlation degree also supported the influence that aging had on baroreflex function, with a correlation coef- ficient of minus 0.314 in the younger hypertensives and minus 0.692 in the older hypertensives. BPV had a stronger correlation with HRV in the older hypertesives with more damage of the baroreflex sensitivity due to aging. Considering how the baroreflex function acts on the BPV, a restoration of baroreflex function to reduce BPV may be beneficial especially in the hypertensives. A series of articles focusing on the baroreflex function ob-served that exercise training, weight loss, high sodium, and non-exposure to smoking could improve the barore- flex modulation [23-25]. These tools could all be used as nondrug treatments in the therapy of hypertension.
The linear correlation of blood pressure variability and standard deviation of all normal sinus RR intervals during a 24-hour period (SDNN) in the younger hypertensives (r = −0.314, P = 0.043).
[image:5.595.118.481.90.302.2]The linear correlation of blood pressure variability and standard deviation of all normal sinus RR intervals during a 24-hour period (SDNN) in the older hypertensives (r = −0.692, P < 0.001).
Figure 1. The relationship of blood pressure variability (BPV) and heart rate variability (HRV) were moderately correlated in both the younger hypertensives (r = −0.314, P = 0.043) and the older hypertensives (r = −0.692, P < 0.001).
value. Therefore, this question could be considered in future studies.
5. Conclusion
In summary, in this study baroreflex function does have effect on BPV. The damage of baroreflex function can cause greater variability of blood pressure. Factors like aging could cause damage to the baroreflex sensitivity, which in turn had influence on BPV.
REFERENCES
[1] D. F. Su and C. Y. Miao, “Blood Pressure Variability and Organ Damage,” Clinical and Experimental Pharmacol- ogy and Physiology, Vol. 28, No. 9, 2001, pp. 709-715. doi:10.1046/j.1440-1681.2001.03508.x
& Gynecology and Reproductive Biology, Vol. 144, No. 1, 2009, pp. 179-183. doi:10.1016/j.ejogrb.2009.02.037 [3] M. Cymerys, A. Miczke, W. Bryl, M. Kujawska-Luczak,
P. Bogdański and D. Pupek-Musialik, “Circardian Rhythm and Variability of Blood Pressure and Target Organ Dam- age in Essential Hypertension,” Polskie Archiwum Medy- cyny Wewnętrznej, Vol. 108, 2002, pp. 625-631.
[4] N. A. Zakopoulos, G. Tsivgoulis, G. Barlas, C. Papami- chael, K. Spengos, E. Manios, I. Ikonomidis, V. Kotsis, I. Spiliopoulou and K. Vemmos, “Time Rate of Blood Pres- sure Variation Is Associated with Increased Common Ca- rotid Artery Intima-Media Thickness,” Hypertension, Vol. 45, 2005, pp. 505-512.
doi:10.1161/01.HYP.0000158306.87582.43
[5] A. Frattola, G. Parati, C. Cuspidi, F. Albini and G. Man- cia, “Prognostic Value of 24-Hour Blood Pressure Value,” J Hypertens, Vol. 11, No. 10, 1993, pp. 1133-1137. doi:10.1097/00004872-199310000-00019
[6] D. Sander and J. Klingelhöfer, “Diurnal Systolic Blood Pressure Variability Is the Strongest Predictor of Early Carotid Atherosclerosis,” Neurology, Vol. 47, No. 2, 1996, pp. 500-507. doi:10.1212/WNL.47.2.500
[7] L. C. Vanderlei, C. M. Pastre, R. A. Hoshi, T. D. Car- valho and M. F. Godoy, “Basic Notions of Heart Rate Variability and Its Clinical Applicability,” Revista Bra-sileira de Cirurgia Cardiovascular, Vol. 24, No. 2, 2009; pp. 205-217. doi:10.1590/S0102-76382009000200018 [8] E. von Borell, J. Langbein, G. Després, S. Hansen, C. Le-
terrier, R. Marchant-Forde, M. Minero, E. Mohr, A. Pru- nier, D. Valance and I. Veissier, “Heart Rate Variability as a Measure of Autonomic Regulation of Cardiac Activ- ity for Assessing Stress and Welfare in Farm Animals: A Review,” Physiology & Beavior, Vol. 92, No. 3, 2007, pp. 293-316. doi:10.1016/j.physbeh.2007.01.007
[9] K. D. Monahan, “Effect of Aging on Baroreflex Function in Humans,” American Journal of Physiology-Regulatory, Integrative and Comparative Physiology, Vol. 293, No. 1, 2007, pp. 3-12. doi:10.1152/ajpregu.00031.2007
[10] R. E. De Meersman and P. K. Stein, “Vagal Modulation and Aging,” Biological Psychology, Vol. 74, No. 2, 2007, pp. 165-173. doi:10.1016/j.biopsycho.2006.04.008 [11] C. Fukusaki, K. Kawakubo and Y. Yamamoto, “Assess-
ment of the Primary Effect of Aging on Heart Rate Vari- ability in Humans,” Clinical Autonomic Research, Vol. 10, No. , 2000, pp. 123-130.
doi:10.1007/BF02278016
[12] L. T .Mainardi, “On the Quantification of Heart Rate Variability Spectral Parameters Using Time-Frequency and Time-Varying Methods,” Philosophical Transactions of the Royal Society A, Vol. 367, 2009, pp. 255-275. [13] R. L.Sun, N. Wu, S. H.Yang, Z. Y. Lu, L. N. Guo, J. S.
Qu, Y. L .Huang, W. H. Qi and W. P. Jiang,, “The Clini- cal Application Suggestions of Heart Rate Variability De- tection,” Chinese Journal of Cardiology, Vol. 4, 1998, pp. 252-255.
[14] O. Tochikubo, N. Miyazaki, Y. Yamada and M. Fukuoka, “Mathematical Evaluation 24-h Blood Pressure Variabil- ity in Young, Middle-Aged and Elderly Hypertensive
Pa-tients,” Japanese Circulation Journal, Vol. 51, No. 10, 1987, pp. 1123-1130. doi:10.1253/jcj.51.1123
[15] Y. Nishioka, H. Sashika, N. Andho and O. Yochikubo, “Relation between 24-h Heart Rate Variability and Blood Pressure Fluctuation during Exercise in Stroke Patients,”
Circulation Journal, Vol. 69, No. 6, 2005, pp. 717-721. doi:10.1253/circj.69.717
[16] K. McGarry, M. Laher, D. Fitzgerald, J. Horgan, E. O’Brien and K. O’Malley, “Baroreflex Function in Elderly Hy- pertensives,” Hypertension, Vol. 5, 1983, pp. 763-767. doi:10.1161/01.HYP.5.5.763
[17] M. N. Bartels, S. Jelic, P. Ngai, G. Gates, D. Newandee, S. S. Reisman, R. C. Basner and R. E. De Meersman, “The Effect of Ventilation on Spectral Analysis of Heart Rate and Blood Pressure Variability during Exercise,”
Respiratory Physiology & Neurobiology, Vol. 144, No. 1, 2004, pp. 91-98. doi:10.1016/j.resp.2004.08.002
[18] P. M. Rothwell, S. C. Howard, E. Dolan, E. O’Brien, J. E. Dobson, B. Dahlöf, N. R. Poulter and P. S. Sever, “AS-COT-BPLA and MRC Trial Investigators. Effects of β Blockers and Calcium-Channel Blockers on Within-Indi- vidual Variability in Blood Pressure and Risk of Stroke,”
Lancet Neurology, Vol. 9, No. 5, 2010, pp. 469-480. doi:10.1016/S1474-4422(10)70066-1
[19] D. L. Eckberg and P. Sleight, “Human Baroreflexes in Health and Disease,” Clarendon Press, Oxford, 1992. [20] G. Mancia, G. Parati, G. Pomidossi, R. Casadei, M. Di
Rienzo and A. Zanchetti, “Arterial Baroreflexes and Blood Pressure and Heart Rate Variabilities in Humans,” Hy- pertension, Vol. 8, 1986, pp. 147-153.
doi:10.1161/01.HYP.8.2.147
[21] Y. Imai, A. Aihara, T. Ohkubo, K. Nagai, I. Tsuji, N. Mi- nami, H. Satoh and S. Hisamichi, “Factors That Affect Blood Pressure Variability: A Community-Based Study in Ohasama, Japan,” American Journal of Hypertension, Vol. 10, No. 11, 1997, pp. 1281-1289.
doi:10.1016/S0895-7061(97)00277-X
[22] T. Laitinen, J. Hartikainen, L. Niskanen, G. Geelen and E. Länsimies, “Sympathovagal Balance Is Major Determi- nant of Short-Term Blood Pressure Variability in Healthy Subjects,” American Journal of Physiology-Heart and Cir- culatory Physiology, Vol. 276, 1999, pp. 1245-1252. [23] S. Goulopoulou, T. Baynard, R. M. Franklin, B. Fernhall,
R. Carhart, R. Weinstock and J. A. Kanaley, “Exercise Training Improves Cardiovascular Autonomic Modula- tion in Response to Glucose Ingestion in Obese Adults with and without Type 2 Diabetes Mellitus,” Metabolism Clinical and Experimental, Vol. 59, No. 6, 2010, pp. 901- 910. doi:10.1016/j.metabol.2009.10.011
[24] Y. Akehi, H. Yoshimatsu, M. Kurokawa, T. Sakata, H. Eto, S. Ito and J. Ono, “VLCD-Induced Weight Loss Im- proves Heart Rate Variability in Moderately Obese Japa- nese,” Experimental Biology and Medicine, Vol. 226, 2001, pp. 440-445.
[25] J. Erblich, D. H. Bovbjerg and R. P. Sloan, “Exposure to Smoking Cues: Cardiovascular and Autonomic Effects,”