http://dx.doi.org/10.4236/ojmetal.2013.34010
The Comparative Study of the Temperature Distribution of
Fiber Laser with Different Pump Schemes
Mostafa Abouricha1*, Abdelkader Boulezhar1, Nabil Habiballah2* 1Hassan II Casablanca University, Faculty of Sciences-Ain Chok,
Laboratory of Theoretical and Applied Physics, Casablanca, Morocco
2Chouaib Doukkali University, Faculty of Science, Laboratory of Condensed Matter of Physics, El Jadida, Morocco
Email: *[email protected], *[email protected]
Received August 6,2013; revised September 6, 2013; accepted October 13, 2013
Copyright © 2013 Mostafa Abouricha etal. This is an open access article distributed under the Creative Commons Attribution Li- cense, which permits unrestricted use, distribution, and reproduction in any medium, provided the original work is properly cited.
ABSTRACT
Based on the structure of the long fiber laser (YDCFLs) with different pump schemes using high pump power, the nonlinear coupled and heat dissipation equations are solved numerically. Using the finite-difference method, we have determined the temperature distribution along the radial and axial directions of the fiber laser (YDCFLs) for the forward pump schemes of 200 W with reflection Rp2, backward pump schemes of 200 W with reflection Rp1 and for bidirectional pump scheme of 100 W each side. The results are: the temperature distribution for bidirectional pump mode is more even than that for forward pump with reflection Rp2 and than that for backward pump with reflection Rp1. The results show that the maximum temperature difference between different schemes is 57.51˚C, and when the air-clad width de- creases, the temperature in the core regions also decreases and does not affect to the cladding radius regions. We summa- rize that the temperature in the core and in cladding radius regions decreases when the outer radius cladding increases.
Keywords: Pump Scheme; High Power Fiber Laser; Temperature Distribution
1. Introduction
The double-clad fiber laser (DCFLs) have several appli- cations in modern telecommunication, medical instru- ments, military, defense and material surface processing, because of some unique advantages including high con- version efficiency, excellent beam quality, less thermal effect [1-3]. The continuous wave emission up to kW- level has been reported [4,5]. A new type of photonic crystal fibers (PCFs) has opened numerous axes in re- search; this is due to its unique properties such as end- lessness.
Thermal effect in Single mode guiding in high-power fiber laser has attracted much attention in recent days [6, 7]. Also, the developments of cladding-pumped fiber technology and high brightness semiconductor diode pump lasers enabled have been used to save energy [8]. The evolution of the temperature and the influence of the core, inner-clad, air-clad and outer clad, on the shape of optical fiber have been studied [9].
Numerically, Shang [8] has investigated the output power characteristics of YDCFLS with different pump
schemes, finding the bidirectional pump scheme is com- patible with the backward with Rp1 = 0 and forward pump scheme with Rp2 = 0. However, the backward pumped YDCFL with Rp1 = 0.98 has the highest conver- sion efficiency; while the forward pumped YDCFL with
Rp2 = 0.98 has maximum output power per meter.
In this paper, we have investigated numerically the theoretical and numerical analysis of 2D Temperature field by solving the transient heat conduction equations comparing in detail the temperature distributions in the backward pump schemes with Rp1, forward pump schemes with Rp2 and bidirectional pump scheme. The results show that the maximum temperature in the two-end pump is 96.89˚C, in the forward pump is 148.4˚C and in the backward pump is 154.4˚C. Thus, the temperature distributions for two-end pump mode is more even than that for forward pump with reflection Rp2 = 0.98 and backward pump with reflection Rp1 = 0.98 mode.
2. Theoretical Analysis
Figure 1. Schematic demonstration of ytterbium-doped dou- ble-clad fiber laser.
are assumed to be narrow spectra and regarded as single wavelength, ignoring the non linear effects and influ- ences of amplified spontaneous emission on the inverse population. Using the rate-equation theory under the steady state conditions, we can be governed the propagations of the light wave power in fiber cavity as follows [7]:
, , , , pp ap ep b ap yt
p p p
P x t
N x t N
x
P x t P x t
(1)
, , , , ss as es b as yt
s s s
P x t
N x t N
x
P x t P x t
(2)
, , , , , , , , , , , bp p ap
yt b p p
co
p p ap p p ap
yt b
co co
yt b p p
p p ap
yt b p p
co b N x t
t
N N x t P x t P t
hcA
N N x t
hcA hcA
N N x t P x t P t
N N x t P x t P t
hcA N x t
,
(3)Equations (1)-(3), Nyt is the concentration of Yb3+, Nb(x,t) is the upper laser level population density,
and represent the power of forward and backward propagation pump light, respectively. and represent the power of forward and backward propagation laser power, respectively. Γp
and Γs are power filling factors. σas and σes are the laser
absorption and emission cross section, σap and σep are the
pump light absorption and emission cross-section respec-
, p P x t
, s P x t
, p P x t
, s P x ttively. τ is the lifetime of Yb3+ in upper level, α p and αs
represent scattering loss coefficients of laser light and pump light respectively. The above Equations (1)-(3) at fiber front (x = 0) and fiber rear end (x = L) satisfy the boundary conditions for the laser as follows:
0 1
0 ,
2
s s s s s s
P R P P L R P L
(4)Where Rs1 = 0.98 and Rs2 = 0.04 the power laser re- flectively of the reflector at x = 0 and x = L, respectively. And the boundary conditions for the pump propagation equation can be expressed as follows [8]:
0 01,
2p p p p p
P P P L R P
L (5)
02,
0 1p p p p p
P L P P R P
0 (6)
0 01,
02p p p p
P P P L P , (7) Where Pp01 the launched pump power into the front end (x = 0) and Pp02 the launched pump power into the back end (x = L). Rp2 and Rp1 represent the reflectivity at pump wave length in forward and backward pumped fiber laser, respectively.
In the YDCF, heat is generated in the fiber core, and this heat is transferred from the fiber core to the inner clad by thermal conduction, and by thermal conduction and radiation to air-clad, in air clad no convection be- cause the width air-clad is very small, which justified by Grashof number Grδ in air clad given by [10] and by ther-
mal conduction and radiation to other clad, and dissi- pated from the fiber surface to ambient air by convective and radiative heat transfer. Therefore the transverse tem- perature distributions in the YDCF at room temperature are governed by following thermal conductive equations in symmetric cylindrical coordinates [11].
k T
Q x
(8) Then we find:
1
1
1 T r Q x , 0
r r
r r r k
a (9)
2
1
1 T r 0,
r a
r r r
r b
(10)
3
1
1 T r 0,
r b
r r r
r b2
(11)
4
2
1 T r 0,
r b
r r r
tion of the fiber core. Which mainly depends on the scat- tering and loss of pump light and given by:
2
, ,
1
p p
x P x t P x t
Q x S
a
(13)Where
x
x p,
x is absorption co-efficient, and S is the quantum efficiency whose theo- retical value is λp/λs. However, it cannot reach the theo-
retical value in practical applications. In Other regions of the fiber, the value of Q(x) is zero. Supposing perfect thermal connection among the cladding and inner core, the temperature and their derivatives are continuous at the boundary (r = a), therefore, the boundary conditions can be expressed as follows [12]:
For r = 0 we have:
1 0, T r r (14)
For r we have:
1 2 ,
T r T r T r1
T r2
,r r
(15)
For r b 1 we have:
4
2 3 4
1 2 3
2 1 3 1
,
c
T r T r
k k T T
r r
T b T b
r (16)
For r b 2 we have:
4
3 4 4
2 3 1
3 2 4 2
,
c
T r T r
k T T r k
r r
T b T b
(17)
In Figure 2, we have demonstrates the temperature difference between the ambient air and the fiber surface is determined by the convective and radiation heat flow, and thus the boundary condition cross the fiber other cladding and the ambient air is given by the Newton’s law and the Stefan-Boltzmann law [13].
4
4 4
4 4
2
,
c
r b c c
T r h
T T b T T b
r k
(18)
Where k2 is the thermal conductivity of air, k1 is the thermal conductivity of material, Tc is the temperature of
ambient air, ε is the emissivity, σ is the Stefan-Boltzman constant and hc is the convective coefficient which can be
calculated by [14].
13
2 , 2 ,
c c
a
gab T T T T
Gr a R GrP
v
r, (19)
2 1 6
9 16 8 27 0.387
0.60
[image:3.595.317.532.83.298.2][1 0.556 ] a u r R N P
Figure 2. Heat dissipation model of PCF [9].
1 0.5 u ,
h N b (21) Where Nu, Pr and Gr are Nusselt, Prandtl numbers and
Grashof, respectively. g and ν are the acceleration and Kinematic viscosity, the temperature in regions core, inner clad, air-clad and other clad can be derived by us- ing Equations (9)-(12) subject to the boundary conditions (14)-(17) as follows:
2
1 0
1
, if 0 4
Q x r
T r T r a
k
(22)
2 2 2 0 1 1 ln , if 4 2 r Q x aQ x a a
T r T a r b
k k
1
(23)
2 4 4 13 2 1 2 1
2 2
1 2
1
2
ln , if
c
Q x a b
T r T b T T b
k k
r b r b
b (24)
2 4 4 2 14 3 2 2 1
1 2 2
4 4
2
3 2 2
1 2
2
ln , if
c
c
Q x a
k b
T r T b T T b
k k k
b r
T T b b r b
k b (25)
(20)
Where T0 represents the temperature of fiber axis (r = 0). Using Equations (22)-(25) subject to boundary condi- tion (18), the relationship between the temperature of fiber surface T4(b) and the ambient air Tc is given by
[image:3.595.65.290.269.483.2]
2
4 4
4 4
2 1 2
2 1 3 2
1 2 2 1
2
4 4
4 4
2 1 2
2 2 2 1 3 2
2 1 2 2 1
2
4 2 1 4
3 2 2 1
1 2 2
2
ln 2
2
c c
c
c c c
c c
Q x a
k b b
T T b T T b
k k k k
Q x a
h k b b b
T T b T T b T T b
k k k k k
Q x a
k b
T T b T T b
k k k
2 b
44 2 4 4
3 2
1 2
ln
c
b b
T T b
k b
(26)
reached is 177.7 W for the length l = 10.1 m and it is reaches the value 174.7 W for l = 10 m in the bidirec- tional pump scheme. Therefore, the forward pump with reflection is in good scheme to minimize the length of YDCF and the backward pump with reflection is the most suitable scheme to minimize the pumping energy. Substituting Equation (26) into Equations (22)-(25),
we can obtain the temperature distributions in fiber core and other regions.
3. Simulation and Discussion
In our simulation, we have used the Common parameters given in the Table 1. Figure 3 illustrates the output power as a function of fiber length (YDCL) for different pump schemes. It is shown that the increasing output power reaches the maximum value 174.7 W, for length l
= 5 m in the forward pump scheme with reflection Rp2 = 0.98. In the backward pump scheme with reflection Rp1 = 0.98 the value reached is 178.7 W for the length l = 6.4 m, the maximum value 171.7 W, for length l = 7.4 m in the forward pump scheme with reflection Rp2 = 0, in the backward pump scheme with reflection Rp1 = 0, the value
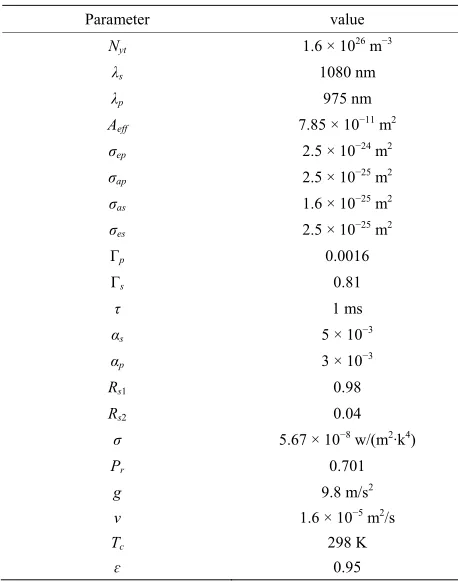
The heat dissipation along axial, calculated by using Equation (13) and the axial distribution of temperature (r
= 0) for different pump schemes have reported, respec- tively in Figures 4 and 5.
[image:4.595.111.534.88.207.2]It is shown that the maximum temperature for the bidirectional pump scheme Tmax = 90.89˚C is lower than that for the forward pump with (reflection Rp2 = 0.98 and Rp2 = 0) as Tmax = 148.4˚C and than that the backward with (reflection Rp1 = 0.98 and Rp1 = 0) as Tmax = 154.4˚C. The maximum difference is 57.51˚C.
Table 1. Common Parameters Used in the Simulation.
Parameter value
Nyt 1.6 × 1026 m−3
λs 1080 nm
λp 975 nm
Aeff 7.85 × 10⁻¹¹ m2
σep 2.5 × 10⁻²⁴ m2
σap 2.5 × 10⁻²⁵ m2
σas 1.6 × 10⁻²⁵ m2
σes 2.5 × 10⁻²⁵ m2
Гp 0.0016
Гs 0.81
τ 1 ms
αs 5 × 10⁻³
αp 3 × 10⁻³
Rs1 0.98
Rs2 0.04
σ 5.67 × 10⁻⁸ w/(m2·k4)
Pr 0.701
g 9.8 m/s2
ν 1.6 × 10⁻⁵ m2/s
Tc 298 K
ɛ 0.95
[image:4.595.56.285.446.737.2]The difference between the maximum and the mini-mum is: 40.14˚C in the case of bi-directional pumping, 109.19˚C in the case of pumping forward with Rp2 = 0.98, 115.38˚C in the case forward with Rp2 = 0, 115.19˚C in the case backward with Rp1 = 0.98 and 121.12˚C in the case back with Rp1 = 0. Therefore, the reflectivity of the pump has a role crucial is to minimize the temperature difference.
[image:4.595.310.537.519.697.2]Figure 4. Evolution of heat power density along the fiber in forward pump with Rp2 = 0.98, backward pump with Rp1 =
0.98, forward pump with Rp2 = 0, backward pump with Rp1
[image:5.595.60.288.323.499.2]= 0 and bi-directional pump mode.
Figure 5. Temperature distribution along the fiber in for- ward pump with Rp2 = 0.98, forward pump with Rp2 = 0,
backward pump with Rp1 = 0.98, backward pump with Rp1 =
0 and bi-directional pump mode.
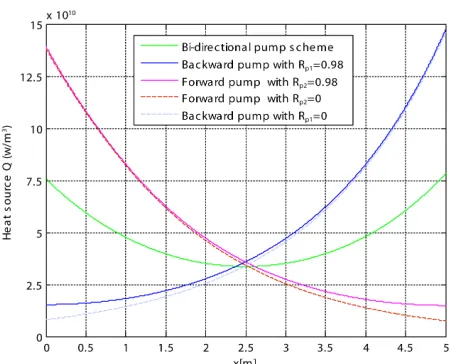
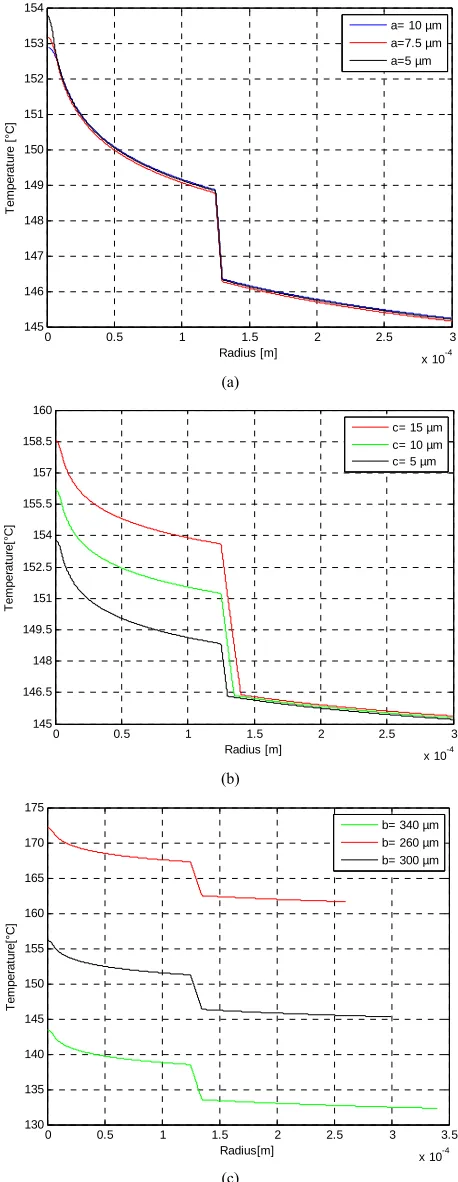
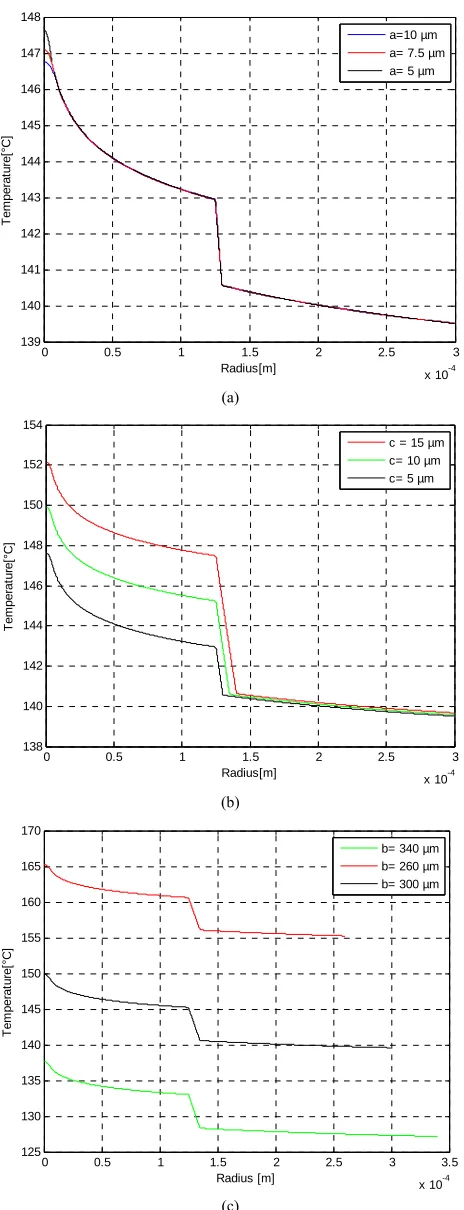
The radial distribution of the temperature is reported in Figures 6-10 as function of core radius for different pump schemes. Consequently, the effect of the radius core is negligible and the maximum temperature differ- ence between a = 5 and a = 10 µm does not exceed 1˚C in (r = 0) for different pump schemes Figures (a). But in Figures (b), we have shown that the temperature distri- butions at the fiber in (r = 0) increases when the air-clad increases for different pump schemes. In Figures (c), we can see another scenario as the temperature of the fiber increases when the outer cladding radius increases.
4. Conclusion
In this paper, we have compared in detail the heat dissi-
0 0.5 1 1.5 2 2.5 3
x 10-4 90.5
91 91.5 92 92.5 93 93.5 94 94.5 95 95.5
Radius [m]
T
em
perat
ur
e
[°C]
a=10 µm a= 7.5 µm a=5 µm
(a)
0 0.5 1 1.5 2 2.5 3
x 10-4 90
91 92 93 94 95 96 97 98
radius [µm]
T
em
perat
ur
e[
°C
]
c= 15 µm
c= 10 µm c= 5 µm
(b)
0 0.5 1 1.5 2 2.5 3 3.5
x 10-4 80
85 90 95 100 105 110
Radius [m]
T
e
m
p
erat
u
re
[
°C
]
b= 340 µm b=260 µm b= 300 µm
(c)
0 0.5 1 1.5 2 2.5 3
x 10-4 145
146 147 148 149 150 151 152 153 154
Radius [m]
T
e
m
p
era
ture
[
°C
]
a= 10 µm a=7.5 µm
a=5 µm
(a)
0 0.5 1 1.5 2 2.5 3
x 10-4 145
146.5 148 149.5 151 152.5 154 155.5 157 158.5 160
Radius [m]
T
e
m
p
er
at
u
re
[°C
]
c= 15 µm c= 10 µm c= 5 µm
(b)
0 0.5 1 1.5 2 2.5 3 3.5
x 10-4 130
135 140 145 150 155 160 165 170 175
Radius[m]
T
e
m
per
at
ur
e[
°C
]
b= 340 µm b= 260 µm b= 300 µm
[image:6.595.311.538.80.679.2](c)
Figure 7. Temperature distributions in the Backward pump with Rp1 = 0. At (a) The fiber axis output side for different
core radius; (b) The fiber input side for different air-clad- ding width; and (c) The fiber output side for different clad- ding radius.
0 0.5 1 1.5 2 2.5 3
x 10-4 146
147 148 149 150 151 152 153 154 155
Radius [m]
T
e
m
p
er
a
tur
e
[
°C
]
a= 10 µm a= 7.5 µm a= 5 µm
(a)
0 0.5 1 1.5 2 2.5 3
x 10-4 146
148 150 152 154 156 158 160
Radius [m]
T
em
per
a
tur
e[
°C
]
c= 15 µm
c= 10 µm c= 5 µm
(b)
0 0.5 1 1.5 2 2.5 3 3.5
x 10-4 130
135 140 145 150 155 160 165 170 175
Radius[m]
T
e
m
per
at
ur
e[
°C
]
b=340 µm b= 260 µm b=300 µm
(c)
Figure 8. Temperature distributions in the Backward pump with Rp1 = 0.98 at (a) The fiber axis output side for different
[image:6.595.57.286.85.676.2]0 0.5 1 1.5 2 2.5 3
x 10-4 139
140 141 142 143 144 145 146 147 148
Radius[m]
T
em
p
erat
ure[
°C]
a=10 µm a= 7.5 µm a= 5 µm
(a)
0 0.5 1 1.5 2 2.5 3
x 10-4 138
140 142 144 146 148 150 152 154
Radius[m]
T
em
per
at
ur
e[
°C
]
c = 15 µm
c= 10 µm c= 5 µm
(b)
0 0.5 1 1.5 2 2.5 3 3.5
x 10-4 125
130 135 140 145 150 155 160 165 170
Radius [m]
T
e
m
p
er
at
u
re
[°C
]
b= 340 µm b= 260 µm
b= 300 µm
[image:7.595.310.538.79.677.2](c)
Figure 9. Temperature distributions in the forward pump with Rp1 = 0 at (a) The fiber axis input side for different core
radius; (b) The fiber input side for different air-clad width; and (c) The fiber input side for different cladding radius.
0 0.5 1 1.5 2 2.5 3
x 10-4 140
141 142 143 144 145 146 147 148 149
Radius[m]
T
e
m
per
at
ur
e[
°C
]
a= 10 µm a=7.5 µm a=5 µm
(a)
0 0.5 1 1.5 2 2.5 3
x 10-4 140
142 144 146 148 150 152 154
Radius [m]
T
e
m
p
er
at
u
re[
°C
]
c= 15 µm c= 10 µm c= 5 µm
(b)
0 0.5 1 1.5 2 2.5 3 3.5
x 10-4 125
130 135 140 145 150 155 160 165 170
Radius[m]
T
e
m
p
er
at
ur
e[
°C
]
b= 340 µm b= 260 µm b= 300µm
(c)
Figure 10. Temperature distributions in the Forward pump with Rp1 = 0.98 at (a) The fiber axis input side for different
[image:7.595.57.289.80.685.2]pation and the temperature distribution for different pumps schemes. The results show that the temperature distribu- tion for bidirectional pump mode is more even than that the forward pump with reflection Rp2 and backward pump with reflection Rp1. These two latter schemes are in agreement for saving pump powers and YDCF length. Moreover, the forward pump with Rp1 = 0.98 and the backward pump with Rp2 = 0.98 in less length resulting in high output power are thermally acceptable. Further ex- perimental and theoretical studies are needed to explain the temperature distribution of fiber laser with different pump schemes.
REFERENCES
[1] J. Limpert, A. Liem, H. Zellmer and A. Tunnerman, “500 W Continuous-Wave Fiber Laser with Excellent Beam Quality,” Electronics Letters, Vol. 39, No. 8, 2003, pp. 645-647. http://dx.doi.org/10.1049/el:20030447
[2] Y. Wang and C.-Q. Xu, “Modeling and Optimization of Q-Switched Double-Clad Fiber Laser,” Applied Optics, Vol. 45, No. 9, 2006, pp. 2058-2071.
[3] R. Paschotta, J. Nilsson, A. C. Tropper and D. C. Hanna, “Ytterbium-Doped Fiber Amplifiers,” IEEE Journal of Quantum Electronics, Vol. 33, No. 7, 1997, pp. 1049- 1056. http://dx.doi.org/10.1109/3.594865
[4] Y. Jeong, J. K. Sahu, D. N. Payne, et al., “Ytterbium- Doped Large-Core Fiber with 1.36 KW of Continuous- Wave Output Power,”Optics Express, Vol. 12, No. 25, 2004, pp. 6088-6092.
http://dx.doi.org/10.1364/OPEX.12.006088
[5] D. Gapont, “Quasi-Single-Mode Fiber Laser Nears 2 kW Output with High-Quality Beam,” Laser Focus World, Vol. 41, No. 6, 2005, pp. 9-11.
[6] S. Baek, D. B. S. Soh, Y. Jeong, J. K. Sahu, J. Nilsson and B. Lee, “Acladding-Pumped Fiber Laser with Pump- Reflecting Bragg Grating,” IEEE Photonics Technology Letters,Vol. 16, No. 2, 2004, pp. 407-409.
http://dx.doi.org/10.1109/LPT.2003.823135
[7] I. Kelson and A. Hardy, “Srongly Pumped Fiber Lasers,”
IEEE Journal of Quantum Electronics, Vol. 34, No. 9, 1998, pp. 1570-1577. http://dx.doi.org/10.1109/3.709573
[8] L. Shang, “Comparative Study of the Output Characteris- tics of Ytterbium-Doped Double-Clad Fiber Lasers with Different Pump Schemes,” Optik, Vol. 122, No. 21, 2011, pp. 1899-1902.
[9] J. F. Li, “Theoretical Analysis of the Heat Dissipation Mechanism in High Power Photonic Crystal Fiber Laser,”
Optik, Vol. 121, No. 13, 2010, pp. 1243-1250.
http://dx.doi.org/10.1016/j.ijleo.2009.01.015
[10] W. M. Rohsenow, J. P. Hartnett and Y. I. Cho, “Hand- book of Hear Transfer,” McGraw-Hill, New York, 1998. [11] B. David, “Therma, Stress, and Thermo-Optic Effects in
High Average Power Double-Clad Silica Fiber Lasers,”
IEEE Journal of Quantum Electronics, Vol. 37, No. 2, 2001, pp. 207-217.
[12] J. F. Li, “Theoretical Analysis and Heat Dissipation of Mid-Infrared Chalcogenide Fiber Raman Laser,” Optics Communications, Vol. 284, No. 5, 2011, pp. 1278-1283.
http://dx.doi.org/10.1016/j.optcom.2010.10.062
[13] P.-X. Li and C. Zhu, “Theorecal and Experimental Inves- tigation of Thermal Effects in a High Power Yb3+-Doped Double-Clad Fiber Laser,”Optics and Laser Technology, Vol. 40, No. 2, 2008, pp. 360-364.
http://dx.doi.org/10.1016/j.optlastec.2007.06.011

![Figure 2. Heat dissipation model of PCF [9].](https://thumb-us.123doks.com/thumbv2/123dok_us/7942394.750932/3.595.317.532.83.298/figure-heat-dissipation-model-pcf.webp)