CLASSIFICATION OF BRAINWAVE USING DATA MINING
IN PRODUCING AN EMOTIONAL MODEL
1
NURSHUHADA MAHFUZ, 2WAIDAH ISMAIL, 2ZALISHAM JALI, 2KHAIRUL ANUAR, 3MD JAN NORDIN
2Dr Waidah Ismail, Faculty of Science and Technology, USIM, Bandar Baru Nilai. 2
Dr Zalisham Jali, Faculty of Science and Technology, USIM, Bandar Baru Nilai
2Dr Khairul Anuar, Faculty of Quran and Sunnah, USIM, Bandar Baru Nilai.
2Assc Prof Dr Md Jan Nordin, Faculty of Technology Information and Science, UKM, Bandar Baru Bangi.
E-mail: [email protected], 2{waidah, zalisham, khairul anuar}@usim.edu.my
*Corresponding author: +6 06 7988056; email: [email protected]
ABSTRACT
In this paper, classification of brainwave using real world data from Parkinson’s patients is presented. Emotional model is produced from the classification of brainwave. Electroencephalograph (EEG) signal is recorded on eleven Parkinson’s patients. This paper aim to find the “best” classification for the emotional model in brainwave patterns for the Parkinson’s disease. The work performed based on the two method phases which are using the raw data and pre-processing data. In each of the method, we performed for steps in the sum of the hertz and divided by total hertz. In the pre-processing data we are using statistic mean and standard deviation. We used WEKA Application for the classification with 11 fold validation. As a results, implecart from the classification tree performed the “best” classification for the emotional model for Parkinson Patients. The Simplecart classification result is 84.42% accuracy.
Keywords:Classification, Brainwave, Emotional Model, Parkinson Patients
1. INTRODUCTION
Classification of Emotional Model is the goal to find the “best” classification performed in WEKA Application. In this study, we performed for Parkinson Patients which recently, scientists realized that human brain was relevant to human emotion, and it leaded to studying of human emotion and feeling by using information from brain, including brainwave. As a result, the medical doctor using Electroencephalography (EEC) as a medical measurement technique. By the measuring the electrical potentials caused by activation of the neurons in the brain, through electrodes allocated on the scalp, information about the neurological processes in the brain, can be extracted. The author Plutchik proposed categorized emotional model, in which the eight basic emotions are defined as follows : anger, sadness, disgust, surprise, anticipation, acceptance and joy [1].
EEG can record the changes of brainwave that reflects the emotional of the patients [2, 3]. Each of the brainwave types represents the dominant of the patients. For example if in Delta it show that the situation where adults show wave sleep in babies. Moreover, EEG has high speed, non-invasive and causes no pain to the patients. As the same time, it can be recorded and analysis which can be compared to other medical imaging techniques [4, 5]. Today, it is likely that the study of the wave emitted by the brain, known as brainwave, might be the key to diagnose the health status of a status of a person and the kind of disease that a person might be suffering from, which includes Parkinson’s Disease [6], Attention-Deficit/ Hyperactivity Disorder (ADHD) [7], International Affective Picture System (IAPS) [8].
We are using the two methods which are
performing raw data after medical doctor has filtering the noise and performing fase Fourier transform (FFT). Another method was performed as pre-processing were required four steps which are calculate based line, finding the range of stand deviation and convert into range in standard deviation. The conclusion of this paper, show that SimpleCart in the WEKA gave the “best” classification and consistency for all the phases for the emotional model for Parkinson Patients.
This paper is organized as follows: in the rest of this section we detail the motivation behind our paper; in section 2 we describe previous work in the area, section 3 details our proposed methodology which explain on the two work process. Followed by section 4 in which we discuss the results. Lastly, in section 5 we draw conclusions and discuss future research.
1.1 Brainwave
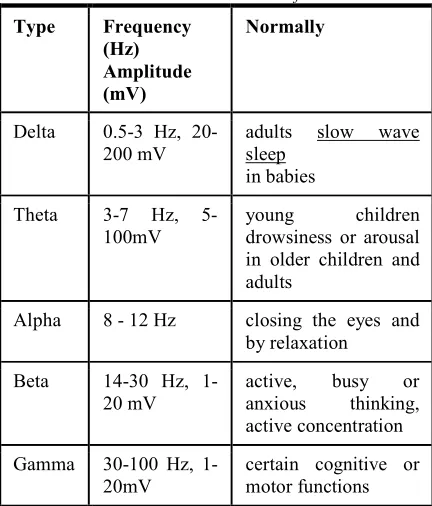
[image:2.595.81.297.462.715.2]Brainwave, by definition, is the rapid fluctuations of voltage between parts of the cerebral cortex that are detectable with an electroencephalograph device (EEG). In the brain, there are four basic types of waves that can be distinguished. Each of these waves can be a dominant wave in a period of time.
Table 1. Brain Wave Classification
Type Frequency (Hz) Amplitude (mV)
Normally
Delta 0.5-3 Hz, 20-200 mV
adults slow wave sleep
in babies
Theta 3-7 Hz, 5-100mV
young children drowsiness or arousal in older children and adults
Alpha 8 - 12 Hz closing the eyes and by relaxation
Beta 14-30 Hz, 1-20 mV
active, busy or anxious thinking, active concentration
Gamma 30-100 Hz, 1-20mV
certain cognitive or motor functions
Each wave is identified by amplitude and in interval of frequencies [10]:
a) Beta waves are in the frequency range of 12-30 Hz. The waves are small and fast, associated with focused concentration and best defined in a central and frontal areas. When resisting of with suppressing movement, of solving a math task, there is an increase in Beta activity. b) Alpha waves, ranging from 7.5 to 12 Hz, are
slower and associated with relaxation and disengagement. Thinking of something peaceful with eyes closed should give an increase in alpha activity.
c) Theta waves, ranging from 3.5 to 7.5 Hz, are linked to inefficiency, daydreaming, and the very lowest waves of theta represent the fine line between being awake or in a sleep state. Theta arises from emotional stress, especially frustration or disappointment.
d) Delta waves, ranging from 0.5 to 3.5, are the slowest waves and occurs when sleeping.
1.2 Parkinson Disease
Parkinson's disease (PD) is also known as primary parkinsonism or hypokinetic rigid syndrome is a degenerative disorder of the central nervous system. The motor symptoms of Parkinson's disease result from the death of dopamine-generating cells in the substantia nigra, a region of the midbrain; the cause of this cell death is unknown [11]. Basically, what causes Parkinson’s to develop in the first place is still a mystery, but scientists know that the disease process begins when the brain becomes deficient of a neurotransmitter called dopamine. With diminishing amounts of dopamine, a person with Parkinson’s will develop several motor symptoms such as movement disorders, tremors, and rigidity [12].
Early in the course of the disease, the most obvious symptoms are movement-related; these include shaking, rigidity, slowness of movement and difficulty with walking and gait. Later, cognitive and behavioural problems may arise, with dementia commonly occurring in the advanced stages of the disease, whereas depression is the most common psychiatric symptom. Other symptoms include sensory, sleep and emotional problems. Parkinson's disease is more common in older people, with most cases occurring after the age of 50.[12]
case of Parkinson’s disease will disrupt the
cortico-basal ganglia-thalamocortical circuits, leading to pathologically exaggerated beta oscillations [15]. In short, as Parkinson’s disease is a disorder that closely related to the neural and nervous system, therefore by observing the brain wave activity of a person using EEG we can diagnose if that person have possible motor symptoms of Parkinson’s Disease. For instance, as explained above, a person with an exaggerated beta wave emitted by the brain most probably is suffering from Parkinson’s disease.
2. PREVIOUS WORK
The research of this paper to find the “best” classification in the brainwave using WEKA. We also performed a few testing using raw data and pre-processing data. In this era, classification is widely used in pattern recognition, which includes a number of information processing problems from speech recognition and the classification of handwritten characters to fault detection in technology and medical diagnosis. WEKA is a data analysis software tool which implements a set of machine learning algorithms for data mining tasks [16].
In this study, we performed EEG into Parkinson patients, but this is not limited into medical study. There is a study on the Music Emotion Research where the goal is to quantify and explain how music influences our emotional states. They using MIDI songs in each subject with Higuchi algorithm. As for conclusion in their study familiar songs can improve accuracy of valence classification and unfamiliar songs usage can improve accuracy of arousal classification in all subjects [17]. Another study also on emotional model for music that using EEG, in which to know the mood of the patients by observing the brainwave patterns. In this study, they are using WEKA implementation which are linear regression and C.4.5 [18].
Another possible approach of brainwave classification by [19] had computed six statistical features (Mean, standard deviation, the mean of the absolute values of the first differences of the raw signals, the means of the absolute values of the first differences of the normalized signal, the means of the absolute values of the second difference of the raw signals, the means of the absolute values of the second differences of the normalized signals) from EEG data and the highest classification rate at 95%. In author [20], had also studied on classifying emotions from EEG signals brainwave using two
simple patter classification methods K Nearest neighbor (KNN) and Linear Discriminant Analysis (LDA) for classifying emotions.
In this study, we performed the comparison between raw data and pre-processing data. In the pre-processing data we used statistical data. We are using real world data from Parkinson patients. Enter the text here
3. METHODOLOGY AND DATA SETS
In this section will explain the work process, method and data sets. In the method will show how the calculation based line, finding the range of standard deviation, converts into range in standard deviation.
3.1 Work Process
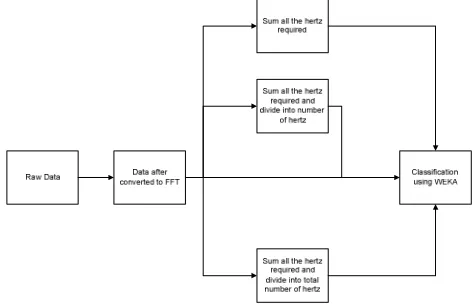
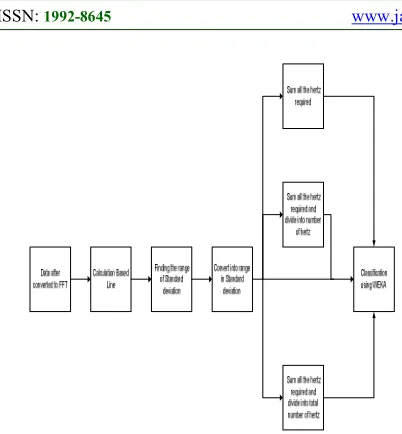
[image:3.595.316.554.559.711.2]In this paper highlighted, the two phases of work process. The first phases have four type of testing which are the raw data, the sum of the hertz based on Delta, Theta, Alpha and Beta as shown in table 1. The third types are the sum of the hertz and divided the total of hertz and lastly the sum of the hertz and divided the sum of the hertz. The second phases of work process, we performing statistical method in calculating baseline, standard deviation and mean as per-processing. Then we performed same as the first phases which has four types of testing. Then use WEKA to find the “best” classification. This is only a preliminary study to find the “best” classification for Emotional Model for Parkinson.
Fig 2: Second Phase Work Process In Classification Of Brainwave
3.1 Method
In the following sections we present the methods that we have used in this paper.
Step 1:- Data gathering
The data from Parkinson collected from Faculty of Medicine, USIM. The brainwave was collected from the frontier of the head.
Step 2:- Design Model for raw data.
The emotional model will be tested for finding the relevant in using the four types of testing.
Step 3:- Pre-processing
The collection of data will be removed with all unclean data which we performed manually show in the Fig 2.
Step 4:- Design Model for Pre-Processing The emotion model will be tested for finding the relevant, intelligent classifier using pre-processing data.
Step 5:- Classification
The emotion model will be classified based on table 1 using WEKA Application. We did not use Gamma because the data only on cognitive and motor function which is not reliable for Parkinson patients.
3.2.1 Pre-processing
In the pre-processing, we performed two methods which are statistical method and classification.
3.3.2 Statistical method
In the statistical method we used three steps which are finding baseline, standard deviation and ensure the range in the standard deviation. As for the finding baseline, the medical doctor will determine the baseline. All the data will convert into baseline in Eq (1). The lacking of the process, the baseline cannot be counted and lose of information. The main (ρ) will be found in new data (Τ) based on the second in Eq(2). The standard deviation (σ) is to ensure the new data (Τ) are in the range based on the Eq(4). If the new data (Τ) are not in the range of the Eq(4) then the new data(Τ) will be changed in to (σ).
baseline into
converted after
data the of Mean
-baseline into
converted after
data new
-doctor) medical by (choose baseline
-data raw
-ρ
Τ j x
100
× − = Τ
j j x
(1)
∑ =
Τ
= N
i i
N 1
1
ρ (2)
∑
= Τ −Τ
= N
i i
N 1
1
σ (3)
) 5 . 1 * ( )
5 . 1 *
(σ ≤Τ≥ρ+ σ −
p (4)
Otherwise ,
if , 1 Τ=
σ
Τ =
[image:4.595.335.511.475.718.2]3.3.3 Classification
In the classification, we performed pre-processing which consistsof four phases in finding the “best” classification in WEKA. This is only a preliminary study. In the future, the classification will be developed in Matlab. In the testing part we classification raw data ( x ) and new data ( T ) after pre-processing. The second testing, we perform the sum of the Hertz, the third part the sum and divided by the number of Hertz and last part by summing all the hertz and divided by the total Hertz.
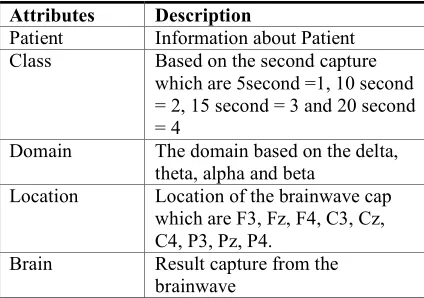
3.3.4 Attribute
[image:5.595.83.295.392.541.2]In the attribute we used as shown in the table 2 that used in WEKA. The brain attribute is changed for of the sum of the Hertz, sum and divided by the number of Hertz and sum all the hertz and divided by the total hertz.
Table 2. Attribute Classification
Attributes Description
Patient Information about Patient Class Based on the second capture
which are 5second =1, 10 second = 2, 15 second = 3 and 20 second = 4
Domain The domain based on the delta, theta, alpha and beta
Location Location of the brainwave cap which are F3, Fz, F4, C3, Cz, C4, P3, Pz, P4.
Brain Result capture from the brainwave
3.4 Data Set
EEG data were recorded from eleven Parkinson’s patients after undergoing non-invasive magnetic stimulation, a form of therapy to alleviate the motor symptoms of Parkinson’s. in order to look at the acute effects of the stimulation, we analyzed the EEG data recorded 20 seconds post-stimulation. The data set were taken from the medical faculty of Universiti Sains Islam Malaysia (USIM), Pandan Indah, Kuala Lumpur. The raw data has been converted into Fast Fourier Transform (FFT) using Brainwave software.
4. RESULTS
This section shows all the results for classification with 11 fold cross validation and the choosing domain in hertz in WEKA.
4.1 Method 1
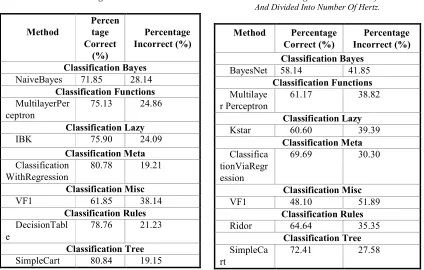
In this experiment, we performed the raw data and sum of the frequency (hertz). In the table 3 show the result of raw data and table 4 shows all the results on the sum of the hertz performed all the classifier in the WEKA. Table 5, result in WEKA for the sum of the hertz and divided into number of hertz. And lastly table 6, result in using WEKA for sum of the hertz and divided into total of hertz.
From the result, it show that result overall from Table 3 until Table 6 the “best” result from the SimpleCart method under classification tree. The data from raw data produced the highest result among others with 80.84% percentage of correct and follow by sum of herts and divided into total of hertz which is 76.83%. Then sum of the hertz and divided into number of hertz which is 72.54 and lastly sum of the hertz which is 57.50%.
Fig1 and Fig2 show the information output from the SimpleCart information. From the Fig1, it show that we have 11880 data with 5 attributes show in the Table 1 and using 11 fold cross validation. From the Fig2 show that the tree is interpreted using the If-Then rules:
If (Hertz < 1.4741) If (hertz < 0.3835
If (location = F3 or Fz or F4) If (hertz < 0.14565
If (hertz < 0.10456) then Beta If (hertz >= 0.10455) Location = Fz Patient < 351
If class = (20 second or 15 second or 10 second) then Beta else
Checking other patients
Table 3. Result In Using WEKA For Raw Data
Method
Percen tage Correct
(%)
Percentage Incorrect (%)
Classification Bayes
NaiveBayes 71.85 28.14
Classification Functions
MultilayerPer ceptron
75.13 24.86
Classification Lazy
IBK 75.90 24.09
Classification Meta
Classification WithRegression
80.78 19.21
Classification Misc
VF1 61.85 38.14
Classification Rules
DecisionTabl e
78.76 21.23
Classification Tree
SimpleCart 80.84 19.15
Table 4. Result In Using WEKA For Sum Of The Hertz
Method Percentage Correct (%)
Percentag e Incorrect
(%)
Classification Bayes
NaiveBayes 44.31 55.68
Classification Functions
SimpleLogi stic
46.02 53.97
Classification Lazy
Kstar 43.37 56.62
Classification Meta
RotationFor rest
56.18 43.81
Classification Misc
VF1 43.24 56.75
Classification Rules
Decision Table
51.19 48.89
Classification Tree
SimpleCart 57.70 42.29
Table 5. Result In Using WEKA For Sum Of The Hertz And Divided Into Number Of Hertz.
Method Percentage Correct (%)
Percentage Incorrect (%) Classification Bayes
BayesNet 58.14 41.85
Classification Functions
Multilaye r Perceptron
61.17 38.82
Classification Lazy
Kstar 60.60 39.39
Classification Meta
Classifica tionViaRegr ession
69.69 30.30
Classification Misc
VF1 48.10 51.89
Classification Rules
Ridor 64.64 35.35
Classification Tree
SimpleCa rt
72.41 27.58
Table 6. Result In Using WEKA For Sum Of The Hertz And Divided Into Total Of Hertz
Method Percentage Correct (%)
Percentage Incorrect
(%) Classification Bayes
Naivebayes Simple
63.57 36.42
Classification Functions
Logistics 72.22 27.77
Classification Lazy
Kstar 69.63 30.36
Classification Meta
Classificati onViaRegress ion
79.29 20.70
Classification Misc
VF1 59.94 43.05
Classification Rules
Ridor 70.77 29.22
Classification Tree
[image:6.595.86.508.446.701.2]Fig1: Information Output
Fig 2: Information Output
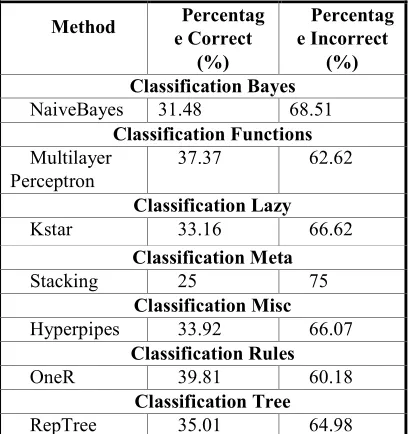
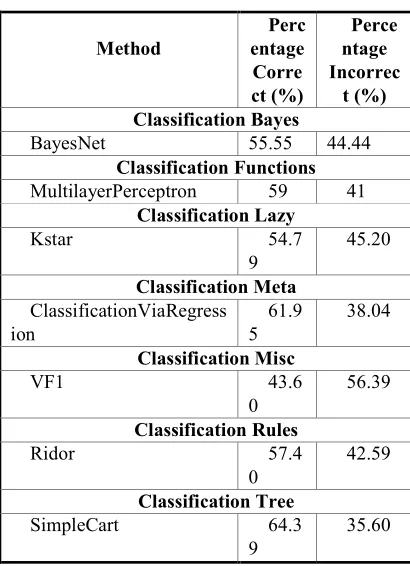
4.2Method 2
[image:7.595.305.509.305.522.2]In this experiment, we performed statistical method such as finding baseline, standard deviation and ensure the range in the standard deviation. As for the finding baseline, the medical doctor will determine the baseline. The baseline will not be used in the pre-processing using WEKA. From the experiment, it show that SimpleCart is the “best” classification in WEKA in all the types testing expect in sum of the hertz which is stacking.
Table 7. Result In Using WEKA For Pre-Processing Data
Method
Perce ntage Correct
(%)
Percentag e Incorrect
(%)
Classification Bayes
BayesNet 62.40 37.57
Classification Functions
MultilayerPerceptro n
62.75 37.25
Classification Lazy
Kstar 61.21 38.78
Classification Meta
RotationForrest 62.91 37.08
Classification Misc
VF1 20.12 79.87
Classification Rules
Jrip 62.79 37.74
Classification Tree
SimpleCart 62.79 37.20
Table 8. Result In Using WEKA For Sum Of The Hertz For Pre-Processing Data
Method Percentag e Correct
(%)
Percentag e Incorrect
(%) Classification Bayes
NaiveBayes 31.48 68.51
Classification Functions
Multilayer Perceptron
37.37 62.62
Classification Lazy
Kstar 33.16 66.62
Classification Meta
Stacking 25 75
Classification Misc
Hyperpipes 33.92 66.07
Classification Rules
OneR 39.81 60.18
Classification Tree
RepTree 35.01 64.98
Table 9. Result In Using WEKA For Sum Of The Hertz And Divided Into Number Of Hertz For Pre-Processing
Data.
Method Percentag e Correct
(%)
Percentag e Incorrect
(%) Classification Bayes
BayesNet 32.15 67.84
Classification Functions
RBFNetwor ks
33.50 66.49
Classification Lazy
Kstar 27.86 72.13
Classification Meta
Classificatio nViaRegressio
[image:7.595.87.508.585.756.2]n
Classification Misc
Hyperpipes 25 75
Classification Rules
Ridor 39.56 60.43
Classification Tree
[image:8.595.83.517.86.579.2]SimpleCart 47.39 52.60
Table 10. Result In Using WEKA For Sum Of The Hertz And Divided Into Total Hertz For Pre-Processing Data.
Method
Perc entage Corre ct (%)
Perce ntage Incorrec
t (%) Classification Bayes
BayesNet 55.55 44.44
Classification Functions
MultilayerPerceptron 59 41
Classification Lazy
Kstar 54.7
9
45.20
Classification Meta
ClassificationViaRegress ion
61.9 5
38.04
Classification Misc
VF1 43.6
0
56.39
Classification Rules
Ridor 57.4
0
42.59
Classification Tree
SimpleCart 64.3
9
35.60
4.3 Confusion matrix
The confusion matrix that helps detailed analysis than accuracy. Accuracy is not a reliable metric for the real performance of a classifier, because it will yield misleading results if the data set is unbalanced (that is, when the number of samples in different classes vary greatly). The utilized confusion matrix consists of TP (True Positive), TN (True Negative), FP (False Positive) and FN (False Negative) values, as shown in Table 11. Sensitivity is the calculation of the actual correctly identified instances, while Specificity the calculation of correctly identified negatives. Eq 6 and Eq 7 show the calculation on the sensitivity and specificity. The result of the confusion matrix show in Table 12 which highlighted that SimpleCart in Classification Tree
[image:8.595.86.291.256.539.2]produce the “best” result in the classification but not in the confusion matrix which the sensitivity are less than 80% except Beta. In the specificity are more than 100%. The next stages will target the sensitivity in Delta, Theta, Alpha and Beta more than 90%.
Table 11. Confusion Matrix
Prediction
Actual
True
Positive (TP)
True
Negative
(TN)
False
Positive (FP)
False
Negative
(FN)
Number positive
true of Number
positive true of Number
+ =
y
Sensitivit (6
)
Number negative
true of Number
negative true
of Number
+ =
y
Specificit (7
)
Table 12. Confusion Matrix For Simplecart.
Delta Theta Alpha Beta
Specificity 97.76 94.06 93.73 91
Sensitivity 76.01 66.10 55.66 97.20
Precision 79.00 63.11 64 94.18
Accuracy 95.58 90.33 87.39 94.71
5. CONCLUSION
we will further our study to find the emotional
of the Parkinson patient and develop into Matlab software.
REFRENCES:
[1] Plutchik, R. (2003). Emotions and life: perspectives from psychology, biology and evolution. American Psychological Association, Washington, DC, 1st edition, 383.
[2] Teplan, Michal, (2002), “Fundamentals of EEG
measurement.” Measurement Science Review
(2.2).
[3] Ishino, Keisuke, and Masafumi Hagiware, (2003), “A feeling estimation system using a simple electroencephalograph.” Systems, Man and Cybernetics, 2003. IEEE International
Conference on. Vol.5.IEEE
[4] Yuen, Chai Tong, San, Woo San, Seong, Tan Ching, Mohamed Rizon (2009), “Classification of Human Emotions from EEG Signals using Statistical Features and Neural Network”
International Journal of Integrated
Engineering, 1.3.
[5] Hede, Simon Christian, 2010, “Signal Detection in EEG Brainwaves-a classification based approach.” Diss. Technical University of Denmark, DTU, DK-2800 Kgs. Lyngby, Denmark.
[6] Noh, N.A., “Direct electrophysiological
evidence of human cortical oscillations after continuous theta-burst stimulation.” Magstim TMS summer school, University of Oxford, UK.
[7] Hogg J., Cavet J., Lambe L., Smeddle M. (2001). “The use of ‘Snoezelen’ as multisensory stimulation with people with intellectual disabilities: a review of the research.” Research in Developmental Disabilities, 22.5, 353. [8] Rogasch, N. C., & Fitzgerald, P. B., (2012).
“Assessing cortical network properties using TMS-EEG : Human Brain Mapping.” 34.7, 1652-1669, July 2013.
[9] Heraz, Alicia, and Claude Frasson.(2007) "Predicting the Three Major Dimensions of the
Learner's Emotions from
Brainwaves." International Journal of
Computer Science 2.3 (2007).
[10] Zhang, Y., Llinas, R. R., & Lisman, J. E., (2009). “Inhibition of NMDARs in the Nucleus Reticularis of the Thalamus Produces Delta
Frequency Bursting.” Front Neural Circuits,
3.20.
[11] Feinson. M., Kreinin. B., Chistyakov. A., & Klein. E., (1998). “Preliminary evidence for a benefical magnetic stimulation in patients with
major depression and schizophrenia.”
Depression and anxiety, 7(2), 65-68.
[12] Levy, R., Hazrati, L. N., Herrero, M. T., Vila, M., Hassani, O. K, Mouroux, M., (1997). “Re-evaluation of the functional anatomu of the basal ganglia in normal and Parkinsonian
states.” Neurosciecne, 76(2), 335-343.
[13] Brown, P. (2003), Oscillatory nature of human basal ganglia activity: relationship to the
pathophysiology of Parkinson’s disease. Moy
Disord, 18(4), 357-63.
[14] Jenkinsen,. N., & Brown, P. (2011), New insights into the relationship between dopamine,
beta oscillations and motor function. Trends
Neurosci, 34(12), 611.
[15] Moran, R. J., Malet, N., Litvak, V., Dolan, R. J., Magil, P. J., Friston, K. J., & Brown, P. (2011), Alterations in brain connectivity underlying
beta oscillations in Parkinson, PLos
Computational Biology 7(8), e1002124.
[16] Mark Hall, Eibe Frank, Geoffrey Holmes, Bernhard Pfahringer, Peter Reutemann and Ian H. Witten., (2009), “The Weka Data Mining Software: An Update.” SIGKDD Explorations, 11.1
[17] Nattapong Thammasan, Ken-ichi Fukui, Koichi Moriyama, Masayuki Numao. (2014), EEG-Based Emotiona Recognition during Music Listening, The 28th Annual Conference of the Japanese Society for Artificial Intelligence, 12-15 May 2014, Japan.
[18] Rafael Cabredo, Roberto Legaspi, Paul Salvador Inventado, Masayuki Numao (2012). Emotional Modal For Music Using Brainwave, 13th International Society For Music Information Retrieved Conference (ISMIR), 8-12 October, Porto, Portogal.
[19] Yuen, Chai Tong, “Classification of human emotions from EEG signals using statistical features and neural network.” International
Journal of Integrated Engineering 1.3(2011).