ENERGY-EFFICIENT SUB-CLUSTERING WITH OPTIMIZED
PROCESSOR SPEED (ESOPS) IN WIRELESS SENSOR
NETWORKS
G.RAJESH ,DR.B.VINAYGASUNDARAM
ANNA UNIVERSITY, Department of Information Technology,M.I.T campus , Chennai, Tamilnadu, India
E-mail: [email protected] , 2 [email protected]
ABSTRACT
A wireless sensor network consists of sensor nodes to monitor the physical and environmental conditions. In certain applications like habitat monitoring, where sensor nodes are randomly deployed in manually inaccessible environment that operates with a limited battery power. This battery constraint reduces the network lifetime. The sensor nodes consist of a micro-processor for sensing, computation and communication purposes. The node processor consumes more energy when operated at higher speeds. Varying the processor speed (by adjusting the processor speed and voltage through operating system) improves energy efficiency but reduces the performance of the processor. Hence a proper trade-off is required between energy efficiency and performance. In order to achieve this, here proposed is an Energy-efficient Sub-clustering with Optimized Processor Speed (ESOPS) algorithm. This algorithm is simulated in Omnett++ 4.0 and parameters like energy gain, energy loss, performance gain and performance loss of the system under different processor voltage and processor speed are measured and analysed.
Keywords: Dynamic Voltage Scaling, Energy Efficiency, Wireless Sensor Networks, sub clustering Optimal Processor Speed.
1. INTRODUCTION
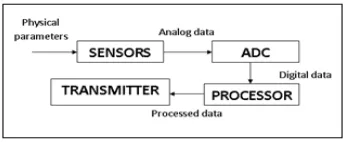
[image:1.595.324.498.459.530.2]Wireless Sensor Networks are ubiquitous, thereby meeting the growing need for automation. Wireless Sensor Networks consists of small sensing and processing units called the sensor nodes which are deployed in the sensor field. A sensor node does the tasks such as capturing the events through sensors, digitizing the analog signals which is later processed by the processing unit and sent to the sink. These nodes sense the environment's physical phenomena such as temperature, pressure, light and convert analog data into digital signals which is forwarded to the sink as described by Akyilditz et al(2002) .As seen in Figure 1, the sensor node consists of radio transceiver, which transmits and receives data, micro-processor/ micro-controller, which performs various processing on the data, Analog-to-Digital Converter (ADC) for digitizing the analog data sensed and battery for power supply.
Figure 1:Sensor Node Architecture
2. RELATED WORK
There has been a considerable research performed during the last few years to reduce energy consumption in energy-constrained devices which is of major concern in wireless sensor networks. We discuss few related work in this section to provide an overview of the state of the art, focusing on the research that is the most relevant to the work reported in this paper.
Hyung and Byung (2010) has presented a novel method to simultaneously schedule processor voltage and control-task periods online, considering energy-efficiency of control systems as a whole. A new performance index is proposed, which contains both control performance and processor energy terms. Then, an online scheduler assigning processor voltage and control-task periods that maximized the performance index.
Wei et al(2010) proposed a task-driven feedback dynamic voltage scaling algorithm based on the multi-hop routing and topology changes which could scale the working frequency and voltage levels dynamically based on the workload of the sensor node. Simulation results indicated that the improved algorithm reduced almost 30% of energy consumption and prolonged the network lifetime significantly.
A Dynamic Voltage Scaling (DVS) approach with adjustment to sampling period of control task is presented by Wenhong Zhao et al(2011) and Anton et al.(2009) where sampling period is dynamically adjusted in every execution period of the control task for achieving energy efficiency. Control tasks are periodic tasks that leaves only small window of idle processor times. Sending a processor to inert mode and waking it up requires large number of wasted processor execution cycles. DVS is to lower both core frequency and voltage to reduce processor power consumption whenever a microprocessor is underutilized as described by Woo-Cheol, Taewhan (2005) and Rex et al(2000).
Zhou (2011) proposed an Energy Efficient clustering Algorithm Based on Neighbours (EECABN) for wireless sensor networks.In this algorithm, an optimized weight of nodes is introduced to determine the priority of clustering procedure; strong
nodes have more opportunity to become cluster heads. As an improvement, weight is the measure of energy and degree as usual, and even associates with distance from neighbours, distance to the sink node, and other factors. The simulation results show that the algorithm can effectively prolong the network lifetime.
Amit and Anantha (2001) a Power-aware methodology to reduce node energy consumption by exploiting both sleep state and active power management. Dynamic Power Management (DPM) works on the principle that if the energy and performance overheads in sleep state transition were negligible, a simple greedy algorithm made the system to enter the deepest sleep state when idling.
Hence, ensuring energy efficiency is of prime concern in sensor networks. The approach of using decreased processor speed for execution of tasks certainly gives way for saving energy in processor. The effect of decreasing the processor speed is reflected in decreased throughput of tasks. Thus, there is a requirement of fulfilling both energy efficiency and better performance of the processor in the sensor node. This trade-off has been identified and solution has been provided for optimized working of the processor that is described in the following section.
3. PROPOSED WORK
A new distributive voltage scaling approach called Energy efficient Sub-clustering with Optimized Processor Speed (ESOPS) is proposed focusing on minimizing the energy expenditure and improving the performance in wireless sensor networks.
3.1 Assumptions
In this work, it is assumed that the sensor network is static and has a dense deployment of sensor nodes so that in a subcluster of three nodes, even when one node sleeps, the coverage is not affected because of dense deployment of sensor nodes. It is also assumed that sensor nodes consists of processor which has adjustable processor frequencies and supply voltage as discussed by Mark et al (2011).
Clustering is the process of grouping together the nodes in the neighbourhood to form a cluster with required level of granularity which was elaborated by Jungsoo and Younghoo(2010) , based on certain criteria like the residual energy of the nodes, the distance of the nodes from the sink and many other factors. Each cluster has a cluster head (CH).From the work of Maznah et al(2010) ,its assumed that the cluster heads are elected based on maximum weight . Cluster members do not transmit their gathered data directly to the sink but to their respective cluster-head. Accordingly, cluster-heads are responsible for coordinating the cluster members, aggregating their sensed data, and transmitting the aggregated data to the remote sink, directly or via multi-hop transmission mode as inferred from Jun Zhang and Xiaohuajia (2010). Since cluster-heads receive many packets it consumes a lot of power for long-range.
The Clustering algorithm that is used here is based on EECABN proposed by Zhou Wei(2011). This is an enhanced version of Low Energy Adaptive Cluster Hierarchy Protocol(LEACH) which is surveyed by Heinzelman et al (2000). In the EEACBN approach, weight of any node Wi is calculated using the formula:
∑
∈ − = B j j E E R j i i h h i E i W ) , max( ) , ( 1 ) ), ( max( ) ( ) ( max max ε α ε(1)
WhereW(i) is the weight E(i) is the residual energy
h(i) is the distance to the sink node, R is the neighbour range of i, B is the set of neighbours for node i,
node j is one of the neighbours within neighbour range from node i ,
d(i,j) is the distance from node i to neighbour j, hmax is the longest distance from the sink node to the farthest node in the whole network,
Emax is the highest node energy level.
ε is a constant constrains the lower limit of ratio
of max
E
E
jor h(i), while a node has very low
residual energy or very short distance to the sink node.
In EECABN all the CHs form a chain among themselves and only one CH nearest to
base station sends data to this base station. This chain is started from the farthest CH from base station and ending at CH nearest to base station. Each CH gets data from its previous CH in the chain, aggregates its own data and sends it to its next CH in the chain. This cluster algorithm is modified and used in the proposed approach considering the parameters such as residual energy and distance of the node from the base station.
3.3 Sub-Clustering
[image:3.595.347.512.377.528.2]The primary clusters are then divided in such a way that three near-by nodes are grouped together in all the clusters to form a three-some sub-cluster. Sub-clustering is done to ensure that the energy dissipation of the sensor nodes is uniform. Using the weight calculation of the above algorithm, a node with maximum weight is selected and two nearest neighbours are grouped together to form the sub-cluster. There may be even pairs of nodes forming the sub-cluster.
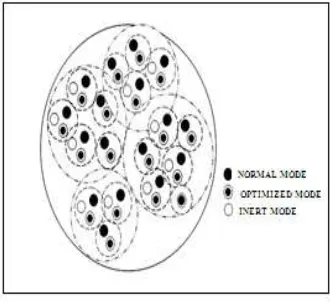
Figure 2:Operational States In Sub-cluster
3.3.1 Operational states of the sub-cluster In this work, we propose several modes of operation for processor such as Inert, Normal Operation and Optimized Operation mode as shown in Figure 2. These modes focus on increasing energy efficiency and thereby improving performance. After grouping, each of the nodes is made to operate in any of the following modes either focusing at energy efficiency or performance or both.
Inert mode: To achieve energy efficiency, energy consuming components like radio and processor may be switched off.
maximum speed. No Voltage or frequency scaling is done in this mode.
Optimized operation mode: To achieve both, energy efficiency and performance, optimal values for processor speed is selected and the processor consumes lesser energy with better performance.
Each operation mode or state is aimed at either minimizing energy dissipation or performance or both. The scheme takes into account, the sampling period and the processor speed of the micro-processor in the sensor nodes as mentioned by Jing et al (2010). These states are assigned in rotation so that each node works in a distributive manner with balanced energy dissipation. After a predetermined time, the nodes in the cluster, switches its states so that their energy consumption is at a balance. The time for which switching is arbitrarily chosen. One of the three nodes of the sub cluster is in normal operation mode where the processor in the sensor node works in its maximum frequency. Another node is made to work in optimized operation mode which runs the Optimizing Processor Speed (OPS) Scheduling algorithm for achieving both, energy efficiency and increased performance of the processor. The third node is in inert mode plays a major role in energy conservation process resulting in energy efficiency as seen from Xu and Christos (2010).
3.4 Optimizing Processor Speed
The energy efficient working of the processor can be ensured through the use of technique called Dynamic voltage Scaling (DVS). It is known that energy is directly proportional to
power (P) and processor switching time (T).
T
P
E
=
×
(2) Equation for energy stored in the processor is
E
=
CV
2 (3) Hence from equation (2) and (3), the power consumption (P) of the processor is proportional to the square of the supply voltage and the processor frequency as given in (4)Pα V 2 f
(4) Thus when processor frequency is reduced, energy is saved but the processor works at a slower pace. Most microprocessor systems are characterized by a time-varying computational load. Simply reducing the operating frequency of the processor during periods of reduced activity results in linear decrease in power consumption but does not affect the total energy consumed per task. In Dynamic power management (DMP) described by Anit and Anantha (2001) where the
sensor node is shut down if no events occur. Such event-driven power consumption is critical to maximum battery life.The tasks of the sensor node have been identified, and the possibility of conserving energy in the processor is explored below. The energy consumption E of the processor for a sample is derived from the work
of Wei et al(2001) :
2 0
0 0
2
2 2
t t
s ref
V r V r
E CV T f r r
V V
= + + +
Where
C is the average switched capacitance per cycle; Ts is the sample period;
fref is the operating frequency at Vref,
r is the normalized processing rate, that is, r = f /
fref,
Vt being the threshold voltage.
The normalized workload in a system is equivalent to the processor utilization. Energy consumed by the processor given by the equation (5), which is a function of the processor frequency (f). The increase in the processor speed increases energy consumption and also the overall performance of the sensor nodes and vice versa. Considering the above factor that affects energy consumption and performance it is essential to obtain optimized values for the processor speed. The processing rate is matched to the workload so there are no idle cycles, and utilization is maximized. The performance of the processor for a given task is given by
P
=
I
×
C
×
N
(6)
Where P is the execution time of the processor, I is the instruction count of the task, C is the Clock cycle time and N is the number of clocks per instruction.
Figure 3: Optimizing Processing Speed (OPS) The above algorithm chooses the optimal processor voltage and the processor speed for each task. The energy gain/loss percentage and performance gain/loss percentage are compared to find the optimal values.
4. PERFORMANCE ANALYSIS
Table1: Simulation Model Specification
The simulation of the proposed work is implemented in OMNET++ 4.0 and the model is described in Table 1,which is an inference from
Omnet++ Migration Guide . The structure of a simulation model is described using the NED language. The experimental setup includes a sink (Base station) and five hundred sensor nodes that are deployed randomly in the sensor field. The nodes are static and are assumed to have identical computational power and capability (Homogenous network).
[image:5.595.79.508.84.578.2]
Figure 4: Energy Savings In DVS
The Dynamic Voltage Scaling (DVS) approach results in energy savings as shown in Figure 4.The processing rate (r) is the ratio of current processor frequency and the maximum frequency. It is seen from above plot that when processor frequency is reduced, normalized energy (ratio of residual energy to the maximum energy) consumption is also reduced.
Figure 5. Comparison Of Optimized Performance Index
On comparing the efficiencies of the Optimized mode and Normal mode of the nodes in the sub-cluster as time progresses, average residual energy is more in Optimized mode than in the normal mode as shown in Figure 5. Optimized mode (which operates at optimal processor voltage and frequency) definitely scores above the node in the normal mode (node operating at highest processor frequency) by achieving energy efficiency without much degradation in performance.
To simultaneously compare the energy
efficiency and the performance, a new parameter
S.No Parameter Description
1 Platform Omnet++
2 Number of sensor nodes 500
3 Topology Type Static
4 Battery Capacity 3800mAh
5 Battery voltage 12V
[image:5.595.323.523.422.573.2] [image:5.595.85.291.501.601.2]called optimized performance index, is introduced. It is the ratio of Average Residual Energy in the nodes to the execution time of the tasks in the nodes. The greater the value, the greater energy efficiency and performance is achieved. Optimized performance index of the node is calculated and compared for nodes operating at lowest processor frequency, highest processor frequency and at optimal processor frequency.
Figure 6: Network Lifetime Vs Number Of Nodes
The average network lifetime is increased when ESOPS algorithm is used as shown in Figure 6 since the average energy dissipation of the network is drastically reduced by the energy efficient operation in the processor. When the number of nodes increases, more amount of energy is saved through the proposed algorithm which results in longevity of the network lifetime.
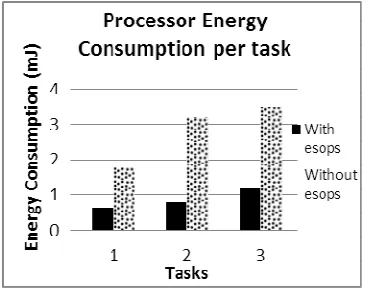
Figure 7: Processor Energy Consumption Per Task
The energy consumption of every task in the sensor node is measured during the simulation. It is clearly seen from Figure 7 that the energy consumption in the processor is reduced when ESOPS algorithm is used and variable processor frequency and voltage is used.
5. CONCLUSION
The Energy Efficient Sub-Clustering with optimized Processor Speed algorithm (ESOPS) proposed here increases the energy efficiency and thereby improving the performance by controlling the processor speed. When the processor speed is increased, there is increase in energy consumption and when it is decreased drastically, there is degradation in performance since the tasks' execution period increases. Hence an optimal trade -off is achieved by comparing the energy and performance gain and loss. The scope of this work can also be extended to the dynamic topology of sensor networks.
REFERENCES
[1] Amit Sinha and Anantha Chandrakasan 2001, “Dynamic power Management in Wireless Sensor Networks”, IEEE Design & Test of Computers, IEEE.
[2] I.F.Akyildiz, Su,Y.Sankarasubramaniam, E. Cayirci , “Wireless sensor networks: a survey” ElsevierComputer Networks 38 pp 393–422.
[3] Anton Cervin, Manel Velasco, Pau Marti, and Antonio Camacho, “Optimal On-Line Sampling Period Assignment”, 2009, Research Report: ESAII-RR-09-04.
[4] Feng Zhao and Leonidas Guibas “Wireless Sensor Networks: An Information Processing Approach”, Morgan Kaufmann, 2004.
[5] Hyung Sun Lee, Byung Kook Kim “ Co-scheduling of Processor Voltage and Control Task Period for Energy-Efficient Control Systems”, ACM Transactions on Embedded Computing Systems, Vol. 9, No. 3, 2010,Article 15.
[6] Jing Wang, Yonghe Liu, and Sajal K. Das “Energy-Efficient Data Gathering in Wireless Sensor Networks with Asynchronous Sampling” , ACM Transactions on Sensor Networks, Vol. 6, No. 3, 2010,Article 22.
[7] Jun Zhang and Xiaohuajia, GuoliangXing "Real-Time Data Aggregation in Contention-Based Wireless Sensor Networks", ACM Transactions on Sensor Networks, Vol. 7, No. 1, 2010, Article 2. [8] Jungsoo Kim, Younghoo Lee , “An
[image:6.595.87.272.500.645.2]voltage and Body Bias Exploiting Memory Stall Time Variation", in Design Automation Conference (ASP-DAC), 15th Asia and South Pacific, 2010, pages 575 – 580.
[9] MaznahKamat, Abdul Samad Ismail "Fine-Granularity Clustering in Wireless Sensor Networks"in Proceedings of the 8th International Conference on Advances in Mobile Computing and Multimedia Pages 259-265.
[10] Wei Tuming, Yu Sijia, Wei Hailong “Dynamic Sleep Time Control in Wireless Sensor Networks”, ACM Transactions on Sensor Networks, Vol. 6, No. 3, 2010, Article 21.
[11] Wei Tuming, Yu Sijia, Wei Hailong "A Dynamic Voltage Scaling Algorithm for Wireless Sensor Networks”, 3rd International Conference on Advanced Computer Theory and Engineering (ICACTE), 2010.
[12] Wenhong Zhao, Feng Xia "Dynamic Voltage Scaling with Asynchronous Period Adjustment for Embedded Controllers".
[13] Zhou Wei, “Energy efficient clustering algorithm based on neighbors for wireless sensor networks” , J Shanghai Univ (Engl Ed) ,Springer, 2011.
[14] Thomas D. Burd and Robert W. Brodersen "Energy Efficient CMOS Microprocessor Design" In Proc. of The HICSS Conference.
[15] Woo-Cheol Kwon and Taewhan Kim "Optimal Voltage Allocation Techniques for Dynamically Variable Voltage Processors " in ACM Transactions on Embedded Computing Systems (TECS) Volume 4 Issue 1, February 2005.
[16] Mark Hempstead, David Brooks and Gu-YeonWei"An Accelerator-Based Wireless Sensor Networks Processor in 130 nm CMOS", IEEE Transactions, 2011.
[17] Eugene Shih, Seong Hwan Cho, Nathan Ickes, Rex Min, Amit Sinha, Alice Wang, Anantha Chandrakasan, “Physical Layer Driven Protocol and Algorithm Design for Energy Efficient Wireless Sensor
Networks” in ACM SIGMOBILE 7/01 Rome, Italy© 2001 ACM ISBN 1-58113-422-3/01/07.
[18] Rex Min, Travis Furrer, and Anantha Chandrakasan “Dynamic Voltage Scaling Techniques for Distributed Microsensor Networks”, in WVLSI '00 Proceedings of the IEEE Computer Society Annual Workshop on VLSI (WVLSI'00), 2000, Page 43.
[19] OMNET++ Migration Guide Version 4.2.2