April 4, 1997
SRC
Research
Report
146
Studies of Windows NT Performance
using Dynamic Execution Traces
Sharon E. Perl and Richard L. Sites
d i g i t a l
Systems Research Center
130 Lytton Avenue
Systems Research Center
The charter of SRC is to advance both the state of knowledge and the state of the
art in computer systems. From our establishment in 1984, we have performed
ba-sic and applied research to support Digital’s business objectives. Our current work
includes exploring distributed personal computing on multiple platforms,
network-ing, programming technology, system modelling and management techniques, and
selected applications.
Our strategy is to test the technical and practical value of our ideas by building
hardware and software prototypes and using them as daily tools. Interesting
sys-tems are too complex to be evaluated solely in the abstract; extended use allows us
to investigate their properties in depth. This experience is useful in the short term
in refining our designs, and invaluable in the long term in advancing our
knowl-edge. Most of the major advances in information systems have come through this
strategy, including personal computing, distributed systems, and the Internet.
We also perform complementary work of a more mathematical flavor. Some of it is
in established fields of theoretical computer science, such as the analysis of
algo-rithms, computational geometry, and logics of programming. Other work explores
new ground motivated by problems that arise in our systems research.
Studies of Windows NT Performance
using Dynamic Execution Traces
Sharon E. Perl and Richard L. Sites
Publication History
A version of this report appeared in the Proceedings of the Second USENIX
Sym-posium on Operating Systems Design and Implementation (OSDI), October 1996.
Richard L. Sites is currently working at Adobe Systems, Inc. He can be reached
by email as [email protected].
c
Digital Equipment Corporation 1997
Abstract
We studied two aspects of the performance of Windows NT
tm
: processor
band-width requirements for memory accesses in a uniprocessor system running
bench-mark and commercial applications, and locking behavior of a commercial database
on a small-scale multiprocessor. Our studies are based on full dynamic execution
traces of the systems, which include all instructions executed by the operating
sys-tem and applications over periods of a few seconds (enough time to allow for
signif-icant computation). The traces were obtained on Alpha PCs, using a new software
tool called PatchWrx that takes advantage of the Alpha architecture’s PAL-code
layer to implement efficient, comprehensive system tracing. Because the Alpha
version of Windows NT uses substantially the same code base as other versions,
and therefore executes nearly the same sequence of calls, basic blocks, and data
structure accesses, we believe our conclusions are relevant for non-Alpha systems
as well. This paper describes our performance studies and interesting aspects of
PatchWrx.
1
Introduction
This work was triggered by two performance puzzles (circa 1995) related to the
Microsoft SQL Server running on Alpha [SW95] PCs under the Windows NT
op-erating system: how could we speed up the uniprocessor version, and how could
we get closer to linear scaling for the multiprocessor version?
To answer these questions we found that we needed to look at the detailed
be-havior of the system under load. We created a tool for obtaining complete traces of
the instruction and data streams executed by the processor in all operating system
and application code. We proceeded to examine these traces and to use them to
run simulations that revealed interesting properties of the then current system. The
results of the simulations also had implications for future processor design.
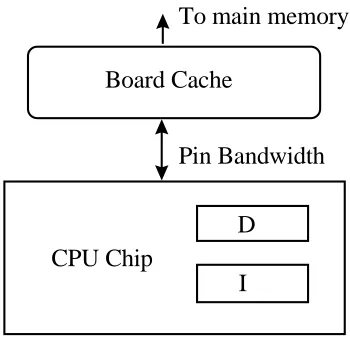
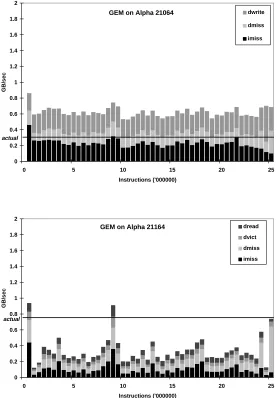
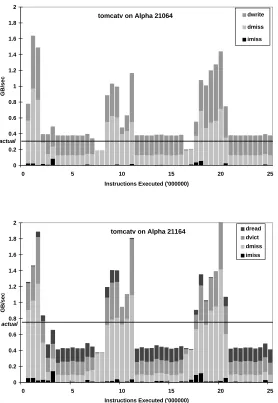
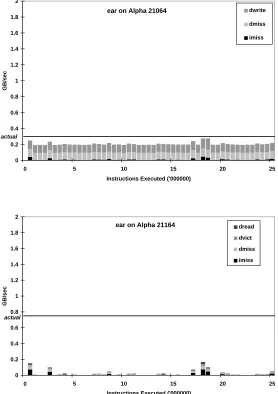
The first puzzle we studied is how the processor bandwidth requirements of
applications—the bandwidth required to service on-chip instruction and data cache
misses from off-chip caches or memory—limits the achievable execution speed of
the applications. This study was motivated by a discussion with some colleagues
about using a prefetching strategy to improve performance. Their studies showed
that prefetching would not help in the particular situation because there wasn’t
enough processor-chip pin bandwidth to support the workload. When pin
band-width is a bottleneck, some common techniques for trying to improve performance
do not help. These include multiple instruction issue, code scheduling,
prefetch-ing, and improved external cache latency. Pin bandwidth puts a ceiling on how fast
an application can run. We discovered that pin bandwidth is indeed a bottleneck
for interesting commercial applications, as well as for data accesses in one of the
SPEC benchmarks that we studied.
The second puzzle we studied is how lock contention for a multiprocessor
ap-plication limits the scalability of the apap-plication. Detailed execution traces
re-veal patterns of locking that may not have been expected by the operating system
designers, application designers, or hardware designers responsible for the cache
coherence protocol. Lock contention and the related cache coherence overhead
prevent the application from scaling up beyond a small number of processors.
The contributions of this work are threefold: we provide evidence of processor
pin bandwidth limitations and locking problems for commercial applications; we
introduce a new tool for obtaining full traces of a system that allows us to study
such problems; and we are making available some of the traces upon which our
studies are based for other researchers to use.
1
Also, the understanding we gained
from this work led to significant improvements to the hardware and software
in-volved, so the results presented here do not fully apply to currently-shipping
hard-1
Our uniprocessor traces are available on CD-ROM to full-time faculty members. Contact one of
ware and software.
In the next section we describe some of the more interesting aspects of the
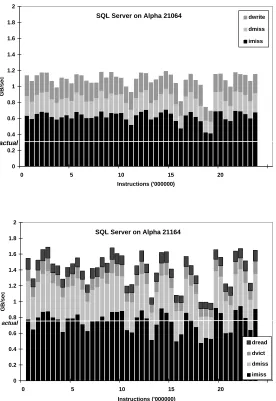
tracing tool, called PatchWrx. Section 3 describes our studies of pin bandwidth
re-quirements for four different applications on two different Alpha processors.
Sec-tion 4 describes studies of locking behavior of one of these applicaSec-tions—the
Mi-crosoft SQL Server database—on a small multiprocessor. Section 5 concludes.
2
PatchWrx
To understand the traces that are the input to our performance studies it is helpful
to understand the properties of PatchWrx, the tool used to produce them. In this
section we give an overview of PatchWrx, and then describe some of the highlights
of its design and implementation.
2.1
Overview
PatchWrx is a software-only technique for capturing full time-stamped traces of
the dynamic instruction stream (i-stream) and data stream (d-stream) of operating
system and user code.
The goal of the PatchWrx effort is to capture traces of every single instruction
executed throughout many seconds of a real operating system, running some
com-plex workload on a non-microprogrammed multiprocessor. We wanted to build
a software-only solution, rather than requiring one-of-a-kind hardware that
can-not easily be applied at a customer computing environment. We wanted to gather
traces with less than a factor of ten performance degradation, so that nothing in the
operating system broke due to timeouts or excessive latencies. Finally, we wanted
to work with arbitrary binaries for which we did not have access to the source code.
The technique we have adopted rewrites binary executable images, inserting
patches that record in a log the target of every change of control flow (branch,
call, return, system call, system return, interrupt, and return-from-interrupt), and
some base register values for d-stream memory accesses. A reconstruction program
working from the log and binary program images reproduces the trace of the full
i-stream and d-stream that was executed. Our logs are typically about 5–10 times
smaller than the resulting traces.
the worst slowdown we’ve seen is about 1/8 of normal speed. Patched images are
30-50% larger than the originals.
PatchWrx is an offshoot of work with binary translation [SCK
+
93], and of
the ATUM work in tracing using microcode [ASH86]. Our approach is similar
to other inline tracing efforts, but differs significantly in at least one dimension.
Most published studies are of user code only [EKKL90, LB94], or are done on
a single processor [BKW90, CB93], or require rebuilding source code [SJF92],
or trace only cache misses, not all instructions [CHRG95, TGH92]. None use
Windows NT. The excellent Shade paper [CK94] summarizes about thirty previous
tools. Using that paper’s classification, PatchWrx, like ATUM, traces executables,
user and system code, multiple domains, multiple processors, signals, dynamic
linking, and bugs, with performance similar to Shade.
We chose to produce traces rather than do on-the-fly data analysis [SE94]
be-cause of the difficulty of recreating complex execution environments months after
the original investigation. With a detailed trace, questions asked a year or more
later can still be investigated.
Somewhat like an electron microscope for computing, the PatchWrx approach
is for studying a small amount of execution in excruciating detail, rather than
sum-marizing long-running executions.
All of our experiments have been performed under Windows NT, version 3.5.
The uniprocessor experiments were run on an Alpha AXP 150 with 128 MB of
main memory. The multiprocessor experiments were run on a four-processor
Al-phaServer 2100, with 190 MHz processors and 256 MB of memory.
2.2
Trace Contents
The final output of PatchWrx is a trace containing the sequence of instructions
executed by the operating system and all applications from the time logging was
enabled up until the log buffer (from which the trace is reconstructed) filled up.
Each instruction in a trace is tagged with its program counter value, and if it is
a load or store instruction, the memory virtual address that is its source or target.
In a multiprocessor trace, the instruction is also tagged with its processor number.
opcode
opcode
opcode
time stamp
time stamp
time stamp
target PC
base register value
new process id
op
vector of 60 taken/fallthrough 2-way branch bits
8
32
[image:9.612.162.446.124.350.2]0
64
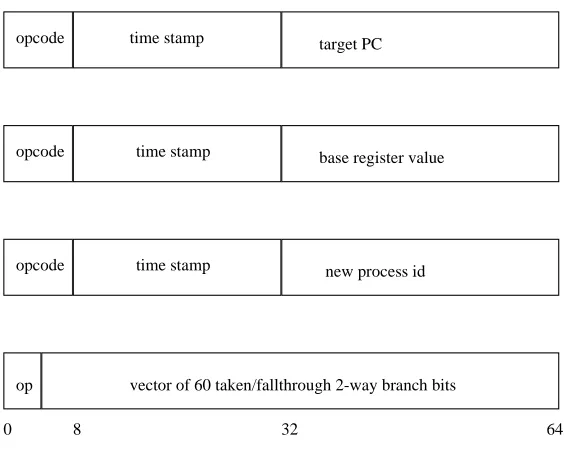
Figure 1: Formats of PatchWrx log entries. Each entry is 64 bits.
2.3
Log Entries
While a patched system is running, a log is collected recording the information
necessary to eventually reproduce a full system trace. A log is a sequence of entries
describing branching events or data references. Figure 1 summarizes the different
kinds of log entries.
As in most computer designs, the Alpha architecture has two basic forms of
branching instructions: a jump to an address in a register, and a PC-relative
two-way conditional branch. For each jump instruction, we record one log entry. For
two-way branches, we accumulate a bit-vector recording the outcome of up to 60
two-way branches in a single log entry, one bit per branch. This gives us a compact
encoding of the exact flow within a subroutine, taking only about 10% of the log
entries.
When an interrupt or page fault occurs during logging, the address of the first
instruction of the interrupt or fault handler is put in the log, along with the
ad-dress of the first instruction not executed because of the interrupt (the instruction
that would normally be executed immediately after the interrupt handler returns).
This information is used during trace reconstruction to determine exactly where
the interrupt occurred in the i-stream.
In the Alpha implementation of PatchWrx, the log is recorded in a 45 MB
portion of physical main memory that is reserved at boot time, and is therefore
invisible to the operating system. The log buffer holds about 5.9 million
eight-byte log entries, which is enough for 5–20 seconds of real time. There is so much
information in a single reconstructed trace that we have not been motivated to try
stitching multiple traces together [CHRG95, AH90]; a single reconstructed trace
contains about 650 MB of dynamic i-stream with instruction and data addresses.
Recording the log in main memory is much faster than recording on disk or
tape. Recording in physical memory instead of virtual memory allows us to trace
the lowest levels of the operating system, including the page-fault handler, without
generating recursive page faults. It also allows us to trace across multiple threads
running in multiple address spaces, without needing to write a log entry to one
address space while executing in a different address space.
2.4
PAL Subroutines for Logging
To implement the logging code, we use the Alpha architecture’s PALcall
instruc-tion, which traps to one of a set of Privileged Architecture Library (PAL)
special-ized subroutines without disturbing any programmer-visible state, such as registers.
These subroutines have access to physical main memory and to internal hardware
registers and they run with interrupts turned off. We extended the PAL-code for
Alpha NT with eight additional subroutines, and we modified some of the existing
subroutines, as summarized in Table 1. Other architectures may have supervisor
call or trap instructions that, in conjunction with modified operating system kernel
interrupt routines, could be used to get a similar effect.
2.5
Collecting Data Addresses
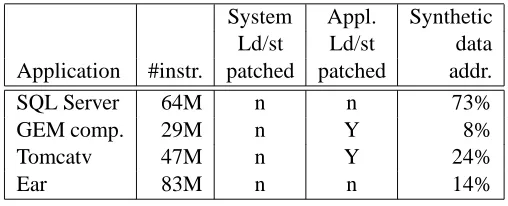
It is possible to capture data addresses by patching all load and store instructions,
but this fills up the log buffer quite quickly and so we would like to avoid it. We
observe that many pieces of code use multiple references off the same base register.
Since the i-stream reconstruction recovers the actual instructions executed, we will
have these address specifications in the dynamic i-stream. Thus, for a sequence
of references over which changes to the base register value can be computed from
the i-stream, we need only record the base register’s value once. The effect is that
only one out of every 5–10 load or store instructions is actually patched, and that
for loops with constant strides through memory, only the initial base-register value
outside the loop is traced.
reg-PAL routine
Action/Recorded info.
PalReset
(Set aside log memory)
InterruptStackDispatch
next addr., interrupt target
SoftwareInterrupt
next addr., interrupt target
DispatchMmFault
next addr., page fault target
UNALIGNED
next addr., align. fault target
RFE
return from exception target
CALLSYS
sys. call target
RETSYS
return from sys. call target
SWPCTX
new process ID
pwrdent
read log entry from buffer
pwctrl
init. log, turn logging on/off
pwbsr
branch entry
pwjsr
jump/call/return entry
pwldst
load/store base register entry
pwbrt
cond. branch taken
[image:11.612.180.432.245.496.2]pwbrf
cond. branch fall-through
pwpeek
(for debugging only)
ister value (as with certain interrupts). When this happens during reconstruction,
we make up a random synthetic value for the base register, then track any
incre-mental changes from there. Even in code with no load/store patches at all, this
is surprisingly useful. The effect seen in the d-stream is that the bases of arrays
and structures and stacks are random, but the relative access patterns within each
aggregate are accurately reflected.
2.6
Handling Multiprocessors
When PatchWrx is running on multiple processors, the log entries for all processors
are merged into a single log buffer. This allows us to see the dynamics of the
interactions between processors. Writing a single merged log requires doing a
multiprocessor-atomic update of the next-log-entry pointer, and requires encoding
the processor number in each log entry.
Rather than interleaving single entries, we allocate chunks of 128 entries to
each processor. This cuts down the frequency of atomic updates by two orders
of magnitude and lets us encode the processor number once per chunk of entries,
rather than in every entry. With log entries generated on each processor at the
rate of about one per microsecond, a group of four chunks represents about 100
microseconds of real time on a four-processor system.
2.7
Trace Reconstruction from Logs
Reconstruction of a full trace given a log and a set of binaries is mostly
straight-forward. As described above, some special care and techniques are applied for
obtaining data addresses from a limited set of base register values recorded in a
log. Two additional tricky issues involve handling interrupts and merging
multi-processor traces.
The second issue concerns merging traces from multiple processors. This
re-quires special care because the time stamps within the entries come from four
dif-ferent cycle clocks (oscillators) on a four-processor system. These clocks are not
synchronized with each other, and we observe drift of up to 100 parts per million
(100 microseconds per second) within logs. All we really know about the clocks is
that the first time stamp in chunk
Nwas created after the first time stamp in chunk
N,1