© 2018, IRJET | Impact Factor value: 6.171 | ISO 9001:2008 Certified Journal | Page 1948
Comparative Analysis of Big Data, Big Data Analytics: Challenges and
Trends
Dr. Venkatesh Naganathan
Associate Professor, Dept. of MCA, Acharya Institute of Technology, Bangalore, India
---***---Abstract -
As the name implies, Big Data literally means
large collections of data sets containing abundant information. Big data has the potential to revolutionize the art of management to take appropriate decision on time. Extremely large data sets that may be analyzed computationally to reveal patterns, trends, and association from unstructured data into structured ones to find a solution for a business is the key factor in today’s market. Despite the high operational and strategic impacts, there is a scarcity of empirical research to assess the business value of big data. Big Data Analytics is increasingly becoming a trending practice that many organizations are adopting with the purpose of constructing valuable information from Big Data. This paper provide in depth analysis of Big data its challenges and its future scope where it is leading too and Big Data Analytics methods used by different organizations that helps their business to make a strong investment decisions. Paper also covers different big data tools used with its salient features. Future research directions in this field are wide opened; but this paper has tried to facilitate the exploration of the domain and the development of optimal techniques to address Big Data.
Key Words: Big Data (BD), Big Data Analytics (BDA),
Hadoop, Business Intelligence (BI), Entity Recognition (ER)
1. INTRODUCTION
Big data is a burning issue in today’s business world. The massive raise in the amount of data collected and stored by organizations around the world over the past few decades is indisputable and the ability to access and analyse this data is quickly becoming more and more important. 'Big data' refers to data sets that are too large or too complex for traditional data processing applications. For extracting value from data we used to refer to predictive analytics or other methods. To explore the in depth of big data, businesses rely on raw storage and processing power as well as strong analytics capabilities and skills. In 2017, annual revenue from the global big data market was expected to reach 33.5 billion U.S. dollars, with predictions suggesting this could double in size within the following four years. The major share of big data revenue is thought to stem from hardware spending, representing slightly more than a third of the overall market. The major providers of Big Data services include global names such as IBM, SAP, Oracle, Hewlett Packard, Dell Incorporation, Amazon Web Services, Splunk, Teradata etc.
Big Data is the new age technology that has made revolutionary insights available in real-time. Business, governments and even NGOs can benefit by leveraging the
insights offered by big data analysis. Data if we look into it is in fact everywhere; access to data has also increased multifold. We search on Google, message on Facebook; all the status updates, pictures, and videos posted by people on their social media contains information — information about their demographics, their likes, their dislikes, purchasing preference etc are nothing but information, i.e. basically user data can be analysed, and its applications are numerous. Facebook, you see advertisements about things you’ve searched for in the past and enjoy looking at on the internet. They are actually a product of data analytics; however, this trend will only blow up in 2018 and become even more widespread and normalized.
We can easily analysis ones social media data and can analyse their preference of choice of shopping, their travel destinations, preferred hotels, mode of travel etc. The shopping malls or shop keepers can identify which items are on demand and best selling and at which times of the day and same applies to travel agents can monitor the preferred destination most frequently looked for by the customers. This technique is known as data analytics, and it is one of the biggest trends of 2018. Now with smart watches, glasses and even smart clothes the world will become a data collection mechanism.
Big Data is most often used in the areas of marketing, sales, IT, Healthcare and finance; however, as the reliability of big data improves, businesses see further, long-term opportunities for big data in the areas of risk management and logistics. Nonetheless, some caution is required as big data is not without its challenges. But we often discourage the potential of this technology because of us failing to understand its capabilities and only we fear on the data security and privacy of data usage; that too after the incident of data leakage from Facebook.
These challenges range from maintaining the quality of data to complying with domestic and international laws governing the use of data. Businesses that rely on poor quality data risk wasting time, losing sales, and lowering their margins due to inefficiency. In his paper we will highlight on the different Big Data tools and methods used by the industry and where it is leading us too will be explored. Finally will compare and analysis the challenges and trends in today’s Big Data world.
1.1 Big Data Market Analysis
© 2018, IRJET | Impact Factor value: 6.171 | ISO 9001:2008 Certified Journal | Page 1949 creating new business models, and improving operational
performance are three dominant factors driving analytics, Big Data, and Business Intelligence (BI) investments today. Unleashing the insights hidden in unstructured data is providing enterprises with the potential to compete and improve in areas they had limited visibility into before. Examples of these areas include the complexity of B2B selling and service relationships, healthcare services, and maintenance, repair, and overhaul Maintenance, Repair & Operating/Operations (MRO) of complex machinery. Business value derived from big data and predictive analytics is large, transformative, and highly visible. Predictive analytics techniques include Statistical, Data Mining, Machine Learning and Deep Learning models that analyze data to predict unknown future events. Once data is extracted, organized and prepared, today's models can quickly make forecasts based on thousands of predictive variables measured over millions of data records. Machine Learning techniques, for example, are experts at pattern recognition and Artificial Intelligence cognitive models (that use deep learning or neural network techniques) act as decision-making agents that can track, process and react faster than humans can.
Major findings from IDC on Big Data technology and services market for the 2016–2020 period. In aggregate, the Big Data technology and services market is estimated to grow at a CAGR of 22.6% from 2015 to 2020 and reach $58.9 billion in 2020. Revenue for Big Data infrastructure is estimated to grow at a CAGR of 20.3% from 2015 to 2020 and reach $27.7 billion in 2020. Revenue for Big Data software is estimated to grow at a CAGR of 25.7% from 2015 to 2020 and reach $15.9 billion in 2020. Revenue for Big Data services, which consists of professional and support services, is estimated to grow at a CAGR of 23.9% from 2015 to 2020 and reach $15.2 billion in 2020 [1]. "The Big Data technology and services market will exhibit strong momentum through 2020, thanks to aggressive DX initiatives," said Ashish Nadkarni, program director, Worldwide Infrastructure, and co-lead of Big Data market research at IDC. "Year-over-year growth is estimated to reduce slightly as the market matures and becomes a segment of broader business analytics market in its entirety."
Big data and business analytics worldwide revenues will grow from nearly $122B in 2015 to more than $187B in 2019, an increase of more than 50% over the five-year forecast period. The industries that present the largest revenue opportunities are Discrete Manufacturing ($22.8B in 2019), Banking ($22.1B), and Process Manufacturing ($16.4B). Source: Worldwide Big Data and Business Analytics Revenues Forecast to Reach $187 Billion in 2019, According to IDC.
According to Markets and Markets, the global predictive analytics market is expected to grow from $3.85 billion in 2016 to $12.41 billion by 2022 or a CAGR of 22.1%. Zion Market Research forecasts a similar growth rate. From a slightly different perspective, Forbes writes in its August
Roundup of Analytics, Big Data & BI Forecasts and Market Estimates 2016, that by 2020, predictive analytics will attract 40% of enterprises’ net new investment in Business Intelligence and Analytics [2].
1.2 Big Data Analytics
Big Data refers to humongous volumes of data that cannot be processed effectively with the traditional applications that exist. The processing of Big Data begins with the raw data that isn’t aggregated and is most often impossible to store in the memory of a single computer. A buzzword that is used to describe immense volumes of data, both unstructured and structured, Big Data inundates a business on a day-to-day basis. Big Data is something that can be used to analyse insights which can lead to better decisions and strategic business moves [3]. The definition of Big Data, given by Gartner is, “Big Data is volume, and high-velocity and/or high-variety information assets that demand cost-effective, innovative forms of information processing that enable enhanced insight, decision making, and process automation”.
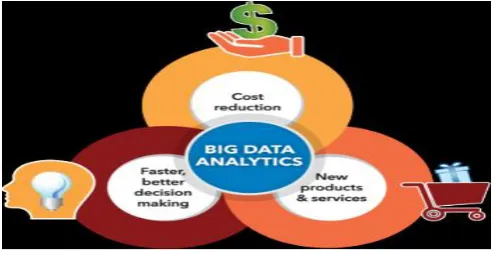
Big data analytics examines large amounts of data to uncover hidden patterns, correlations and other insights. With today’s technology, it’s possible to analyze your data and get answers from it almost immediately – an effort that’s slower and less efficient with more traditional business intelligence solutions [4]. Big Data analytics can help organizations to better understand the information contained within the data and will also help identify the data that is most important to the business and future business decisions. Analysts working with Big Data typically want the knowledge that comes from analyzing the data [5]. In his report Big Data in Big Companies, IIA Director of Research Tom Davenport interviewed more than 50 businesses to understand how they used big data. He found they got value in the following ways [4]: See Fig -1 for details.
Cost Reduction. Big Data technologies such as Hadoop and cloud-based analytics bring significant cost advantages when it comes to storing large amounts of data – plus they can identify more efficient ways of doing business [4].
Faster, Better Decision Making. With the speed of Hadoop and in-memory analytics, combined with the ability to analyze new sources of data, businesses are able to analyze information immediately – and make decisions based on what they’ve learned [4].
New Products and Services. With the ability to gauge customer needs and satisfaction through analytics comes the power to give customers what they want. Davenport points out that with big data analytics, more companies are creating new products to meet customers’ needs [4].
© 2018, IRJET | Impact Factor value: 6.171 | ISO 9001:2008 Certified Journal | Page 1950 processes are separate but highly integrated functions of
high-performance analytics. Using Big Data tools and software enables an organization to process extremely large volumes of data that a business has collected to determine which data is relevant and can be analyzed to drive better business decisions in the future.
Fig -1: Big Data Analytics Importance
2. BIG DATA TOOLS AND ITS SILENT FEATURES
The architecture of Big Data must be synchronized with the support infrastructure of the organization. To date, all of the data used by organizations are stagnant. Data is increasingly sourced from various fields that are disorganized and messy, such as information from machines or sensors and large sources of public and private data. Previously, most companies were unable to either capture or store these data, and available tools could not manage the data in a reasonable amount of time. However, the new Big Data technology improves performance, facilitates innovation in the products and services of business models, and provides decision making support[6][7].
Data scientists and machine learning engineers are in big demand in the Big Data world, consistently topping the LinkedIn lists of the most in-demand jobs. With a shortage of people with data science and machine learning expertise, businesses are increasingly looking for software tools that can help fill that skills gap. The global market for data science platforms hit $19.76 billion in 2016 and will grow at a CAGR of more than 36 percent to reach $128.21 billion by 2022, according to Statistics Market Research Consulting [8].
Nowadays, the companies are churning out a massive volume of data by their day to day activities. From your customers’ behavior, you can get to know about their preference, how much they are using your products or services, payment methods and many more things. Hence, the companies are focusing on Big Data Management which will provide them with bigger and wider insights so that they can improve their business goals on the basis of these insights [9]. Big data plays an imperative role in your analytics. If you are blessed with the advanced big data tools and techniques, then you can easily manage the unstructured and unpolished data and can extract meaningful information from them. 87% of companies believe that Big Data Analytics will help them in
reshaping their business within the next three years and 89% believe that if they do not adopt Big Data Analytics, then they will lose the competition [9].
Today almost every organization extensively uses Big Data to achieve the competitive edge in the market. With this in mind, open source Big Data tools for big data processing and analysis are the most useful choice of organizations considering the cost and better time management into the data analytical tasks. As organizations are rapidly developing new solutions to achieve the competitive advantage in the Big Data market, it is useful to concentrate on open source Big Data tools which are driving the Big Data industry. Hadoop is the top open source project and the Big Data bandwagon roller in the industry. However, it is not the end! There are plenty of other vendors who follow the open source path of Hadoop. Here are some important big data tools with their key features and download links.
a) Hadoop
Hadoop is basically an open-source software framework which is written in Java language so that it can work with a chunk of data sets. It allows distributed processing of large data sets across clusters of computers. It is designed to scale up from single servers to thousands of machines. This is 100% open source framework and runs on commodity hardware in an existing data center. Furthermore, it can run on a cloud infrastructure. Hadoop consists of four parts [10]:
Hadoop Distributed File System: Commonly known as HDFS, it is a distributed file system compatible with very high scale bandwidth.
MapReduce: A programming model for processing big data.
YARN: It is a platform used for managing and scheduling Hadoop’s resources in Hadoop infrastructure.
Libraries: To help other modules to work with Hadoop.
Features:
Authentication improvements when using HTTP proxy server
Specification for Hadoop Compatible Filesystem effort
Support for POSIX-style filesystem extended attributes
It offers robust ecosystem that is well suited to meet the analytical needs of developer
It brings Flexibility In Data Processing
It allows for faster data Processing
Download link: https://hadoop.apache.org/releases.html
b) Apache Spark
[image:3.595.35.285.161.288.2]© 2018, IRJET | Impact Factor value: 6.171 | ISO 9001:2008 Certified Journal | Page 1951 build parallel apps. It is used at a wide range of organizations
to process large datasets. Interestingly, Spark can handle both batch data and real-time data. As Spark does in-memory data processing, it processes data much faster than traditional disk processing. This is indeed a plus point for data analysts handling certain types of data to achieve the faster outcome [11].
Features:
It helps to run an application in Hadoop cluster, up to 100 times faster in memory, and ten times faster on disk
It offers lighting Fast Processing
Support for Sophisticated Analytics
Ability to Integrate with Hadoop and Existing Hadoop Data
It provides built-in APIs in Java, Scala, or Python Download link: https://spark.apache.org/downloads.html
c) Apache Strom
Storm is a free and open source big data computation system. It offers distributed real-time, fault-tolerant processing system. With real-time computation capabilities; the framework supports any programming language. Storm topologies can be considered similar to MapReduce job. However, in case of Storm, it is real-time stream data processing instead of batch data processing. Based on the topology configuration, Storm scheduler distributes the workloads to nodes. Storm can interoperate with Hadoop’s HDFS through adapters if needed which is another point that makes it useful as an open source big data tool [10].
Features:
Massive scalability
Fault-tolerance
“fail fast, auto restart” approach
The guaranteed process of every tuple
Written in Clojure
Runs on the JVM
Supports direct acrylic graph(DAG) topology
Supports multiple languages
Supports protocols like JSON
Download link: http://storm.apache.org/downloads.html
d) Apache Cassandra
Apache Cassandra is a distributed type database to manage a large set of data across the servers. This is one of the best big data tools that mainly process structured data sets. It provides highly available service with no single point
of failure. Additionally, it has certain capabilities which no other relational database and any NoSQL database can provide. Apache Cassandra architecture does not follow master-slave architecture, and all nodes play the same role. It can handle numerous concurrent users across data centers. Hence, adding a new node is no matter in the existing cluster even at its up time [10].
Features:
Continuous availability as a data source
Linear scalable performance
Simple operations
Across the data centers easy distribution of data
Cloud availability points
Scalability
Performance
Download link: http://cassandra.apache.org/download/
e) Microsoft HDInsight
Azure HDInsight is a Spark and Hadoop service in the cloud. It provides big data cloud offerings in two categories, Standard and Premium. It provides an enterprise-scale cluster for the organization to run their big data workloads [11].
Features:
Reliable analytics with an industry-leading SLA
It offers enterprise-grade security and monitoring
Protect data assets and extend on-premises security and governance controls to the cloud
High-productivity platform for developers and scientists
Integration with leading productivity applications
Deploy Hadoop in the cloud without purchasing new hardware or paying other up-front costs
Download link: https://azure.microsoft.com/en-in/free/
f) Tableau Public
© 2018, IRJET | Impact Factor value: 6.171 | ISO 9001:2008 Certified Journal | Page 1952 Tableau Public is all data is public and offers very little scope
for restricted access; Data size limitation and cannot be connected to R. The only way to read is via OData sources is Excel or txt [12].
Features:
You can publish interactive data visualizations to the web for free.
No programming skills required.
Download link: https://data-flair.training/blogs/tableau-download/
g) R language
R is an open source programming language which helps the organizations to manage and analyze a chunk of data effectively and aptly. The language was initially written by Ross Ihaka and Robert Gentleman but it has got immense appreciation from the mathematicians, statisticians, data scientists and data miners who are in the field of data analytics. R is packed with a host of data analysis tools which make the analysis of data more facile and simpler for the users. With R, businesses don’t need to develop the customized tools and moreover, they can easily get rid of the time-consuming codes. R is the prime data analysis software which consists of innumerable algorithms that are designed for data retrieval, processing, analysis and high-end statistical graphics representations. It provides a wide variety of statistical tests [9].
Features:
Effective data handling and storage facility,
It provides a suite of operators for calculations on arrays, in particular, matrices,
It provides coherent, integrated collection of big data tools for data analysis
It provides graphical facilities for data analysis which display either on-screen or on hardcopy Download link: https://www.r-project.org/
In this sub section, more than a few big data tools were elucidated along with their features of several tasks. It also provides obliging services for readers, researches, business users and analysts to make enhanced and quicker decisions using data which will promote for development and innovation in the future.
3. BIG DATA ANALYTICS METHODS USED BY
DIFFERENT ORGANIZATIONS
To analyze such a large volume of data, Big Data analytics is typically performed using specialized software tools and applications for predictive analytics, data mining, text mining,
forecasting and data optimization. Collectively these processes are separate but highly integrated functions of high-performance analytics. Using Big Data tools and software enables an organization to process extremely large volumes of data that a business has collected to determine which data is relevant and can be analyzed to drive better business decisions in the future[5].
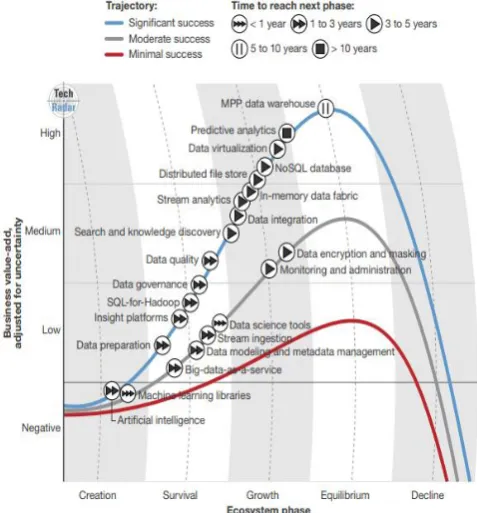
Data and analytics are at the heart of the digital revolution. They are an imperative across all industries. To survive and thrive in the digital era, now is the time to drive data and analytics into the core of your business and scale outward to every employee, customer, supplier, and partner. Scaling the value of data and analytics requires a culture of data enablement that extends throughout every facet of your organization. A culture where data and analytics inform and drive business objectives, operational efficiencies, and innovation from Gartner Data & Analytics Summit 2018. Forrester has redefined the big data technology ecosystem that they introduced in 2014. They investigated the current state of vendor innovations and identified a new set of the 22 most important technologies in the big data ecosystem. See
[image:5.595.315.554.478.735.2]Fig -2 for more details. Forrester surveyed 63 vendors, interviewed 17 experts in the field, and leveraged their deep expertise in evaluating many big data technologies through the Forrester Wave™ process. There detailed research with 65 current or potential customers and users of the technologies. Key findings from the data collected: 1) the current state of the technology; 2) the technology’s potential impact on customers’ businesses; 3) the time that experts think the technology will need to reach the next stage of maturity; and 4) the technology’s overall trajectory — from minimal success to significant success. See Fig 3 for details.
© 2018, IRJET | Impact Factor value: 6.171 | ISO 9001:2008 Certified Journal | Page 1953
Fig -3: Firms Are Looking To Embed Insights into the Fabrics of Their Business Systems
Source: Forrester’s Q4 2015 Global State of Big Data And Insights Marketplace Online Survey
Currently, when we look into the market we see many big data technologies available for the customers; but the key concern is which one to adopt; how to utilize to the fullest of its usage with the existing resources; security concerns; cost etc. Market is going through a major overhaul in data management strategy; to address new business requirements such as real-time data processing, self-service, and business agility. Question in mind is; we’re not certain which ones we should invest in now or plan to include in the coming years. As Assuncao, Calheiros, Bianchi, Netto, and Buyya (2015) highlight the reason for this is that current solutions for analytics are often based on proprietary appliances or software systems built for general purposes. As a result, organizations need to put in significant effort to customize such BDA solutions to their individual needs, which might require integrating different data sources and setting up the software on the organization's hardware [13].
Here we will explore some of the best Big Data Technologies available:
a) Predictive Analytics:
Software and/or hardware solutions that allow firms to discover, evaluate, optimize, and deploy predictive models by analyzing big data sources to improve business performance or mitigate risk [14]. Predictive analytics is concerned with forecasting and statistical modeling to determine the future
possibilities [15]. Several factors call for developing new statistical methods for big data. First, conventional statistical methods are rooted in statistical significance: a small sample is obtained from the population and the result is compared with chance to examine the significance of a particular relationship. The conclusion is then generalized to the entire population. In contrast, big data samples are massive and represent the majority of, if not the entire, population. As a result, the notion of statistical significance is not that relevant to big data. Secondly, in terms of computational efficiency, many conventional methods for small samples do not scale up to big data. The third factor corresponds to the distinctive features inherent in big data: heterogeneity, noise accumulation, spurious correlations, and incidental endogeneity [16].
b) Data Acquisition
Data acquisition has two components: identification and collection of big data. Identification of big data is done by analyzing the two natural formats of data — born digital and born analogue [17].
Born Digital Data
It is the information which has been captured through a digital medium, e.g. a computer or Smartphone app, etc. This type of data has an ever expanding range since systems keep on collecting different kinds of information from users. Born digital data is traceable and can provide both personal and demographic business insights. Examples include Cookies, Web Analytics and GPS tracking [17].
Born Analogue Data
When information is in the form of pictures, videos and other such formats which relate to physical elements of our world, it is termed as analogue data. This data requires conversion into digital format by using sensors, such as cameras, voice recording, digital assistants, etc. The increasing reach of technology has also raised the rate at which traditionally analogue data is being converted or captured through digital mediums [17].
c) Prescriptive Analytics
© 2018, IRJET | Impact Factor value: 6.171 | ISO 9001:2008 Certified Journal | Page 1954 number of dimensions that they capture [21]. Therefore the
analysis from such data provides, at best, partial insights into a complex business problem. Few initial studies have applied the simulation optimization methods to the BDA. For instance, Xu, Zhang, Huang, Chen, and Celik (2014) proposed a framework called multi- fidelity optimization with ordinal transformation and optimal sampling (MO2TOS). The framework provides a foundation for descriptive and prescriptive analytics under the BD environment. In the MO2TOS framework, two set of high- and low resolution models were developed. The authors highlighted that the high resolution model development can be very slow due to the large amount of data. On the other hand, the low-resolution models were much faster and can be developed using only a sample of data. The proposed MO2TOS framework is able to efficiently integrate the both the resolution models to optimize targeted systems under the BD environment [22].
In general, prescriptive solutions assist business analysts in decision making by determining actions and assessing their impact regarding business objectives, requirements, and constraints. For example, what if simulators have helped provide insights regarding the plausible options that a business could choose to implement in order to maintain or strengthen its current position in the market
d) Descriptive Analytics:
Descriptive analytics scrutinizes data and information to define the current state of a business situation in a way that developments, patterns and exceptions become evident, in the form of producing standard reports, ad hoc reports, and alerts [18]. Another form of descriptive analysis, pointed out by Banerjee, Bandyopadhyay, and Acharya (2013) is the use of dashboard sort of application when a business routinely generates different metrics including data to monitor a process or multiple processes across times. For example, this sort of application could be useful to understand in terms of the financial strength of a business at a given point of time or
to compare it with others or its own across different point of time. In descriptive analytics, there is a need for analysts to nurture the skill of reading facts from figures, connecting them with the relevant decision-making process and finally taking a data-driven decision from a business perspective. Most of the BDA is commonly descriptive (exploratory) in nature and the use of descriptive statistical methods (data mining tools) allows businesses to discover useful patterns or unidentified correlations that could be used for making business decisions [21].
Spiess, T'Joens, Dragnea, Spencer, and Philippart (2014) highlights root cause analysis and diagnostics are also form of descriptive analysis which involve both the passive reading and interpretation of data, as well as initiating particular actions on the system under test, and reading out the results. The author discuss that root cause analysis is an elaborate process of continuous digging into data, and correlating
various insights such as to determine the one or multiple fundamental causes of an event [24].
Inquisitive Analytics is about probing data to certify/reject business propositions, for example, analytical drill downs into data, statistical analysis, factor analysis [19] and pre-emptive analytics is about having the capacity to take precautionary actions on events that may undesirably influence the organizational performance, for example, identifying the possible perils and recommending mitigating strategies far ahead in time [23].
e) In-Memory Data Fabric:
In-memory data fabric provides low-latency access and processing of large quantities of data by distributing data across the dynamic random access memory (DRAM), Flash, or SSD of a distributed computer system [14]. These database storage systems are designed to overcome one of the major hurdles in the way of big data processing — the time taken by traditional databases to access and process information. In memory database systems store the data in the RAM of big data servers, therefore, drastically reducing the storage I/O gap. Apache Spark is an example of IMDB systems. VoltDB, NuoDB and IBM solidDB are some more examples of the same [17].
f) Text Analytics:
Text analytics (text mining) refers to techniques that extract information from textual data. Social network feeds, emails, blogs, online forums, survey responses, corporate documents, news, and call center logs are examples of textual data held by organizations. Text analytics involve statistical analysis, computational linguistics, and machine learning. Text analytics enable businesses to convert large volumes of human generated text into meaningful summaries, which support evidence-based decision-making. For instance, text analytics can be used to predict stock market based on information extracted from financial news [25]. Let us consider a brief review of text analytics methods below. Information Extraction (IE) techniques extract structured data from unstructured text. For example, IE algorithms can extract structured information such as drug name, dosage, and frequency from medical prescriptions. Two sub-tasks in IE are Entity Recognition (ER) and Relation Extraction (RE) [26]. ER finds names in text and classifies them into predefined categories such as per-son, date, location, and organization. RE finds and extracts semantic relationships between entities (e.g., persons, organizations, drugs, genes, etc.) in the text. For example, given the sentence “Steve Jobs co-founded Apple Inc. in 1976”, an RE system can extract relations such as FounderOf [Steve Jobs, Apple Inc.] or FoundedIn [AppleInc., 1976].
© 2018, IRJET | Impact Factor value: 6.171 | ISO 9001:2008 Certified Journal | Page 1955 marketing, and education. QA systems rely on complex
Natural Language Processing (NLP) techniques. Sentiment analysis (opinion mining) techniques analyze opinionated text, which contains people’s opinions toward entities such as products, organizations, individuals, and events. Businesses are increasingly capturing more data about their customers’ sentiments that has led to the proliferation of sentiment analysis [26].
Aspect-based Techniques recognize all sentiments within a document and identify the aspects of the entity to which each sentiment refers. For instance, customer product reviews usually contain opinions about different aspects (or features) of a product. Using aspect-based techniques, the vendor can obtain valuable information about different features of the product that would be missed if the sentiment is only classified in terms of polarity [26].
g) Audio Analytics:
Audio analytics analyze and extract information from unstructured audio data. When applied to human spoken language, audio analytics is also referred to as speech analytics. Since these techniques have mostly been applied to spoken audio, the terms audio analytics and speech analytics are often used interchangeably. Currently, customer call centers and healthcare are the primary application areas of audio analytics.
In healthcare, audio analytics support diagnosis and treatment of certain medical conditions that affect the patient’s communication patterns (e.g., depression, schizophrenia, and cancer [28]. Also, audio analytics can help analyze an infant’s cries, which contain information about the infant’s health and emotional status [29]. The vast amount of data recorded through speech-driven clinical documentation systems is another driver for the adoption of audio analytics in healthcare.
h) Non-Relational Databases
The databases that store these massive data sets have also evolved in how and where the data is stored. JavaScript Object Notation or JSON is the preferred protocol for saving big data nowadays. Using JSON, the tasks can be written in the application layer and allow better cross-platform functionalities, enabling agile development of scalable and flexible data solutions. Many companies use non-relational databases to replace XML and transmit structured data between the server and web application [17].
i) Data Virtualization
Data visualization is a general term that describes any effort to help people understand the significance of data by placing it in a visual context. Patterns, trends and correlations that might go undetected in text-based data can be exposed and recognized easier with data visualization software. It enables applications to retrieve data without implementing technical restrictions such as data formats, the physical location of
data, etc. Used by Apache Hadoop and other distributed data stores for real-time or near real-time access to data stored on various platforms, data virtualization is one of the most used big data technologies [30].
j) Data Integration
Big data integration takes traditional data, machine-generated data, social media, web data, and data from the Internet of Things (IoT), and combines it to provide the most complete and up-to-date view of your business. It drives insights you need to boost performance and allows analysis that wouldn't otherwise be possible [31]. A key operational challenge for most organizations handling big data is to process terabytes (or petabytes) of data in a way that can be useful for customer deliverables. Data integration tools allow businesses to streamline data across a number of big data solutions such as Amazon EMR, Apache Hive, Apache Pig, Apache Spark, Hadoop, MapReduce, MongoDB and Couchbase [18].
3.1 Big Data Usage In Industry
Are companies seeing any value to their investments in “big data”? Randy Bean been surveying executives of Fortune 1000 companies about their data investments since 2012, and for the first time a near majority – 48.4% — report that their firms are achieving measurable results from their big data investments, with 80.7% of executives characterizing their big data investments as “successful” [32]. See the Fig -4
[image:8.595.312.555.449.659.2]for the adoption of big data by Industry.
Fig -4: Dresner Advisory Services Publishes 2017 Big Data Analytics Market Study
© 2018, IRJET | Impact Factor value: 6.171 | ISO 9001:2008 Certified Journal | Page 1956 20th across 33 key technologies Dresner Advisory Services
[image:9.595.311.557.107.280.2]currently tracks. Big Data Analytics is of greater strategic importance than the Internet of Things (IoT), natural language analytics, cognitive Business Intelligence (BI) and Location intelligence [33]. See Fig -5 for details.
Fig -5: Dresner Advisory Services Publishes 2017 Big Data Analytics Market Study
The chart below illustrates the range of big data initiatives that are underway at leading corporations, with expense reduction being the most mature, as measured by the number of initiatives that are underway, with nearly one-half of all executives indicating that they have decreased expenses as a direct result of their investments in big data [32]. See Chart - 1 for details.
Chart -1: Big data survey 2017 by Randy Bean for Harvard Business Review
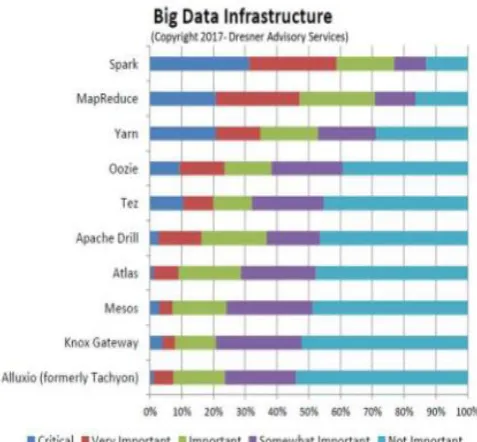
[image:9.595.314.553.398.619.2]Spark, MapReduce, and Yarn are the three most popular software frameworks today. Over 30% of respondents consider Spark critical to their big data analytics strategies. MapReduce and Yarn are "critical" to more than 20 percent of respondents [33]. See the Fig 6 for details.
Fig -6: Dresner Advisory Services Publishes 2017 Big Data Analytics Market Study
© 2018, IRJET | Impact Factor value: 6.171 | ISO 9001:2008 Certified Journal | Page 1957
[image:10.595.276.554.46.393.2]
Fig -7: Dresner Advisory Services Publishes 2017 Big Data Analytics Market Study
Table -1: Companies that are using big data By Eleanor O'Neill, CA Today 23 September 2016 [34]
From the Table 1 it is clear that many companies are already into big data and has achieved lot of progress in their organization success with regards to cost, customer satisfaction, quick and effective response time from their services they provide to customers. However, big data isn’t just being used for cost-cutting. The survey strongly indicates that firms are also undertaking “offensive” efforts that are explicitly intended to change how they do business. After the initial “quick wins” are wrung from cost-reductions, executives are turning their attention to new ways to innovate using data. Further to conclude let us look at the Top 10 sectors using Big Data Analytics an over view by Maruti Techlab [35].
- Banking and Securities – Helps in reducing Fraudulent Transactions;
- Education - To update and upgrade prescribed literature for rapid growth;
- Manufacturing - To enhance Supply Chain Management;
- Insurance - For developing new products and handling claims through analytics;
- Consumer Trade - To predict and manage staffing and inventory requirement;
- Communications and Media - For simultaneous real time reports of several Platforms;
[image:10.595.39.284.77.275.2]© 2018, IRJET | Impact Factor value: 6.171 | ISO 9001:2008 Certified Journal | Page 1958 - Transportation - For better managing traffic plan and
logistics;
- Energy - Helps in measuring Electricity usage with Smart meters;
- Sports - To monitor the performance of individual players and teams by analysis;
4. BIG DATA CHALLENGES
The rate at which big data is generated is outpacing the development of computing and storage systems. According to IDC report by 2020, the amount of data will be sufficient to fill a stack of tablets equivalent to 6.6 times the distance between the earth and the moon. Unsurprisingly managing unstructured data is becoming more and more challenging - 31%in 2015 to 45% in 2016 - as reported by analysts.
Adding to this is the rise of complex data formats like audio, video, documents, social media, and the new smart devices. As per the IDC report, online business transactions will reach up to 450 billion per day. According to a research by Cisco, the number of connected devices will reach 50 billion in just 5 years; all of these will generate a massive amount of data. IDC estimates that by 2020, business transactions (including both B2B and B2C) via the internet will reach up to 450 billion per day. Globally, the number of Smartphone users will grow to 6.1 billion by 2020 (this will overtake the number of basic fixed phone subscriptions). In just 5 years the number of smart connected devices in the world will be more than 50 billion – all of which will create data that can be shared, collected and analyzed.
Big Data is a massive volume of both structured and unstructured data that is so large that it’s difficult to process using traditional database and software techniques. Challenges include analysis, capture, curation, search, sharing, storage, transfer, visualization, and information privacy. As reported by Akerkar (2014) and Zicari (2014), the broad challenges of BD can be grouped into three main categories, based on the data life cycle: data, process and management challenges [36][37]:
Data challenges relate to the characteristics of the data itself (e.g. data volume, variety, velocity, veracity, volatility, quality, discovery and dogmatism).
Process challenges are related to series of how techniques: how to capture data, how to integrate data, how to transform data, how to select the right model for analysis and how to provide the results.
Management challenges cover for example privacy, security, governance and ethical aspects.
Though the benefits of BD are factual and substantial, there remain a plethora of challenges that must be addressed to fully realize the potential of BD. Some of these challenges are a function of the characteristics of BD, some, by its existing
analysis methods and models, and some, through the limitations of current data processing system [38].
Too few people [140,000 to 190,000] with deep analytical skills to fill the demand of Big Data jobs in the U.S. by 2018[39]. 14.9 percent of marketers polled in Crain’s B to B Magazine are still wondering “What is Big Data?” [40]. 39 percent of marketers say that their data is collected “too infrequently or not real-time enough” [41]. 29 percent report that their marketing departments have “too little or no customer/consumer data.” When data is collected by marketers, it is often not appropriate to real-time decision making [41]. The Volume of data is exploding. Every year it will grow in geometric progression; it has been seen in the year 2000 that we had petabytes of data all across the world. According to IBM, It will pass Zeta bytes by 2020. Social media is generating lots of data and over it mobile phones are the main source of generating data every nanosecond [42]. Variety, Combining Multiple Data Sets - We hardly get structured data; generally, we get raw, semi-structured, and unstructured data from all over the web including web pages, search indexes, images, videos, all kinds of multimedia content, social media, messages, e-mails, documents, stream data etc. Data complexity arises with many data types and many data formats in data-sets [43]. Velocity Challenge - In real time, there is the high speed of data coming in and out of the system. One of the important challenges is how to respond to the overflow of information when we know that we don’t have the right technology to handle such overwhelming data flow [44]. Quality and Relevance - It is important to know that if its supervised learning; the data should be in context or in relevance to the problem; otherwise, we can never infer right results. So, determining the quality of data sets and its relevance to a particular case is the challenge [45]. Privacy and Security - In order to find trends in data, we have stopped caring about the security and privacy of an individual. Care should be taken that extracting information to help people should not compromise with their privacy [46]. Scalability -Having unlimited data scalability is challenging, as it is the tendency to process large volumes of data in a single application and in the fastest possible manner. In big data, to be able to scale up and down dynamically on-demand is very crucial. The service to scale up and down is not dynamic and not so easy. We should always take into consideration the pace with which a big data project can grow and evolve. Several times, we persistently have to hold a project to add additional resources and to look into more directions so, that we can see the output we are expecting is there or not and we cut into time for data analysis. It is very difficult to make predictions where resources should be allocated [46], [47].
© 2018, IRJET | Impact Factor value: 6.171 | ISO 9001:2008 Certified Journal | Page 1959 Knowledge discovery, Computational complexities, Scalability
and visualization of data and information security.
The inherent difficulty of big data (including complex types, complex structures, and complex patterns) makes its awareness, depiction, understanding and computation far more challenging and results in sharp increases in the Computational Complexity when compared to traditional computing models based on total data. To address the computational complexity of big data applications, we will need to focus on the whole life cycle of big data applications in order to study data-centric computing paradigms based on the characteristics of big data. Current big data analysis tools have poor performance in handling computational complexities, uncertainty, and inconsistencies. It leads to a great challenge to develop techniques and technologies that can deal computational complexity, uncertainty and inconsistencies in an effective manner.
Knowledge discovery and representation is a prime issue in big data. It includes a number of sub fields such as authentication, archiving, management, preservation, information retrieval, and representation. Incremental techniques have good scalability property in the aspect of big data analysis. As the data size is scaling much faster than CPU speeds, there is a natural dramatic shift in processor technology being embedded with increasing number of cores [49].
Because of the way the human brain processes information, using charts or graphs to visualize large amounts of complex data is easier than poring over spreadsheets or reports. Data visualization is a quick, easy way to convey concepts in a universal manner – and you can experiment with different scenarios by making slight adjustments. Data visualization can also: Identify areas that need attention or improvement; Clarify which factors influence customer behavior; Help you understand which products to place where; Predict sales volumes [50].
In big data analysis massive amount of data are correlated, analyzed, and mined for meaningful patterns. All organizations have different policies to safe guard their sensitive information. Preserving sensitive information is a major issue in big data analysis. There is a huge security risk associated with big data [51]. Therefore, information security is becoming a big data analytics problem. Security of big data can be enhanced by using the techniques of authentication, authorization, and encryption. Various security measures that big data applications face are scale of network, variety of different devices, real time security monitoring, and lack of intrusion system [52], [53]. The security challenge caused by big data has attracted the attention of information security. Therefore, attention has to be given to develop a multi level security policy model and prevention system. Although much research has been carried out to secure big data [52] but it requires lot of improvement. The major challenge is to develop a multi-level security, privacy preserved data model for big data.
[image:12.595.310.551.175.249.2]Year after year, the demand for data scientists and people familiar with big data language and practices are needed in the workplace. IBM predicts that there will be more than 700,000 job openings for these types of specialized positions by 2020. See the Table -2 for details.
Table -2: Job openings analysis by IBM
Putting long-term uses of big data aside, “good enough” information that is available “now” can be used “now” for specific actions (Meyer and others 2013). Big data may not adhere to comprehensive data quality standards, but could still uncover meaningful insights by alerting us that something is happening. One example is sentiment analyses that are used to mine various sources of unstructured data for opinions or trends [54].
5. BIG DATA TRENDS
By 2018, growth in visual discovery tools slows and products rapidly commoditize. By 2020, new cloud pricing models will service specific analytics workloads, contributing to 5x higher spending growth on cloud vs. on-premises analytics. By 2026, G2000 enterprises will have practices to prevent unintended consequences (including non-compliance and ethical issues) derived by cognitive systems [55]. The data are flooding the world at a rate of 40% per year. With the development of the Internet of Things (IoT) has added countless new sources of Big Data into the Data Management landscape and will be one of the major Big Data Trends in 2018 and beyond. Laptops, smart phones, sensors on machines, all generate huge amounts of data for the IoT. Let us look out some of the research papers in Table -3 which highlights the key Big data trends.
[image:12.595.313.556.618.754.2]© 2018, IRJET | Impact Factor value: 6.171 | ISO 9001:2008 Certified Journal | Page 1960 Report from IDC with regards to revenue forecast for
2015-2020 for big data is shown below in the Chart -2 [56].
Chart -2: Revenue forecast 2015-2020 by IDC 2018
Now organizations are transforming their data into useful Business Intelligence, this shows an important opportunity to gain a viable advantage. As Big Data growing, businesses need to find the ways to manage their data for efficiently. Combining the strength of Business Intelligence is the key to stay cutthroat, and Data Analytics is the correct platform to supply the up-to-date information needed. In 2017, few organizations stretched their services and software which in turn translated Big Data into visualizations and graphs; that allowed researchers to gather and coordinate information about the general population more efficiently, and improve the customer experience. It also allows leaders to streamline the decision-making process. Cloud services are also expanding and number of service providers are also increasing in 2018, resulting in competitive pricing, and allowing smaller businesses to access Big Data resources.
People working with Business Intelligence predicted data visualization and data discovery would become an important trend. Data discovery has gone a higher level which shows how to present data, to reveal deeper business insights. As an outcome, visualization models are becoming more and more popular as a way to translate data into useable insights. We as human prefer visual patterns to recognize things more efficiently and easy to understand, our brains has the capacity to process visual patterns with great efficiency. It uses the subconscious in this activity and allows decision makers to process information by quickly scanning it. Convincing visualizations engage the brains’ capacity for pattern recognition, and useful visualization models will become the number one option for processing larger data sets and is one of the significant Big Data Trends in 2018.
Companies who haven’t joined the Hadoop bandwagon as yet (slightly over 50% in 2017, as per the Gartner survey) will be seeking Hadoop deployments. However, in all likelihood, this
will not be on-premise but on a cloud-vendor-of-choice. Typically, on-premise deployments are preferred when the cluster size is huge. Lowering costs and coping with complexity will be the primary motivating factors for cloud-based Hadoop deployments in 2018.
Algorithm markets will also emerge. Forrester surmises that businesses will quickly learn that they can purchase algorithms rather than program them and add their own data. Existing services like Algorithmia, Data Xu, and Kaggle can be expected to grow and multiply [57].
Autonomous agents and things” will continue to be a huge trend, according to Gartner, including robots, autonomous vehicles, virtual personal assistants, and smart advisers. Machine learning is a top strategic trend for 2018, according to Gartner. And Ovum predicts that machine learning will be a necessary element for data preparation and predictive analysis in businesses moving forward.
Businesses using data will see $430 billion in productivity benefits over their competition not using data by 2020, according to International Institute for Analytics [58].
As we move on in to 2019, we’ll see more advancement in Business Intelligence and Artificial Intelligence working even more close to achieve higher levels of competency. Present capabilities of machine-learning systems that are capable of identifying patterns, habits and trends, human decision-makers might soon be a thing of the past.
Easy availability of interactive software in the market has made many organizations and business analysts to move into predictive analytics to precisely forecast future behaviors to improve the organization’s effectiveness and profitability. Predictive analytics is playing a major role and usage in the areas of fraud detection, reducing market risks, optimizing marketing campaigns, and improving business operations.
Big data will face huge challenges around privacy, especially with the new privacy regulation by the European Union. Companies will be forced to address the ‘elephant in the room’ around their privacy controls and procedures. Gartner predicts that by 2018, 50% of business ethics violations will be related to data. Businesses that adopt better data governance strategies will be well-positioned to smoothly navigate potential challenges while keeping a lid on costs.
© 2018, IRJET | Impact Factor value: 6.171 | ISO 9001:2008 Certified Journal | Page 1961 Data Scientist, US$108,000, Data Scientist and Principal Data
Scientist US$133,333. [60].
Researchers also revealed that India would grow to become an $8 billion industry by 2020, generating a need for over 50,000 skilled Big Data experts and data scientists. This is happening as well. Career prospects for people with data science skills and training include data scientist, data engineer, data architect, data administrator, data analyst, business analyst, data or analytics manager and business intelligence manager. Big Data staffing shortages will expand from analysts and scientists to include architects and experts in data management according to IDC.
Finally we got a solution for business community; by having the access to the data and how to use it to accurately predict the needs of their customers. Data could be made accessible in various formats; text, image, and video etc. Big Data is going to be the future and it is predicted to be the most powerful technology that gives answers to many consumer-centric questions that companies are trying to answer these days.
6. CONCLUSIONS
This paper have explained in details about the Big Data and Big Data Analytics methods, technologies used by various companies and what tools are used in the market with its features been explored. Challenges and future trends of Big Data were in depth analyzed with various facts and figures given by the industry experts. Key take away from this article is summarized - In the current scenario Big Data is greatest weapon for the companies to catch in and make their systems talk to each other; access all type of data from different locations around the world in one go with the technology and tools that we have in today’s environment. Companies can use the data collected to their advantage; automating processes, gaining insight into their target market and refining overall performance using the feedback that can be readily available.
Major concern that is associated with data is ensuring its security and integrity. When collecting data, all the necessary security practices should be followed; keeping in mind the huge size of Big Data, companies should be extra careful in managing such data that requires extraordinary efforts. At the end of the day we need to make sure consumer privacy is maintained. Since there are many pathways or channels that are available for the hackers to try and exploit vulnerability in the system increase multifold. Data are quite confidential and due to its criticality, a small mishap can result in huge losses for the company. Typical example will be the recent data leakage from Facebook; hence companies are bound to introduce the best security practices in their systems. Companies that don’t get into the Big Data race till now will soon fade away. With the present scenario most of the business projects now involve Big Data, companies need to have bulletproof strategies in place for day-to-day
operations and keep their system secure from any vulnerability. By using algorithmic recommendations prudently, and maintaining a rigorous understanding of algorithms’ inner workings and the data that informs their decisions we can protect the people privacy. But as a saying goes in today’s world nothing is safe. For policymaking, the quality assessment of indicators derived from big data will be crucial to minimize governance, political, and reputational risks. With 62% of companies planning to implement Machine Learning and Big Data principles in the coming year, organizations must find the most effective tools to keep their team members organized with all the coming changes. Future prediction is difficult, since anything can happen; but race to copycat elements of human intelligence, led by leading companies like Microsoft, IBM, Google, Facebook, Amazon and Baidu, all with heavy financial backup they are investing heavily on Big Data, so it is clear that “Big data” in the very near future. Building upon the research finding in this paper, further research can be carried out in future.
REFERENCES
[1] Ashish Nadkarni, Dan Vesset. (2016), Worldwide Big
Data Technology and Services Forecast, 2016–2020, DEC 2016 - MARKET FORECAST - DOC # US40803116,
accessed 14 May 2018,
<https://www.idc.com/getdoc.jsp?containerId=US4080 3116>
[2] Louis Columbus. (2016), Roundup Of Analytics, Big Data
& BI Forecasts And Market Estimates, 2016, accessed 14
May 2018,
<https://www.forbes.com/sites/louiscolumbus/2016/0 8/20/roundup-of-analytics-big-data-bi-forecasts-and-market-estimates-2016/#27e44faf6f21>
[3] Data Science vs. Big Data vs. Data Analytics 2018,
simplilearn, accessed 14 May 2018, <https://www.simplilearn.com/data-science-vs-big-data-vs-data-analytics-article>
[4] Big Data Analytics What it is and why it matters, SAS,
accessed 14 May 2018,
https://www.sas.com/en_us/insights/analytics/big-data-analytics.html
[5] Vangie Beal. (2018), Big Data Analytics, accessed 10
May 2018,
<https://www.webopedia.com/TERM/B/big_data_analy tics.html>
[6] J. Manyika, C. Michael, B. Brown et al., “Big data: The next
frontier for innovation, competition, and productivity,” Tech. Rep., Mc Kinsey, May 2011.
[7] J. Manyika, M. Chui, B. Brown et al., “Big data: the next
© 2018, IRJET | Impact Factor value: 6.171 | ISO 9001:2008 Certified Journal | Page 1962
[8] Rick Whiting. (2018), 2018 Big Data 100: The 10 Coolest
Data Science And Machine Learning Tools, accessed 10 May 2018, <https://www.crn.com/slide- shows/applications-os/300102941/2018-big-data-100- the-10-coolest-data-science-and-machine-learning-tools.htm?itc=refresh>
[9] A COMPLETE LIST OF BIG DATA ANALYTICS TOOLS TO
MASTER IN 2018, accessed 10 May 2018, <https://www.norjimm.com/blog/big-data-analytics-tools-to-master-2018/>
[10] Amit Verma (2018), Top 10 Open Source Big Data Tools
in 2018, accessed 10 May 2018, <https://www.whizlabs.com/blog/big-data-tools/>
[11] Top 11 Big Data Analytics Tools in 2018, accessed 10
May 2018, <https://www.guru99.com/big-data-analytics-tools.html>
[12] Data Flair. (2018), 10 Best Big Data Analytics Tools for
2018, accessed 11 May 2018, <https://data-flair.training/blogs/best-big-data-analytics-tools/>
[13] Assuncao,M. D., Calheiros, R. N., Bianchi, S., Netto, M. A.,
& Buyya, R. (2015). Big Data computing and clouds: trends and future directions. Journal of Parallel and Distributed Computing, 79, 3–15.
[14] Gil Press. (2016), Top 10 Hot Big Data Technologies,
accessed 11 May 2018,
<https://www.forbes.com/sites/gilpress/2016/03/14/ top-10-hot-big-data-technologies/#36896a265d7b>
[15] Waller, M. A., & Fawcett, S. E. (2013). Data science,
predictive analytics, and big data: a revolution that will transform supply chain design and management. Journal of Business Logistics, 34(2), 77–84.
[16] Fan, J., Han, F., & Liu, H. (2014). Challenges of big data
analysis. National ScienceReview, 1(2), 293–314.
[17] Big Data Analytics: Its Technologies and Tools 2017,
Maruti Techlabs, accessed 11 April 2018, <https://towardsdatascience.com/big-data-analytics-its-technologies-and-tools-e77f9bd0d37c>
[18] Joseph, R. C., & Johnson, N. A. (2013). Big data and
transformational government. IT Professional, 15(6), 43–48.
[19] Bihani, P., & Patil, S. T. (2014). A comparative study of
data analysis techniques. International Journal of Emerging Trends & Technology in Computer Science, 3(2), 95–101.
[20] Rehman, M. H., Chang, V., Batool, A., & Teh, Y. W. (2016).
Big data reduction framework for value creation in sustainable enterprises. International Journal of Information Management (Accepted).
[21] Banerjee, A., Bandyopadhyay, T., & Acharya, P. (2013).
Data analytics: hyped up aspirations or true potential. Vikalpa. The Journal for Decision Makers, 38(4), 1–11.
[22] Xu, J. S., Zhang, E., Huang, C. -H., Chen, L. H. L., & Celik, N.
(2014). Efficient multi-fidelity simulation optimization. Proceedings of 2014 winter simulation conference. GA: Savanna.
[23] Szongott, C., Henne, B., & von Voigt, G. (2012). Big data
privacy issues in public social media. 6th IEEE international conference on digital ecosystems technologies (DEST) (pp. 1–6).
[24] Spiess, J., T'Joens, Y., Dragnea, R., Spencer, P., &
Philippart, L. (2014). Using big data to improve customer experience and business performance. Bell Labs Technical Journal, 18(4), 3–17.
[25] Chung, W. (2014). BizPro: Extracting and categorizing
business intelligence factors from textual news articles. International Journal of Information Management,34(2), 272–284.
[26] Jiang, J. (2012). Information extraction from text. In C. C.
Aggarwal, & C. Zhai (Eds.),Mining text data (pp. 11–41). United States: Springer.
[27] Lu, R., Zhu, H., Liu, X., Liu, J. K., & Shao, J. (2014). Toward
efficient and privacy-preserving computing in big data era. IEEE Network, 28(4), 46–50.
[28] Hirschberg, J., Hjalmarsson, A., & Elhadad, N. (2010).
“You’re as sick as you sound”: Using computational approaches for modeling speaker state to gauge illnessand recovery. In A. Neustein (Ed.), Advances in speech recognition (pp. 305–322).United States: Springer.
[29] Patil, H. A. (2010). “Cry baby”: Using spectrographic
analysis to assess neonatalhealth status from an infant’s cry. In A. Neustein (Ed.), Advances in speech recog-nition (pp. 323–348). United States: Springer.
[30] Margaret Rouse. (2017), Data visualization, accessed 11
April 2018,
<https://searchbusinessanalytics.techtarget.com/defini tion/data-visualization>
[31] Big Data Integration, Information builders, accessed 11
April 2018,
<https://www.informationbuilders.com/big-data-integration>
[32] Randy Bean. (2017), How Companies Say They’re Using