An Approach of Trustworthiness Evaluation of
Software Behavior Based on Multidimensional
Fuzzy Attributes
Zhen Li and Junfeng Tian
College of Mathematics and Computer, Hebei University, Baoding, 071002, China Email: [email protected], [email protected]
Abstract—In order to increase the accuracy of trustworthiness evaluation of software, the paper improves the traditional construction process of the expected behavior trace of software and proposes an approach of trustworthiness evaluation of software behavior based on multidimensional fuzzy attributes. First, training samples of the same monitoring point are clustered based on multidimensional fuzzy attributes to construct a more accurate expected behavior trace of software. Second, an improved weight distribution method of multidimensional fuzzy attributes is presented based on correlation coefficient and standard deviation integrated approach (CCSD) for weight distribution of attributes in multiple attribute decision making. The improved weight distribution method is suitable for one-class samples from monitoring point and it considers both the dispersion of fuzzy attribute’s value and the influence among these fuzzy attributes. Finally, experiments and analyses show that: ① the expected behavior trace of software constructed by training after clustering is more accurate than without clustering; and ② our improved weight distribution method of multidimensional fuzzy attributes has better effect of trustworthiness evaluation than CCSD and other methods of weight distribution for one-class samples.
Index Terms—software behavior, trustworthiness evaluation, fuzzy attribute, clustering, weight distribution
I. INTRODUCTION
With continuous deepening of the application of software in the sensitive fields such as finance, military affairs and economy, the requirement of software trustworthiness becomes more urgent. How to ensure high confidence of software during software development and running has become an important research direction of software theory and technology [1]. If the software behavior is always accordant with the expected behavior, we call the software is trustworthy [2]. For trustworthy software, the behavior and results can be expected and the behavior states can be monitored when it runs.
The expected behavior trace of software is usually
composed of a sequence of monitoring points and events or actions causing monitoring points’ transition. The common monitoring points are system call, function module, component, etc. The fine-grained monitoring points result in a high degree of trustworthiness, but with low software running efficiency. Therefore, the monitoring points should be set by comprehensively considering the needs of the degree of trustworthiness and software running efficiency in actual application. For each monitoring point, there are a group of attributes describing the expected running situation when the software runs to it. It is very important to study the multidimensional attributes of monitoring points for the trustworthiness evaluation of software behavior.
II.RELATED WORK
Because system call is the interface provided by the operating system to access system resources, system call has become the important monitoring point of software behavior. A lot of software behavior automaton models based on system call have appeared, such as finite state automaton (FSA) model and pushdown automaton (PDA) model built by static analysis of source code [3], Vt-Path model built by dynamic learning [4], HPDA model combining static analysis with dynamic learning [5], context-sensitive Dyck model [6], HFA model with static-dynamic hybrid approach [7] and the model with dataflow analysis [8]. These models can describe the running trace of software and some of them introduce arguments policies and context attributes for system call. Jones [9]and Pu et al. [10]involve time interval attribute of system calls as the criteria for determining abnormal from normal signatures. In our previous work [11], we evaluate the trustworthiness of software by several attributes of monitoring points, such as function, arguments policies, context, timestamp, memory occupancy rate and CPU occupancy rate. Li et al. [12] monitor the software behavior from the aspects of availability, reliability and security and consider many attributes such as CPU occupancy rate, IP transmission efficiency, memory occupancy rate, bandwidth utilization, average throughput, and the number of illegal connections.
The above attributes of software monitoring point can be divided into two categories: deterministic attributes
and fuzzy attributes. For deterministic attributes, once any of them deviates from the normal value, the monitoring point is determined to be untrustworthy directly. These attributes include function, arguments policies, context, etc. Fuzzy attributes cannot be expressed as accurate numbers. They are fuzzy and granted the prescribed error bounds. These attributes include CPU occupancy rate, IP transmission efficiency, memory occupancy rate, time interval, etc. The above references construct the expected behavior of software monitoring points by running the software many times in the training phase, and take all samples of the same monitoring point as one training set. The sample values of a fuzzy attribute for the same monitoring point can vary obviously because the path from last monitoring point to the current monitoring point can vary. Therefore, the expected behavior trace trained by the above approaches is inaccurate.
According to the feature of deterministic attributes, weight distribution is meaningless for deterministic attributes. If all the deterministic attributes of the monitoring point are trustworthy, the trustworthiness of monitoring point depends on its fuzzy attributes and the weight distribution method of fuzzy attributes determines the accuracy of trustworthiness evaluation directly for monitoring point and then for software. The common methods can be grouped roughly into three categories: subjective [13-15], objective [16,17] and integrated [18,19]. Because it is difficult to determine the weights of fuzzy attributes for monitoring point from the subjective experience, we mainly consider the objective methods. Li et al. [12] determine the weight of attributes by information entropy theory which makes the results be objective and adaptive relatively. Wang et al. [20] propose a feature weight learning algorithm which gives each feature a feature weight by minimizing the feature evaluation index through gradient descent technique. Wang et al. [21] propose a correlation coefficient and standard deviation integrated approach (CCSD) for determining the weights of attributes in multiple attribute decision making. The training samples for weight distribution used in these approaches either belong to different classes or are alternative schemes for multiple attribute decision making. While, the training samples for one monitoring point belong to the same class, the above methods cannot be used to the weight distribution of one-class samples. The methods of weight distribution for one-class samples are less currently. Information entropy [22,23] can be a solution and its basic idea is to determine the weight of each attribute according to the attribute’s information entropy for one-class samples. The smaller attribute’s information entropy means that the sample data is more regular, and the model constructed is better, so the weight of the attribute is larger, and vice versa. However, information entropy only considers the dispersion of attribute value, and doesn’t involve the influence among these attributes. The methods of weight distribution for one-class samples need to improve greatly. On the basis of the above problems, this paper presents an approach of trustworthiness evaluation of software
behavior based on multidimensional fuzzy attributes. First, the expected behavior of software monitoring points is constructed for each class of samples according to the clustering results based on multidimensional fuzzy attributes. Second, an improved weight distribution method of multidimensional fuzzy attributes is proposed based on CCSD method for determining the weights of attributes in multiple attribute decision making. Both the dispersion of attribute value and the influence among these attributes are considered, which ensures the better effect of trustworthiness evaluation.
III. CLUSTERING BASED ON MULTIDIMENSIONAL FUZZY
ATTRIBUTES
In the training phase, the sample values of a fuzzy attribute for the same monitoring point can vary obviously because the path from last monitoring point to the current monitoring point can vary. Therefore, the expected behavior trace constructed is inaccurate if all samples of the same monitoring point are taken as one training set. We solve the problem by clustering these samples based on multidimensional fuzzy attributes.
For n samples X X1, 2,...,Xn of monitoring point mp,
each sample has m fuzzy attributes A A1, 2,...,Am, denoted
by sample matrix X=( )xij n m× (1≤ ≤i n,1≤ ≤j m). These
samples are clustered by a clustering algorithm based on entropy [24].
For monitoring point mp, the clustering process of n samples is as follows:
① Number each sample as a class Ck, where 1≤ ≤k m
and Ck is composed of Nk samples.
② Choose any sample, add it to another class, and compute the entropy of Ck after adding the sample to it
according to (1) (h is the smoothing coefficient). The sample is allocated to the class which has the smallest added value of entropy.
2 2 2
1 1
( )( )
1
( ) log[ exp( )]
(2 ) 2
k k T
N N
i j i j
k m m
i j k
x x x x
H C
N h h
π = =
− −
= −
∑∑
− (1)③ Number the classes again after allocating samples.
④ Repeat ② and ③ until there is no class which has only one sample.
⑤ Compute the between-class entropy of any two classes according to (2) and merge two classes with smallest between-class entropy. The number of classes and samples for each class must be also modified.
2 2 2 2
1 1
( )( )
1
( , ) log[ ( , ) exp( )]
(2 ) 2
T n n
i j i j i j m m i j
i j i j
x x x x
H C C M x x
N N h h
π = =
− −
= −
∑∑
−(2) ( , )i j
M x x in (2) is as follows:
1, , ,
( , ) 0,
i i j j i j j i
i j
x C x C or x C x C
M x x
else
∈ ∈ ∈ ∈
⎧⎪ = ⎨
⎪⎩ . (3)
more significant than before, the classes at this time, represented as C C1, 2,...,CM (M is the number of classes),
are the result of clustering.
IV. TRUSTWORTHINESS EVALUATION OF SOFTWARE
BEHAVIOR
A. Trustworthy Degree of Training Sample
For the training samples Y Y1q, 2q,...,Ynq' of class
(1 )
q
C ≤ ≤q M , let y1qj,y2qj,...,yn jq' be n' sample values of
the fuzzy attribute Aj. After removing various effects of the environment, fuzzy attributes are approximately normally distributed [25] and the normal value of each fuzzy attribute fluctuates around the average value. Therefore, we can determine the trustworthy degree of fuzzy attribute according to the degree of deviation from the average value. The average value q
j
μ of fuzzy attribute Aj is as follows:
'
1
(n )/ '
q q j ij i y n μ =
=
∑
. (4)The trustworthy degree q ij
d of fuzzy attribute Ajfor training sample q
i
Y (1≤ ≤i n')is as follows:
, [ min , ]
1 , [ , max ]
max max q
ij q q q
ij j j
q j q
ij q q
j ij q q q
ij j j
q q j j y y y d y y y y y μ μ μ μ ⎧ ∈ ⎪ ⎪ = ⎨ ⎪ + − ∈ ⎪ ⎩
, (5)
where
1 '
minq min{ }q
j ij i n y y ≤ ≤ = , 1 '
maxq max{ }q
j ij i n y y ≤ ≤ = , 1, 2,...,
j= m.
From (5), we can see q [0,1] ij
d ∈ . The trustworthy
degree q i
d of training sample q i
Y is
1
m
q q q
i j ij
j
d w d
=
=
∑
,where q j
w is the weight of fuzzy attribute Aj for class Cq.
B. Trustworthiness Evaluation
In the test phase, for the test sample Z of software
monitoring point mp, let z z1, ,...,2 zm be the values of m fuzzy attributes. The trustworthy degree q
j
d of fuzzy
attribute Ajfor class Cq is as follows:
, [ min , ]
1 , [ , max ]
max max 0,
j q q
j j j
q j
q
j j
q q q
j q q ij j j
j j
z
z y
z
d y y
y y else μ μ μ μ ⎧ ∈ ⎪ ⎪ ⎪ ⎪ =⎨ + − ∈ ⎪ ⎪ ⎪ ⎪⎩ . (6)
The trustworthy degree q
d of test sample Z for class
q C is:
1
m
q q q
j j
j
d w d
=
=
∑
. For software monitoring point mp,the trustworthy degree d of test sample Z is :
1max{ }
q q M
d d
≤ ≤
= .
For given threshold of trustworthy degree τ , if [ ,1]
d∈τ , the software monitoring point mp is trustworthy; if d<τ, mp is untrustworthy. The degree of untrustworthy is increased as the deviation degree from 1 increases. When any software monitoring point is reported to be untrustworthy, the software stops running. C. An Improved Weight Distribution Method of
Multidimensional Fuzzy Attributes (Improved CCSD) For the clustered samples, the weights of fuzzy attributes are very important to the accuracy of trustworthiness evaluation for monitoring point. CCSD method [21] for determining the weights of attributes in multiple attribute decision making considers attributes with big standard deviations should be given more important weights than those attributes with small standard deviations. However, this property is not suitable for the weight distribution of fuzzy attributes of monitoring points. We solve the problem and give an improved CCSD method for monitoring points.
For the training samples 1q, 2q,..., q' n
Y Y Y of class Cq, the standard deviation q
j
σ of fuzzy attribute Aj is as follows:
'
2
1
[n ( ) ] / ( ' 1)
q q q
j ij j
i
y n
σ μ
=
=
∑
− − . (7)The smaller standard deviation means that the sample data is more centralized, and the ability to describe normal behavior is stronger, so the weight of fuzzy attribute Aj is larger, and vice versa.
When fuzzy attribute Aj is dropped out, the
trustworthy degree qj i
d of sample q i
Y is:
1,
m
qj q q
i k ik
k k j
d w d
= ≠
=
∑
. The correlation coefficient q jR
between q ij
d and q i
d is as follows:
' 1 ' ' 2 2 1 1 ( )( ) ( ) ( ) n
q q qj qj
ij j i
q i
j
n n
q q qj qj
ij j i
i i
d d d d R
d d d d
− − = − − = = − − = − ⋅ −
∑
∑
∑
, (8)
where '
1 1 ' n q q j ij i d d n − = =
∑
, ' 1 1 ' n qj qj i i d d n − = =∑
.If q j
R is high enough and close to one, then fuzzy
attribute Aj has little effect on the trustworthiness of the sample and it can therefore be assigned a very small weight. If q
j
R is very low, say close to minus one, then
trustworthiness of the sample and it should be given a very important weight.
We integrate the standard deviation and correlation coefficient and define the weights of fuzzy attributes as follows:
1
1
1
q q
j j
q
j m
q q
k k
k
R w
R
σ
σ
=
− =
−
∑
. (9)Equation (9) is a system of nonlinear equations. It contains m equations, which can uniquely determine m weight variables. To solve the equation, we convert it into the following nonlinear optimization model for solution:
Minimize 2
1
1
1
( )
1
q q
m
j j
q
j m
q q
j
k k
k
R J w
R
σ
σ
=
=
−
= −
−
∑
∑
, subject to1
1 m
q j j
w
=
=
∑
, q 0j
w ≥ , which can be solved by LINGO
software and at optimality the objective function value
* 0
J = .
V. EXPERIMENTS AND ANALYSIS
A. Test of Clustering Based on Multidimensional Fuzzy Attributes
We have performed experiments on a PC with Intel (R) Core (TM)2 Duo E7500 2.93 GHz and 2 GB of main memory running Linux kernel 2.4.20. The grain of monitoring point is set to system call. Each system call is intercepted by loadable kernel module (LKM) and modified to capture the attributes’ values of the system call. Because the trustworthiness of deterministic attributes determines the trustworthiness of monitoring point directly, we mainly discuss the effect of fuzzy attributes on the trustworthiness of monitoring point.
Software vi6.1 is the editor in Red Hat 9 Linux. In clean environment, we capture 15 samples along three different paths in a monitoring point of software vi6.1 where three paths converge. Three fuzzy attributes time interval, memory variation and CPU variation are involved and they are the absolute value of difference of time, memory occupancy rate and CPU occupancy rate respectively between the current monitoring point and last monitoring point, as shown in Table I. Table II shows the fuzzy attributes’ values of two normal traces and two abnormal traces in the monitoring point for test.
The experiment clusters the training samples based on multidimensional fuzzy attributes. Let smoothing coefficient h be 0.5. The result of clustering is: C1:{1,2,3,4,5,6}, C2:{7,8,9,10}, C3:{11,12,13,14,15}. Suppose the weight of each fuzzy attribute is equal and let the threshold of trustworthy degree τ be 0.85, the trustworthy degrees of test samples without clustering and after clustering for each class are shown in Table III. After clustering, the trustworthy degree of test sample is the maximum of the trustworthy degrees for all classes, that is, the trustworthy degree of Normal 1, Normal 2,
TABLE I.
MULTIDIMENSIONAL FUZZY ATTRIBUTES’VALUES FOR TRAINING SAMPLES
Training sample
Time interval(μs)
Memory variation(%)
CPU variation(%) 1 11 9.2 10.2 2 12 9.4 9.4 3 11 8.3 9.8 4 11 10.1 8.5 5 12 10.7 10.0 6 11 10.2 9.6 7 25 9.8 8.7 8 27 8.3 9.3 9 23 8.8 9.6 10 25 10.2 10.0 11 50 16.5 20.1 12 53 16.7 21.4 13 52 18.0 21.8 14 51 16.4 20.5 15 53 17.8 20.9
TABLE II.
MULTIDIMENSIONAL FUZZY ATTRIBUTES’VALUES FOR TEST SAMPLES Test sample interval(Time μs) variation(%) Memory variation(%)CPU
Normal 1 12 10.4 9.9
Normal 2 52 17.9 21.6
Abnormal 1 40 19.3 9.5
Abnormal 2 69 25.6 24.9
TABLE III.
THE TRUSTWORTHY DEGREES OF TEST SAMPLES
Test sample
Trustworthy degree Without
clustering Class C1 Class C2 Class C3
Normal 1 0.68 0.95 0.77 0.44
Normal 2 0.62 0 0 0.97
Abnormal 1 0.70 0 0.48 0.70
Abnormal 2 0.32 0 0 0.67
Abnormal 1 and Abnormal 2 is 0.95, 0.97, 0.70 and 0.67 respectively. Without clustering, two normal traces are determined to be untrustworthy by mistake. While, after clustering, the trustworthiness of both two normal traces and two abnormal traces are determined correctly. Therefore, the expected behavior trace of software is construsted more accurately by training after clustering. B. Comparison of Weight Distribution Methods
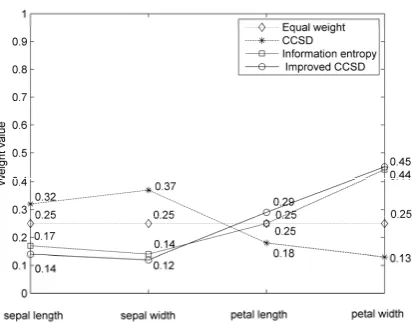
Our experiment uses machine learning databases (MLDBs) from UCI Repository [26] including lots of different databases. We select Iris database which has three classes (setosa, versicolor and virginica). Each class has 50 samples and each sample has four attributes (sepal length, sepal width, petal length and petal width) which are all continuous real variables. There is a great difference between the attributes’ values of class setosa and other two classes; While, there is little difference between the attributes’ values of class versicolor and class virginica.
Figure 1. The weights of attributes for class setosa.
Figure 2. The weights of attributes for class versicolor.
versicolor respectively. For class setosa, there is little difference among the correlation coefficients of four attributes in the improved CCSD, so the weights of attributes mainly depend on the standard deviation. The results of improved CCSD and information entropy are without big difference. For class versicolor, there is a great difference among the correlation coefficients of four attributes in the improved CCSD, so the correlation coefficient has a great influence on the weights of attributes. The results of improved CCSD and information entropy have larger difference.
Let the threshold of trustworthy degree τ be 0.85. In the first experiment, we take the training samples of class setosa as training samples and take the test samples of class setosa, all samples of class versicolor and versicolor as test samples. Because there is a great difference between the attributes’ values of class setosa and other
two classes, all test samples of class setosa are determined to be trustworthy and all samples of class versicolor and virginica are determined to be untrustworthy correctly for the four weight distribution methods. In the second experiment, we take the training samples of class versicolor as training samples and take the test samples of class versicolor, all samples of class setosa and virginica as test samples. The test results of four weight distribution methods are shown in Table IV. For the test samples of class versicolor, the test results of four weight distribution methods are same. For samples of class setosa, the evaluation results of four weight distribution methods are same and have no misjudgment samples; For the average of trustworthy degree of four weight distribution methods, improved CCSD has the smallest average of trustworthy degree which means the largest degree of deviation, so it can determine the untrustworthy sample most easily. For samples of class virginica, the evaluation results of improved CCSD have the smallest misjudgment samples and the smallest average of trustworthy degree; the second is information entropy. CCSD for determining the weights of attributes in multiple attribute decision making is the worst one. Therefore, our improved CCSD has better effects for trustworthiness evaluation.
VI. CONCLUSION
The paper proposes an approach of trustworthiness evaluation of software behavior based on multidimensional fuzzy attributes. It clusters the samples of the same monitoring point based on multidimensional fuzzy attributes to construct a more accurate expected trace of software. For a better trustworthiness evaluation effect, the paper proposes an improved weight distribution method of multidimensional fuzzy attributes based on CCSD method for weight distribution of attributes in multiple attribute decision making. The improved weight distribution method is suitable not only for the multidimensional fuzzy attributes of monitoring points, but also for any weight distribution according to one-class samples, so it is of widespread usage. Our future work is to consider the selection of multidimensional fuzzy attributes for monitoring points to achieve a better effect for trustworthiness evaluation of software.
REFERENCES
[1] H. W. Chen, J. Wang, and W. Dong, “High Confidence Software Engineering Technologies”, Acta Electronica Sinica, vol. 31, no. 12A, 2003, pp. 1933-1938. (in
Chinese)
TABLE IV.
TEST RESULTS OF THE SECOND EXPERIMENT
The class of test sample
The average of trustworthy degree Number of trustworthy samples determined /Number of Total samples Equal
weight CCSD
Information entropy
Improved CCSD
Equal weight CCSD
Information entropy
Improved CCSD
versicolor 0.94 0.94 0.94 0.94 4/5 4/5 4/5 4/5
setosa 0.54 0.61 0.51 0.48 0/50 0/50 0/50 0/50
[2] K. Liu, Z. G. Shan, J. Wang, J. F. He, Z. T. Zhang, and Y. W. Qin, “Overview on Major Research Plan of Trustworthy Software”, Bulletin of National Natural Science Foundation of China, vol. 22, no. 3, 2008, pp.145-
151. (in Chinese)
[3] D. Wagner and D. Dean, “Intrusion Detection via Static Analysis”, Proc. IEEE Symp. on Security and Privacy,
IEEE Computer Society, May 2001, pp.156-169, doi: 10.1109/SECPRI.2001.924296.
[4] H. H. Feng, O. M. Kolesnikov, P. Fogla, L. Wenke, and G. Weibob, “Anomaly Detection Using Call Stack Information”, Proc. IEEE Symp. on Security and Privacy,
2003, pp.62-75, doi: 10.1109/SECPRI.2003.1199328 . [5] Z. Liu, S. M. Bridges, and R. B. Vaughn, “Combining
Static Analysis and Dynamic Learning to Build Accurate Intrusion Detection Models”, Proc. of the 3rd IEEE Int’1 Workshop on Information Assurance, College Park, March 2005, pp.164-177, doi: 10.1109/IWIA.2005.6.
[6] J. Giffin, S. Jha, and B. Miller, “Efficient context-sensitive intrusion detection”, Proc. of the 11th Network and Distributed System Security Symposium, San Diego, USA,
2004, pp.1-15.
[7] W. Li, Y. X. Dai, Y. F. Lian, and P. H. Feng, “Context Sensitive Host-Based IDS Using Hybrid Automaton”,
Journal of Software,vol.20, no.1, 2009, pp.138-151. (in
Chinese)
[8] B. Sandeep, C. Abhishek, and R. Sekar, “Dataflow Anomaly Detection”, Proc. of the 2006 IEEE Symposium on Security and Privacy, 2006, pp. 48-62, doi:
10.1109/SP.2006.12.
[9] A. Jones and S. Li, “Temporal Signatures for Intrusion Detection”, Proc. of 17th Annual Computer Security Applications Conference, Dec. 2001, pp. 252 - 261, doi: 10.1109/ACSAC.2001.991541.
[10] S. Pu and B. Lang, “An Intrusion Detection Method Based on System Call Temporal Serial Analysis”, Proc. of the 3rd International Conference on Intelligent Computing,
2007, pp. 656-666, doi: 10.1007/978-3-540-74171-8_65. [11] J. F. Tian, Z. Li, and Y. L. Liu, “A Design Approach of
Trustworthy Software and Its Trustworthiness Evaluation”,
Journal of Computer Research and Development, vol.48,
no.8, 2011.(in Chinese)
[12] X. Y. Li, X. L. Gui, Q. Mao, and D. Q. Leng, “Adaptive Dynamic Trust Measurement and Prediction Model Based on Behavior Monitoring”, Chinese Journal of Computers,
vol.32, no.4, 2009, pp. 664-674. (in Chinese)
[13] F. H. Barron, “Selecting a Best Multiattribute Alternative with Partial Information about Attribute Weights”, Acta Psychologica, vol. 80, 1992, pp.91-103, doi: 10.1016/0001-6918(92)90042-C.
[14] M. Deng, W. Xu, and J. B. Yang, “Estimating the Attribute Weights through Evidential Reasoning and Mathematical Programming”, International Journal of Information Technology & Decision Making, vol. 3, 2004, pp. 419-428,
doi: 10.1142/S0219622004001124.
[15] B.S. Ahn, and KxS. Park, “Comparing Methods for Multiattribute Decision Making with Ordinal Weights”,
Computers & Operations Research, vol. 35, no. 5, 2008, pp. 1660-1670, doi:10.1016/j.cor.2006.09.026.
[16] H. Deng, C. H. Yeh, and R. J. Willis, “Inter-company Comparison Using Modified TOPSIS with Objective Weights”, Computers & Operations Research, vol. 27,
2000, pp. 963-973, doi: 10.1016/S0305-0548(99)00069-6. [17] G.W. Wei, “Maximizing Deviation Method for Multiple
Attribute Decision Making in Intuitionistic Fuzzy Setting”,
Knowledge-Based Systems, vol. 21, no.8, 2008, pp.
833-836, doi: 10.1016/j.knosys.2008.03.038.
[18] J. Ma, Z. P. Fan, and L. H. Huang, “A Subjective and Objective Integrated Approach to Determine Attribute Weights”, European Journal of Operational Research, vol.
112, 1999, pp. 397-404, doi: 10.1016/S0377-2217(98)00141-6.
[19] Y. M. Wang, and C. Parkan, “A General Multiple Attribute Decision-making Approach for Integrating Subjective Preferences and Objective Information”, Fuzzy Sets and Systems, vol. 157, 2006, pp. 1333-1345, doi:
10.1016/j.fss.2005.11.017.
[20] L. J. Wang, S. Y. Guan X. L. Wang, and X. Z. Wang, “Fuzzy C Mean Algorithm Based on Feature Weights”,
Chinese Journal of Computers, vol.29, no.10, 2006,
pp.1797-1803. (in Chinese)
[21] Y. M. Wang, and L. Ying, “Integration of Correlations with Standard Deviations for Determining Attribute Weights in Multiple Attribute Decision Making”,
Mathematical and Computer Modeling, vol. 51, 2010, pp.
1-12, doi: 10.1016/j.mcm.2009.07.016.
[22] H. Zhang, H. L. Bian, L. F. Wu, Y. S. Zhang, M. W. Cui, and Q. K. Zeng, “Study on Program Behavior Control Based on LSM”, Journal of Software, vol.16, no.6, 2005,
pp.1151-1158. (in Chinese)
[23] J. F. Tian and Y. Zhu, “Trusted Shell Based Constitution Model of Trusted Software”, China Communications, vol.
8, no. 4, 2011, pp.11-22.
[24] H. C. Wang and H. Peng, “A Clustering Algorithm Based on Entropy”, Computer Science, vol. 34, no. 11, 2007, pp.
178-180. (in Chinese)
[25] R. J. Larsen and M. L. Marx, An Introduction to Mathematical Statistics and Its Applications, Pearson Prentice Hall, 2006.
[26] UCI Repository of machine learning databases, http://archive.ics.uci.edu/ml/index.html, 1998.
Zhen Li, born in Baoding, China, 1981, received M.S. degree of computer application from Hebei University, Baoding, China in 2006.
She is a lecturer of the College of Mathematics and Computer of Hebei University. In the past five years, she has published over 10 technical papers in refereed journals and conference proceedings. Her current research interests include computer security, trust computing and distributed computing.
Junfeng Tian, born in Baoding, China, 1965, received Ph.D degree of computer science from University of Science and Technology of China, Hefei, China in 2004.
He is a professor of Computer Science at Hebei University. In the past five years, he has published over 30 technical papers in refereed journals and conference proceedings. His research interests include network security, trust computing, distributed computing and wireless sensor network.