International Journal of Computer Applications (0975 – 8887) Volume 46– No.22, May 2012
Maximum-Likelihood Equalisation for STBC-MIMO on
Test-Bed
Ashu Taneja
Assistant Professor
Department of Electronics & Communication Engineering Chitkara University, Baddi.
ABSTRACT
This paper deals with the design and implementation of Maximum Likelihood (ML) Estimation method for a MIMO system utilising Space-time block coding (STBC) based on Alamouti transmitter diversity scheme. The design is modelled using MATLAB to derive the required specifications. The code is simulated, synthesized and implemented on Test bed for real-time analysis. The performance of STBC- MIMO is evaluated on the basis of Bit Error Rate (BER) and Symbol Error Rate (SER) for different types of modulations.
Keywords
STBC, MIMO, ML, BER , SER , SNR.
1. INTRODUCTION
Future Wireless communication systems will aim to integrate features such as high data rates, high quality of service, spectral efficiency and reliability. In recent years, wireless communication has taken peak state. This increased demand has led to the demand for higher network capacity and performance. Higher bandwidth, optimized modulation offer practically limited potential to increase the spectral efficiency [1]. Hence, MIMO systems has emerged as an attractive technique for achieving high-bit-rate data transmission with high bandwidth efficiency. In order to make them more reliable, several transmitter and receiver diversity techniques utilizing space-time or space-frequency codes can be used. Alamouti-based space-time coding technique is one of the most effective transmitter diversity methods[2][3].
The wireless communication channel is mainly characterized as a doubly selective channel, i.e. it is both selective in time and in frequency. While multi-path propagation gives rise to frequency selectivity, mobility and/or carrier frequency offset give rise to time-selectivity[4][5]. The frequency-selectivity implies inter-symbol interference (ISI), i.e. the transmitted signal is spread in time. On the other hand, time-selectivity results in spreading of the transmitted signal in the frequency-domain, or the so-called Doppler spread. Therefore, in order to provide reliable communication, advanced and efficient channel equalization techniques are necessary. Equalizers in general can be classified according to their structure, namely as linear or nonlinear (e.g. decision feedback) equalizers[6]. Equalizers can also be classified according to the optimization criterion. Namely, equalizers can be classified as zero-forcing (ZF), when a ZF solution is sought, or minimum mean-squared error (MMSE) when the equalizer optimizes the mean-squared error (MSE) of the symbol estimate, or maximum likelihood (ML) when the maximum-likelihood sequence estimation (MLSE) criterion is
method for MIMO system using Alamouti-based STBC technique is proposed and implemented on Test-Bed for real time analysis. The organization of the paper is as follows. Section 2 describes the system model of STBC-MIMO system. Section 3 gives maximum-likelihood equalisation. Section 4 provides the specifications of the Test Bed. Simulation results and discussion is presented in Section 5. Conclusion is given in Section 6.
2. SYSTEM MODEL
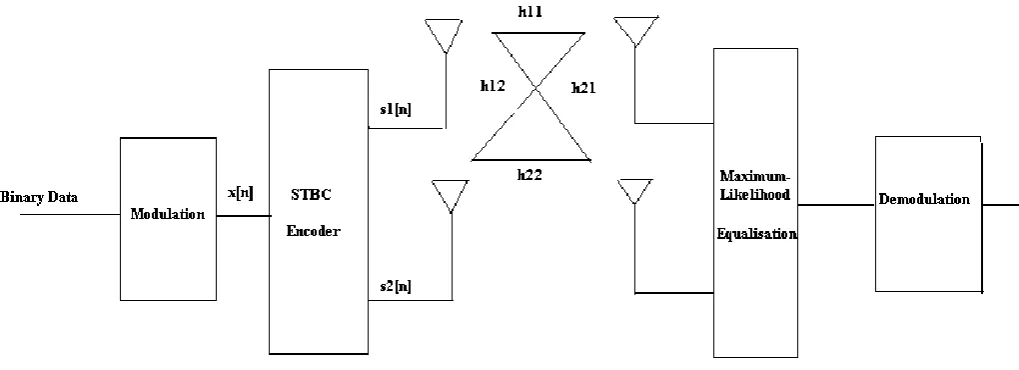
The block diagram of STBC-MIMO is illustrated in Fig.1. The binary data stream is first modulated and mapped to a sequence of complex modulation symbols x[n]. The modulated sequence is then passed through a space time block encoder. Although our approach is applicable to any space-time block code from the family of orthogonal designs, we use Alamouti’s scheme for simplicity [8][9][10]. STBC operation is performed over x[n] and it is turned into two parallel information streams. The sequence of the transmitted data blocks can be represented as shown in Table 1.
By examining Table 1, we can see that the four encoded symbol blocks out of x[n] are
[
1
],
[
2
],...
[
]
]
[
1 1 11
n
x
x
x
N
s
[
1
],
[
2
],...
.
[
]
]
[
2 2 22
n
x
x
x
N
s
(1) [ 1]
[1], [2],... 2*[ ]
*2 * 2
1 n x x x N
s
[1], [2],... [ ]
] 1
[ 1*
* 1 * 1
2 n x x x N
s
These are then transmitted from two different antennas thereby achieving transmit diversity, the received signals are expressed by ) ( ) ( ) ( ) ( ) ( )
( 11 1 21 2 1
1 t h t x t h t x t w t
r
) ( ) ( ) ( ) ( ) ( )
( 11 1 21 2 1
1 t Ts h t x t Ts h t x t Ts w t Ts
r
) ( ) ( ) ( ) ( ) ( )
( 12 1 22 2 2
2 t h t x t h t x t w t
r
(2) ) ( ) ( ) ( ) ( ) ( )
( 12 1 22 2 2
2 t Ts h t x t Ts h t x t Ts w t Ts
r
where hij(t),i1,2,j1,2 are the continuous-time filter representations of the channels from ithtransmit antenna to the jth
receive antenna. OFDM block Transmit
Antenna-1
Fig 1. Block diagram of STBC-MIMO system
.
3. MAXIMUM-LIKELIHOOD SEQUENCE
ESTIMATION
Most wireless channels suffer from inter-symbol interference (ISI). In these channels where ISI occurs, we use Maximum-likelihood sequence estimation (MLSE) that detects the transmitted sequence
) (j'
by maximizing the conditional probability p(y(j)). The maximum-likelihood rule can therefore be written as
j j j
y
p( )
max ( )
) ( '
. (3)
where the sequence
( ) ( )
0 ) (
... ,... j
N j
j
x x
with
) (j i
x the set of the input alphabet with cardinality
M
. The sequence that maximizes the conditional probability can be obtained by performing an exhaustive search over the M N different sequences.4. SPECIFICATIONS OF THE TEST BED
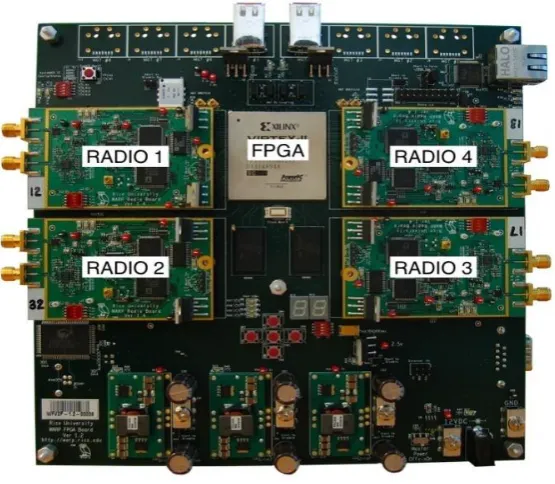
Figure 2 gives the pictorial view of the Test Bed. Using WARPLab framework, radio nodes are interacted directly from the MATLAB workspace and signals generated in MATLAB are transmitted in real-time over-the-air using radio node .
4.1 Tx/Rx I/Q Buffers
Independent Tx/Rx I/Q Buffers.
Each buffer can store a maximum of 214samples.
Buffers persist between triggers.
Samples are read from Tx I/Q Buffers to I/Q DACs at 40 MHz.
Samples are written from I/Q ADCs to Rx I/Q buffers at 40MHz.
4.2 Tx Signal Requirements
Lowest Frequency: 30 kHz. Radios filter DC.
Highest Frequency: Depends on the Tx/Rx Low Pas Filter (LPF) Corner Frequency Setting. By default, Tx and Rx LPF are set to nominal mode. Possible Tx/Rx LPF settings are the following. Tx LPF corner frequency: Mode 0: Undefined, Mode 1: 12 MHz (Nominal Mode), Mode 2: 18 MHz (Turbo Mode 1), Mode 3: 24 MHz (Turbo Mode 2). Rx LPF corner frequency: Mode 0: 7.5 MHz, Mode 1: 9.5 MHz (Nominal Mode), Mode 2: 14 MHz (Turbo Mode 1), Mode 3: 18 MHz (Turbo Mode 2).
40 MHz sampling frequency.
4.3 Tx/Rx Amplifiers
The Tx path applies gain at three amplifiers: Tx Base Band (Tx BB), Tx RF, and Tx RF PA. The Tx RF PA is always fixed at 30 dB gain. The Tx BB and Tx RF amplifiers are adjusted digitally, the range of gains are Tx BB: In [0, 3] applies 1.5 dB/step. Tx RF: In [0, 63] applies 0.5 dB/step.
The Rx path applies gain at two amplifiers: Rx Base Band (Rx BB) and Rx RF. Rx amplifiers are adjusted digitally, the range of gains is the following. Rx BB: In [0, 31] applies 2 dB/step. Rx RF: In [1, 3] applies 15 dB/step.
International Journal of Computer Applications (0975 – 8887) Volume 46– No.22, May 2012
Fig 2. Pictorial view of the Test Bed.
5. SIMULATION RESULTS AND
DISCUSSION
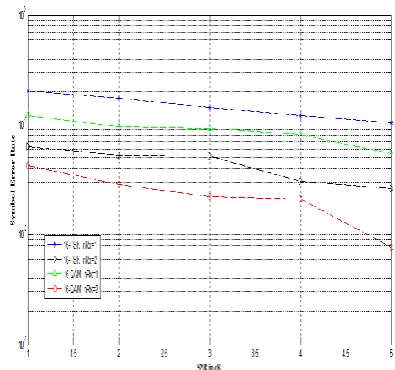
The BER performance and SER performance of STBC-MIMO system based on Alamouti transmitter diversity scheme with proposed maximum likelihood estimation algorithm is being investigated in this paper. Here we consider a system with N=512 number of input symbols . The frequency selective channel is assumed to be random. Taking number of iterations to be 100, the BER vs SNR plot with SNR values varying from 1 to 5 is shown in figure 3.The comparison has been made between different modulation techniques – QPSK and 4-QAM by varying the number of receivers N. Similarly, figure 4 gives the SER performance for QPSK and 4-QAM modulation techniques. The table 1 and table 3 give values of BER and SER when SNR = 2dB and SNR= 3dB with N=1 and N=2 for QPSK and 4-QAM.
Table 1 : BER values for two different values of SNR for QPSK and 4-QAM with 1 receiver and 2 receivers.
Type of modulation
No. Of receivers
BER when SNR 2dB
BER when SNR 3dB
QPSK 1 2.5x10⁻¹ 2.1x10⁻¹
2 1.9x10⁻¹ 1.6 x10⁻¹
4-QAM 1 6x10⁻² 5x10⁻²
[image:3.595.159.437.75.317.2]2 2x10⁻² 0.3x10⁻²
Figure 5 and figure 6 shows the BER vs SNR and SER vs SNR plots for 16-PSK and 16- QAM with number of receivers varying between 1 and 2.The tables 2 and table 4 gives the values of BER and SER for SNR= 2dB and SNR=3dB with N=1 and N=2 for 16-PSK and 16-QAM.
Table 2 : BER values for two different values of SNR for QPSK and 4-QAM with 1 receiver and 2 receivers.
Type of modulation
No. Of receivers
BER when SNR 2dB
BER when SNR 3dB
16-PSK 1 0.3x10⁻¹ 10-1
2 3.5x10⁻¹ 3.1x10⁻¹
16-QAM 1 5x10⁻² 4.5x10⁻²
2 1.5x10⁻² 1x10⁻²
Table 3 : SER values for two different values of SNR for QPSK and 4-QAM with 1 receiver and 2 receivers.
Type of modulation
No. Of receivers
SER when SNR 2dB
SER when SNR 3dB
QPSK 1 6x10⁻¹ 5x10⁻¹
2 4.1x10⁻¹ 3.8 x10⁻¹
4-QAM 1 1.8x10⁻¹ 1.5x10⁻¹
2 6x10⁻² 3.5x10⁻²
Table 4 : SER values for two different values of SNR for QPSK and 4-QAM with 1 receiver and 2 receivers.
Type of modulation
No. Of receivers
SER when SNR 2dB
SER when SNR 3dB
16-PSK 1 1.9x10⁻¹ 1.5x10⁻¹
2 5.2x10⁻² 5 x10⁻²
16-QAM 1 10-1 9x10⁻²
[image:3.595.308.541.509.584.2] [image:3.595.58.290.554.639.2]Fig 3. Comparison of BER vs SNR for QPSK and 4-QAM with number of receivers varying between 1 and 2.
Fig 5. Comparison of BER vs SNR for 16-PSK and 16-QAM with number of receivers varying between 1 and 2.
Fig 4. Comparison of SER vs SNR for QPSK and 4-QAM with number of receivers varying between 1 and 2.
6. CONCLUSIONS
We have analyzed the bit error rate and symbol error rate performance of STBC-MIMO system with transmitter diversity for different modulation techniques e.g QPSK , 4-QAM,16-PSK and 16-QAM. The maximum likelihood estimation method with transmitter diversity is verified on hardware and simulated in MATLAB to arrive at the specifications. The design is synthesized and implemented on Test Bed. Thus, the real time estimation of channel is performed on Test Bed and BER and SER performance is evaluated using simulations in MATLAB.
7. ACKNOWLEDGEMENT
[image:4.595.325.522.83.278.2]The Test Bed is supported by University Grants Commission (UGC).
Fig 6. Comparison of SER vs SNR for 16-PSK and 16-QAM with number of receivers varying between 1 and 2.
8. REFERENCES
[1] Sudhakar Reddy.P, Ramachandra Reddy.G “Design and FPGA Implementation of Channel Estimation Method and Modulation Technique for MIMO System”, European Journal of Scientific Research ISSN 1450-216X vol. 25 , no.2, pp.257-265,2009
[2] S. M. Alamouti, “A Simple Transmit Diversity Technique for Wireless Communications,” IEEE Journal on Selected Areas in Communications, Vol. 16, No. 8, pp. 1451-1458, October 1998.
[image:4.595.323.521.329.514.2] [image:4.595.72.275.331.522.2]International Journal of Computer Applications (0975 – 8887) Volume 46– No.22, May 2012
[5] G. Forney, “Maximum Likelihood Sequence Estimation of Digital Sequences in the Presence of Intersymbol Interference,” IEEE Trans. Inform. Theory, vol. IT-18, pp. 363–378, May 1972.
[6] I. Barhumi, G. Leus, and M. Moonen, “Time-Varying FIR Decision Feedback Equalization of Doubly Selective Channels,” in Globecom, vol. 4, pp. 2263–2268, December,1-5 2003.
[7] E.G. Larsson,P.Stoica “Space-time block coding for wireless communications”, Cambridge Press, 2003.
[8] X. Ma and G. B. Giannakis, “Maximum-Diversity Transmissions over Doubly Selective Wireless Channels,”
IEEE Trans. Inform. Theory, vol. 49, pp. 1823–1840, July 2003.
[9] Ye (Geoffrey) Li, Nambirajan Seshadri and Sirikiat Ariyavisitakul “Channel Estimation for OFDM Systems with Transmitter Diversity in Mobile Wireless Channels” IEEE Journal on Selected Areas in Communications,Vol. 17, No.3,pp. 461-471, March 1999.
[10] Mumtaz Bilgin Sen , “Channel Estimation Techniques For Single and Multiple Transmit Antenna Orthogonal Frequency Division Multiplexing (OFDM) Systems”, Master’s Thesis, Naval Postgraduate School, Monterey,