Munich Personal RePEc Archive
Technical Systems, Organisation Forms
and Social Implications: Statistical
Analysis of the Firm Survey (Second
Interim Report)
Schienstock, Gerd and Bechmann, Gotard and Flecker, Joerg
and Huws, Ursula and Van Hootegem, Geert and Mirabile,
Maria Luisa and Moniz, António and Ò Siochru, Sean
University of Tampere, UNL-FCT, ITAS-FZK, FORBA, HIVA, IES,
Nexus
December 1999
Online at
https://mpra.ub.uni-muenchen.de/5883/
Information Society, Work and
the Generation of New Forms of Social Exclusion
Technical Systems, O rganisation Forms and Social Implications
Technical Systems, O rganisation Forms and Social Implications
Second Interim Report
(Statistical Analysis of the Firm Survey)
Tampere, Finland
December 1 9 9 9
Gerd Schienstock (Co-ordinator) (WRC)
Gotthard Bechmann (ITAS)
Jörg Flecker (FO RBA)
Ursula Huws (IES)
Geert Van Hootegem (HIVA)
Maria Luisa Mirabile (IRES)
António Brandão Moniz (FCT-UNL)
TABLE
TABLE O F CO NTENTS O F CO NTENTS
PREFACE
1 . Introduction... 1
2 . Description of the Sample ... 4
2 .1 . Collection of data... 5
2 .2 . Dimensions of sample companies... 7 3 . Technological practices... 2 4 3 .1 . ICT applications... 2 4 3 .1 .1 The computer hardware technology... 2 4 3 .1 .2 Software applications for office tasks... 3 1 3 .1 .3 Software applications at production stages ... 3 6 3 .1 .4 Communication technology ... 4 2 3 .1 .5 Information and communication systems ... 5 3 3 .1 .6 Intensity and modernity of ICT use... 6 1 3 .1 .7 A functional perspective... 6 4 3 .1 .8 Summary of the regional differences in ICT application ... 7 2 3 .2 . The organisational dimension ... 7 3 3 .2 .1 Some general trends ... 7 3 3 .2 .2 Internal and external organisational changes... 7 8 3 .2 .3 Different modes of organisation... 8 1 3 .2 .4 Technology system and organisation models ... 8 6 3 .2 .5 Call centres... 8 9 4 . The Process of Introducing ICTs... 9 2 4 .1 . Barriers in introducing ICTs ... 9 2 4 .2 . Subcontracting the implementation and development of ICTs ... 9 8 4 .3 . Involvement in introducing ICTs... 9 9 5 . Social consequences of the use of modern ICTs... 1 0 2 5 .1 . Changes in the importance of skills and competencies ... 1 0 2 5 .2 . Teleworkers... 1 1 2 5 .3 . Employment change ... 1 1 7 6 . Managers' statements concerning the social consequences of
LIST O F FIGURES LIST O F FIGURES
Figure 2 .1 . Type of products or services of company by region ... 9 Figure 2 .2 . Company's most important achieving criterion by region ... 1 0 Figure 2 .3 . Company's market position by region... 1 1 Figure 2 .4 . Location of customers by region ... 1 3 Figure 2 .5 . Type of customers by region ... 1 4 Figure 2 .6 . Workforce age by region ... 1 5 Figure 2 .7 . Education level of workforce by region ... 1 6 Figure 2 .8 . Workforce age and educational level by region... 1 7 Figure 2 .9 . Share of male employees by region ... 1 8 Figure 3 .1 . Applied computer system by region ... 2 6 Figure 3 .2 . Applied computer systems by industrial sector ... 2 7 Figure 3 .3 . Applied computer systems by company size ... 2 7 Figure 3 .4 . External data communication by region... 2 8 Figure 3 .5 . External datacommunication by sector... 2 9 Figure 3 .6 . External data communication by company size ... 2 9 Figure 3 .7 . O ffice tasks carried out using software applications by region ... 3 1 Figure 3 .8 . O ffice tasks carried out using software applications by sector... 3 2 Figure 3 .9 . Number of tasks carried out using software applications by sector ... 3 3 Figure 3 .1 0 . Number of tasks carried out using software applications by company size ... 3 3 Figure 3 .1 1 . Share of workforce applying office automation by region... 3 5 Figure 3 .1 2 . Share of workforce applying office automation by sector ... 3 5 Figure 3 .1 3 . Average applicable and automated production stages by firm size, industrial sector and
region ... 3 7 Figure 3 .1 4 . Automation of applicable production stages by region... 3 8 Figure 3 .1 5 . Automation of applicable production stages by sector ... 3 9 Figure 3 .1 6 . Automation of production stages by company size... 4 0 Figure 3 .1 7 . Technical integration between computer-supported production stages by region... 4 1 Figure 3 .1 8 . Technical integration between computer-supported production stages by company size ... 4 1 Figure 3 .1 9 . Technical integration between computer-supported production stages by
Figure 3 .3 1 . ICT systems by region... 5 8 Figure 3 .3 2 . ICT systems by sectors... 5 9 Figure 3 .3 3 . ICT systems according to company's most important achieving criterion ... 6 1 Figure 3 .3 4 . Intensity and modernity of ICT use by region ... 6 2 Figure 3 .3 5 . Intensity and modernity of ICT use by company size... 6 3 Figure 3 .3 6 . Intensity and modernity of ICT use by industrial sector ... 6 4 Figure 3 .3 7 . Importance of ICT functions in implementation of ICTs ... 6 6 Figure 3 .3 8 . Importance of ICT functions: as a tool/automation technology/control device/feedback
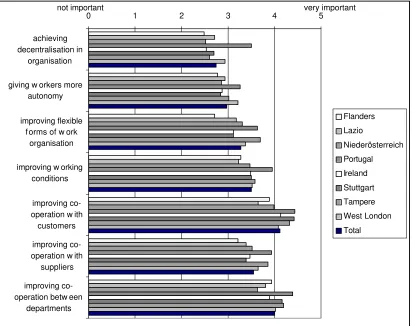
mechanism by region... 6 7 Figure 3 .3 9 . Importance of ICT functions: as organisation/network technology by region ... 6 8 Figure 3 .4 0 . Importance of ICT functions: as a tool/automation technology/control device/feedback
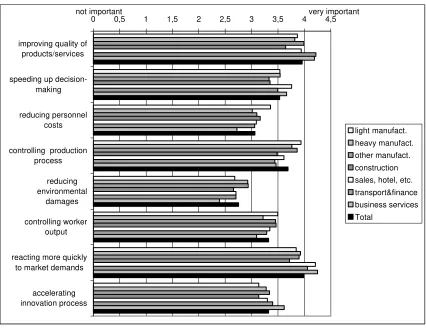
mechanism by sector... 6 9 Figure 3 .4 1 . Importance of ICT functions: as organisation/network technology by sector ... 7 0 Figure 3 .4 2 . High importance of co-ordination and communication function and control function
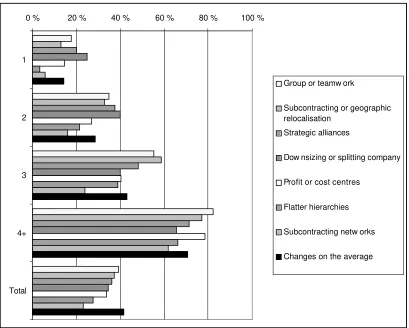
by region... 7 2 Figure 3 .4 3 . Share of organisational restructured companies and average number of
organisational changes by region... 7 7 Figure 3 .4 4 . Introduction of different organisational changes by number of changes in company ... 7 8 Figure 3 .4 5 . O rganisational changes by region ... 7 9 Figure 3 .4 6 . O rganisational changes by industry... 8 0 Figure 3 .4 7 . O rganisational changes by company size... 8 0 Figure 3 .4 8 . O rganisation forms by region ... 8 3 Figure 3 .4 9 . O rganisation forms by sector... 8 4 Figure 3 .5 0 . O rganisation forms by company's most important achieving criterion ... 8 5 Figure 3 .5 1 . Companies' ICT system by organisation forms ... 8 7 Figure 3 .5 2 . Companies' ICT system by internal and external organisational changes ... 8 8 Figure 3 .5 3 . O rganisational changes by intensity and modernity of ICT use ... 8 9 Figure 3 .5 4 . Call centres by region... 9 0 Figure 3 .5 5 . Call centres by industry ... 9 0 Figure 3 .5 6 . Call centres by company size ... 9 1 Figure 4 .1 . Importance of different barriers in introducing ICTs... 9 3 Figure 4 .2 . Importance of technical problems in introducing ICTs by region ... 9 4 Figure 4 .3 . Importance of non-technical problems in introducing ICTs by region... 9 5 Figure 4 .4 . Importance of technical problems in introducing ICTs by sector ... 9 6 Figure 4 .5 . Importance of non-technical problems in introducing ICTs by sector ... 9 7 Figure 4 .6 . Subcontracting implementation and development of ICTs to ICT service providers by region ... 9 8 Figure 4 .7 . Subcontracting implementation and development of ICTs to service providers by
size of company... 9 9 Figure 4 .8 . Involvement of users in process of implementing and developing ICT systems by region ... 1 0 0 Figure 4 .9 . Involvement of users in implementation and development of ICT by size of company ... 1 0 0 Figure 4 .1 0 . Involvement of union representatives in process of implementing and developing
LIST O F TABLES LIST O F TABLES
1 . INTRO DUCTIO N
1 . INTRO DUCTIO N
This is the second interim report of the research project " Information Society, Work and the Generation of New Forms of Social Exclusion" (SO WING). It is based on a firm survey conducted in the eight regions participating in the research project — Flanders (Belgium), Lazio (Italy), Niederösterreich (Austria), Portugal, the Republic of Ireland, the Stuttgart area (Germany), the Tampere region (Finland) and the West London area (U.K.). The aim of this report is to present a broad overview of the collected data. In general, only simple statistical methods have been applied. The report focuses on a regional comparison; however, the data have also been analysed by firm size, measured by quantity of staff, and industrial sector. It should be seen as a first step in the data analysis; it may also give some hints for a more strategic analysis of the survey data.
The aim of the next step is to produce a more comprehensive report. Therefore, the continuation of the data analysis will be based on more advanced statistical methods (factor analysis and cluster analysis) and new, more complex variables will thereby be created.
The results of the firm survey will be used to provide information about the case studies. O ne could argue that the survey analysis generates hypotheses of relationships between the key variables, which can be tested in the case studies. Together with the regional/national profile report, the firm survey can help in giving preliminary answers to the question of whether there is one European way into the information society or whether various regions follow their own path into it.
The aim of the firm survey was to focus on the opinions and perceptions of company managers in the eight regions. It was decided that the number of observations would be small (1 0 0 completed questionnaires per region) in order to have comprehensive data concerning all the aspects relevant in the research. Because of different research traditions, national research groups could independently decide whether to gather the data by mailing a questionnaire or by conducting interviews.
Since the sample was small, it was considered impossible to conduct a representative sectorial analysis by limiting the number of industrial sectors, as many sectors are very heterogeneous. The small numbers of cases in each sector do not allow to cover their diversity, so the samples in different regions may very well cover companies of a different nature.
For a sectorial analysis, one needs to know the sector-codes of the companies in advance, which may become an additional hurdle. Given our previous experiences in sectorial surveys, it is very difficult and takes a lot of effort to define such sectorial populations. Therefore, in view of the small numbers of observations, the idea of representative data was abandoned; it was seen as more appropriate to have data from companies across the economy instead of some specific sectors. This way, the study can give a general overview of the changes taking place in the whole economy.
This does not preclude an analysis on the sectorial level. As the sector-codes of the companies are known, it is possible to make a classification of the observations in the course of the analysis. Indeed, such classification in the analysis stage offers much more flexibility. Therefore, it was more realistic to have economy-wide samples in all regions involved in the project. Referring to the NACE codes, ‘economy-wide’ means from code ‘1 0 ’ to ‘7 5 ’, excluding public administration, education and health care, which would require an adapted questionnaire and approach to investigate. For similar reasons, only companies with twenty or more employees were included in the population.
1 . The problem of ‘employer’ as opposed to ‘location’, ’plant’ or ’establishment’ as the level of observation. There are, of course, many more ‘establishments’ than there are ‘employers’ since many companies have several establishments. Q uite often, administrative databases only account for the employers, while the establishments of each employer are not known. But also with regard to the content, there was little to be gained in asking about many separate but similar establishments in a company, several branch offices of a bank, for example. O nly if the establishments of the same employer are heterogeneous, it makes sense to choose them as research units. As the first case was much more common, the ‘employer’ as the level of observation could be retained.
2 . Related to the previous point is the problem of employers having their administrative location outside the investigated region but many establishments in the region. Large companies can be administratively located in a specific region, while their economic activities are mainly located in other regions. As the study does not claim to have representative samples, the population was limited to the employers that are administratively located in the region selected for investigation. Therefore, the population consists of all employers located in the investigated region and having 2 0 or more employees and a NACE code between 1 0 and 7 5 .
While the sample does not claim to be representative for the whole economy, it was agreed that it should nevertheless cover the diversity of the companies in the economy. For example, large and small enterprises as well as companies from different industrial sectors were included.
2 . DESCRIPTIO N O F THE SAMPLE
2 . DESCRIPTIO N O F THE SAMPLE
This report presents the results of the firm survey conducted within the project. It is based on the integrated data sets of the following regions: Flanders, Lazio, Niederösterreich, Portugal, the Republic of Ireland, the Stuttgart area, the Tampere region and the West London area. From the enumeration one can see that the term region is used for different types of territories. Actually, only Flanders, Lazio and the Tampere region can be characterised as typical regions. Portugal and the Republic of Ireland are countries, while the West London and Stuttgart areas are cities or form a part of a city.
O ur procedure was influenced by strategic considerations. O ne can justify the inclusion of the Stuttgart and West London areas in the research project by the following argument: The analysis of the technological practices in the service sector can be studied in the cities, as here the service sector is by far the dominating sector. Furthermore, we can expect to find more advanced technological practices in big cities with a large number of globally oriented companies. Portugal and Ireland were also included, although they are countries, not regions, since they represent interesting cases concerning the use of ICTs.
In the following, we will first describe the sample. In the third chapter, we will focus on those variables that are related to the concept of technological practices, such as ICT applications and organisation forms. O ur intention is to develop a typology of different technological practices. We will also analyse to what extent ICT applications and organisation forms are influenced by various factors, including region, company size, type of production, location of the company, and companies' market area.
2 .1 . Collection of data
2 .1 . Collection of data
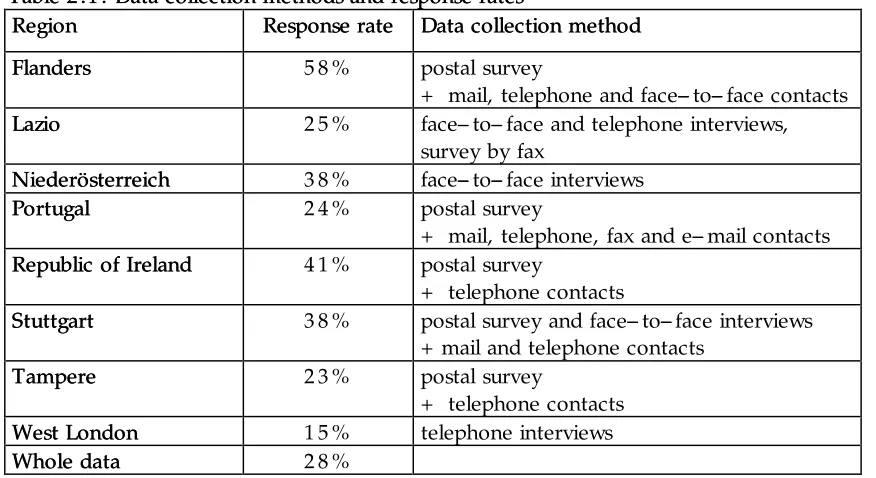
[image:13.595.81.519.252.491.2]The data were collected in the regions by using different methods (Table 2 .1 .). Postal surveys were conducted in Flanders, Portugal, the Republic of Ireland and the Tampere region. The respondents were interviewed face–– to–– face or by phone in Niederösterreich and the West London area. Both methods were applied in Lazio and the Stuttgart area. Some kind of direct contacts to the companies were made in all regions with the data collection. The response rate varied from 1 5 % to 5 8 % . In total, the rate was 2 8 % , which is satisfactory in company surveys.
Table 2 .1 . Data collection methods and response rates Table 2 .1 . Data collection methods and response rates
Region
Region Response rateResponse rate Data collection methodData collection method Flanders
Flanders 5 8 % postal survey
+ mail, telephone and face–– to–– face contacts Lazio
Lazio 2 5 % face–– to–– face and telephone interviews, survey by fax
Niederösterreich
Niederösterreich 3 8 % face–– to–– face interviews Portugal
Portugal 2 4 % postal survey
+ mail, telephone, fax and e–– mail contacts Republic of Ireland
Republic of Ireland 4 1 % postal survey
+ telephone contacts Stuttgart
Stuttgart 3 8 % postal survey and face–– to–– face interviews + mail and telephone contacts
Tampere
Tampere 2 3 % postal survey
+ telephone contacts West London
West London 1 5 % telephone interviews
Whole data
Whole data 2 8 %
The sample in each country, as already mentioned, was limited to 1 0 0 completed questionnaires. The aim was to have approximately the same number of cases in each of the selected industries1 and to have equally spread cases by size in each industry. It was not fully
reached, as the following Table 2 .2 . indicates.
1 The following industries were included: light manufacturing (manufacture of food, textile, etc.), heavy
Table 2 .2 . Number of cases by region, size and sector Table 2 .2 . Number of cases by region, size and sector
Flanders
Flanders LazioLazio Nieder- Nieder-österreich österreich
Portugal
Portugal Republic ofRepublic of Ireland Ireland Stuttgart Stuttgart area area Tampere Tampere region region West West London area London area Total Total Region Region Size Size Sector
Sector 2 0 –2 0 – 4 9 4 9
5 0 + 5 0 + 2 0 –2 0 –
4 9 4 9
5 0 + 5 0 + 2 0 –2 0 –
4 9 4 9
5 0 + 5 0 + 2 0 –2 0 –
4 9 4 9
5 0 + 5 0 + 2 0 –2 0 –
4 9 4 9
5 0 + 5 0 + 2 0 –2 0 –
4 9 4 9
5 0 + 5 0 + 2 0 –2 0 –
4 9 4 9
5 0 + 5 0 + 2 0 –2 0 –
4 9 4 9
5 0 + 5 0 + 2 0 –2 0 –
4 9 4 9
5 0 +
5 0 + TotalTotal
1 . Light 1 . Light manu-facturing facturing
9 6 1 0 6 7 7 1 7 1 1 2 9 5 1 2 1 1 2 4 9 5 6 1 0 5
2 . Heavy 2 . Heavy manu-facturing facturing
9 6 1 9 1 9 7 8 1 5 1 4 1 0 8 7 8 1 3 2 1 1 0 8 9 0 9 2 1 8 2
3 . O ther 3 . O ther manu-facturing facturing
9 9 1 0 6 7 6 5 1 1 6 1 2 4 5 4 5 1 0 6 5 5 6 0 1 1 5
4 . 4 . Con-struction
struction 9 4 3 1 7 7 5 1 2 7 1 0 5 4 3 1 3 9 3 9 7 8
5 . Sales, 5 . Sales, hotel, hotel, etc. etc.
5 8 3 1 8 7 1 1 5 8 1 0 6 8 5 3 9 1 1 5 5 5 3 1 0 8
6 . 6 . Trans-port & port & finance finance
6 5 5 1 1 7 7 1 1 3 3 8 6 8 5 5 9 1 1 4 2 6 8 1 1 0
7 . 7 . Busi-ness ness services services
9 6 1 5 7 8 1 2 5 2 3 9 8 6 1 1 3 7 5 9 4 3 1 0 2
Total Total 1 .– 7 .
The sample was equally distributed by size and sector in the cases of Niederösterreich and Flanders. Manufacturing companies are over–– represented in the samples of Lazio, Portugal, the Republic of Ireland and the Tampere region, and service companies in the West London data. By industrial sectors, the construction industry lacks more cases than others. Also, business service and light manufacturing companies are under–– represented in the data. Most probably, these under–– and over–– representations reflect the varying industrial structures of the different regions.
2 .2 . Dimensions of sample companies
2 .2 . Dimensions of sample companies
In the questionnaire (Appendix 1 ), we asked for background information about the companies, such as the company' s type and location, type of its products, its most important achieving criteria, the market it operates on, its customers, and the characteristics of the company' s labour force.
Co mpany type
Co mpany type
Concerning the company type, we differentiated between fully independent companies, parent companies, companies independent in a group, and branch establishments. Fully independent companies are the most common ones in all regions, but they can be found particularly in Niederösterreich (7 6 % ), the Stuttgart area (6 3 % ) and Lazio (5 7 % ). About 2 7 % of all the companies are independent in a group and they are more typical in Flanders (3 6 % ), the West London area (3 2 % ), the Republic of Ireland (3 2 % ) and Lazio (3 0 % ) than elsewhere. There are only few parent companies in our sample (about 7 % ). Branch establishments (1 5 % of all the companies) are more frequent in the Tampere region and in the West London area (2 8 % and 2 4 % ).
Co mpany's lo catio n
Co mpany's lo catio n
In all regions, most of the companies are located in urban areas, particularly in the Tampere region (7 1 % ), in Lazio (7 0 % ) and, of course, in the West London area (1 0 0 % ). In Portugal and in Flanders, approximately one third of the companies are situated in mixed areas. The largest share of the companies located in rural area can be found in Niederösterreich (2 4 % ).
Companies in all service sectors are typically located in urban areas (more than 7 0 % ), which in the manufacturing sectors is less frequently the case. For example, in light manufacturing industry, only half of the companies are situated in urban areas. In general, manufacturing companies are more commonly located in mixed areas. In the light manufacturing sector, instead, companies are fairly commonly located in rural areas (3 0 % ). If we look at firm size, no significant differences concerning the location of companies can be found.
Years the co mpany has been o perating at current address
Years the co mpany has been o perating at current address
Most of the companies have been operating at their current addresses for quite a long time; half of the companies for over 2 0 years. O nly the West London area is an exception; almost 6 0 % of the companies have been operating at the same addresses for less than 1 0 years. In general, companies in the manufacturing sectors have been operating at their current addresses longer than companies in the service sectors. In the construction sector, as many as 6 6 % of all companies have been operating at the same addresses for over 2 0 years. In the business services sector, their share is only 2 1 % . In addition, more than half of these companies have been operating at the same location for less than 1 0 years. Large companies, as expected, have been operating at the same addresses slightly longer than small companies. Altogether 7 3 % of large companies and 6 5 % of small companies have been operating at their current addresses for over 1 0 years.
The type o f pro ducts o r services o f the co mpany
The type o f pro ducts o r services o f the co mpany
that in the Tampere region (5 5 % ), Niederösterreich (5 4 % ), Flanders (5 3 % ) and Portugal (5 2 % ), half of the companies produce products or services that are customer-specified. O n the other hand, the share of companies producing variants (4 5 % ) is the greatest in the Stuttgart area. The greatest share of companies with standardised products or services can be found in Lazio (2 6 % ), the Republic of Ireland (2 3 % ) and Niederösterreich (2 0 % ), while in Flanders (8 % ), the Tampere region (1 0 % ) and the Stuttgart area (1 1 % ), only few companies provide this type of products or services.
Figure 2 .1 . Type of products or services of company by region Figure 2 .1 . Type of products or services of company by region
χ2 = 2 7 .6 (df = 1 4 ) p= 0 .0 1 6 *
Business services (6 3 % ) and the construction industry (5 8 % ) represent the industries in which customer-specified products or services dominate. The opposite is true for the sales & hotel industry; in this sector, only 2 7 % of all companies provide customer-specified services, while 2 8 % of the companies offer standard services. Thus, variants are typical in the sales & hotel industry (4 5 % ) and light manufacturing (4 5 % ) as well as in the transport & finance industry (4 1 % ). In general, there are no big differences regarding the type of products or services between service and manufacturing industries, however. We can find only small differences in the type of products or services when we look at the size of the companies. More than half of the small companies (5 4 % )
0 % 10 % 20 % 30 % 40 % 50 % 60 % 70 % 80 % 90 % 100 %
Tampere
Niederösterreich
Flanders
Portugal
West London
Stuttgart
Lazio
Ireland
Total
produce customer-specified products; this share is slightly smaller when we look at the larger companies (4 4 % ).
Co mpany's mo st impo rtant achieving criteria
Co mpany's mo st impo rtant achieving criteria
Q uality, productivity, delivery period, flexibility, and innovation are the key criteria which companies aim at achieving (Figure 2 .2 .). In our sample, quality was most often regarded as the key competition criterion. It is especially important for companies in Niederösterreich (6 6 % ), the West London area (6 5 % ), and Flanders (6 3 % ), while for companies in the Tampere region it seems to be less important (3 8 % ). O n the other hand, productivity is still defined as a relevant criterion for competitiveness by a larger share of companies in the Tampere region (2 7 % ), Lazio (2 1 % ) and the Republic of Ireland (1 7 % ). Q uite a big number of companies in the Stuttgart area (2 6 % ) and the Tampere region (2 1 % ) also regard flexibility as a relevant achieving criterion. In all regions, the share of companies regarding the delivery period and innovation as a key competition criterion is rather small.
Figure 2 .2 . Company' s most important achieving criterion by region Figure 2 .2 . Company' s most important achieving criterion by region
χ2 = 8 7 .6 (df = 2 8 ) p= 0 .0 0 0 * * *
0 % 10 % 20 % 30 % 40 % 50 % 60 % 70 % 80 % 90 % 100 %
Niederösterreich
West London
Flanders
Lazio
Portugal
Ireland
Stuttgart
Tampere
Total
Particularly for light manufacturing (7 1 % ), quality is the most important achieving criterion, while it is the least important for companies in business services (4 1 % ). O n the other hand, flexibility (2 3 % ) and innovation (2 4 % ) are also important criteria for companies in the business services sector. Productivity is most often regarded as an important achieving criterion by companies in heavy manufacturing industries (1 8 % ). Concerning the dominating achieving criteria, companies of different size do not differ significantly.
Po sitio n o n the widest o perated market
Po sitio n o n the widest o perated market
As Figure 2 .3 . shows, more than half of all the companies operate on the international market (5 9 % ). However, the majority of them are only minor players on the international level. Still, 2 1 % of all companies have a rather strong position on the international market by being among the five largest either on the European or on the global market. Approximately a tenth of the companies operates only on the regional market and 3 0 % only on the national market where the majority of companies (1 8 % of all the companies) seem to be minor players.
Figure 2 .3 . Company' s market position by region Figure 2 .3 . Company' s market position by region
1 ) In the Irish questionnaire, the whole Republic of Ireland was considered a region.
χ2 = 1 7 5 .0 (df = 2 8 ) p = 0 .0 0 0 * * *
0 % 10 % 20 % 30 % 40 % 50 % 60 % 70 % 80 % 90 % 100 %
Portugal
West London
Lazio
Flanders
Tampere
Stuttgart
Niederösterreich
Ireland 1)
Total
Nearly 8 0 % of the Portuguese companies (7 8 % ) and about two thirds of the firms in the West London area (6 5 % ) operate on the international market. As many as 4 1 % of companies in the West London area have a significant role on the international level, whereas over half of the companies in the Republic of Ireland (5 4 % ) and Niederösterreich (5 2 % ) operate only on the national market. The Central European firms’ market areas also equal to their own region (in Niederösterreich 1 9 % and especially in the Stuttgart area 2 9 % ) more commonly than those of the other firms.
In general, companies from manufacturing sectors are very often present on the international market (6 1 % –– 8 1 % ), while companies in the construction industry are in the weakest position on international markets (2 4 % ). Most typically, construction companies play a minor role on the national market (3 7 % ). Larger companies, as expected, are more active on international market than smaller ones.
Lo catio n o f custo mers
Lo catio n o f custo mers
Figure 2 .4 . Location of customers by region Figure 2 .4 . Location of customers by region
1 ) Ireland in the region = in the Republic of Ireland
in the EU = in Northern Ireland, in the U.K. or in the other parts of EU
χ2 = 1 4 5 .0 (df = 2 1 ) p = 0 .0 0 0 * * *
Customers of companies in various services sectors are most typically located in the region. This also holds true for companies in the construction sector. For other sectors, such as light manufacturing (4 8 % ) and heavy manufacturing (4 1 % ), the national territory is where most of their customers are located. Also, in the business services sector, companies’ customers can mostly be found in their own countries (4 1 % ). In general, the customers of the companies in the industrial sectors are located in the EU and, even on the global market, more often than those of the companies in the service sectors.
Customers of small companies, as expected, are more frequently located in the region than those of larger companies. However, more than one third of all companies in both size categories have the majority of its customers in their own country. And one fifth of larger companies have their biggest shares of customers in the EU.
The type o f custo mers
The type o f custo mers
As can be seen in Figure 2 .5 ., customers mainly consist of other companies in each region. This is particularly true for Portugal (8 2 % ), Flanders (7 1 % ) and the Tampere region (7 0 % ). O ne third
0 % 10 % 20 % 30 % 40 % 50 % 60 % 70 % 80 % 90 % 100 %
Portugal
Ireland 1)
Tampere
Flanders
West London
Lazio
Niederösterreich
Stuttgart
Total
of the companies in Niederösterreich have mainly individual customers, who are quite important for companies in the West London area (3 1 % ) and in the Republic of Ireland (2 6 % ) as well. Public administration is not very significant as a customer for any region.
Figure 2 .5 . Type of customers by region Figure 2 .5 . Type of customers by region
χ2 = 2 3 .7 (df = 1 4 ), p = 0 .0 5 0 *
In all sectors, with the exception of the sales & hotel industry in which individual customers dominate, customers are mainly companies. However, in the transport & finance sector as well as in the construction industry, more than 3 0 % of all companies have predominantly individual customers. In general, however, industry and services do not differ very much concerning the dominant type of their customers. Differences in size of company concerning the dominant type of companies' customers are not statistically significant.
Age o f the co mpanies' wo rkfo rce
Age o f the co mpanies' wo rkfo rce
The regions differ from each other quite considerably regarding the age of the workforce (Figure 2 .6 .). Typically, the majority of the workers within companies are under 4 0 ; this is particularly true for companies in Niederösterreich (7 5 % ), the West London area (7 2 % ) and the Republic of Ireland (7 1 % ). In addition to this, the companies in West London area and the Republic of Ireland have remarkably often a lot of young employees. O n the other hand, only one third of all the
0 % 10 % 20 % 30 % 40 % 50 % 60 % 70 % 80 % 90 % 100 %
Niederösterreich
West London
Ireland
Tampere
Stuttgart
Lazio
Flanders
Portugal
Total
companies in the Tampere region and 4 4 % in Lazio belong to the group with a majority of workers under 4 0 . The share of companies with a workforce beyond 4 0 is the greatest (4 3 % ) in the Tampere region.
Figure 2 .6 . W
Figure 2 .6 . Workforce age by regionorkforce age by region
χ2 = 1 2 3 .9 (df = 2 1 ) p= 0 .0 0 0 * * *
Especially in business services (7 9 % ), the sales & hotel industry (6 8 % ), and in other manufacturing (6 5 % ), we can find a predominantly younger workforce. O n the other hand, employees beyond 4 0 are particularly common in companies in light manufacturing (4 2 % ), transport & finance (2 8 % ), construction (2 5 % ), and heavy manufacturing (2 4 % ). Considering the age of the workforce, small and large companies differ only slightly. A total of 2 7 % of the larger companies have an aged workforce within which the majority of employees is over 4 0 , whereas the share is only 1 9 % among smaller companies.
Educatio n level o f the co mpanies' wo rkfo rce
Educatio n level o f the co mpanies' wo rkfo rce
There are quite notable differences in the education level of the companies' workforces by regions (Figure 2 .7 .), although in all regions the majority of companies have a workforce with a predominantly vocational education, which education level is particularly representative of companies in Niederösterreich (8 5 % ), the Republic of Ireland (7 7 % ), and Lazio (7 7 % ). In
0 % 10 % 20 % 30 % 40 % 50 % 60 % 70 % 80 % 90 % 100 %
Niederösterreich
Flanders
West London
Ireland
Portugal
Stuttgart
Lazio
Tampere
Total
Portugal, on the other hand, the share is reduced to 5 2 % . A low education level of the workforce is fairly common for companies in the Tampere region (2 3 % ), Portugal (2 0 % ), and the West London area (1 4 % ). And a workforce with a predominantly higher education level is fairly frequent in companies in Portugal (2 8 % ), the Stuttgart area (2 7 % ), Flanders (2 3 % ), and Lazio (2 1 % ).
Figure 2 .7 . Education level of workforce by region Figure 2 .7 . Education level of workforce by region
χ2 = 1 4 2 .2 (df = 2 1 ) p= 0 .0 0 0 * * *
Vocational education is the most common educational level in all industrial sectors (over 7 0 % ) with the exception of business services, in which only 3 5 % of all companies predominantly have a workforce with vocational education. Thus, in this sector, 5 9 % of the companies have a workforce predominantly consisting of people with higher education. A low education level is quite common in companies in light manufacturing (2 0 % ). Company size does not make a difference concerning the education level.
Wo rkfo rce age and educatio nal level
Wo rkfo rce age and educatio nal level
It was assumed that the younger the workforce was, the higher the educational level would have been. This, however, was not the case (Figure 2 .8 .). The highest educational level could be found in the companies with the majority of the workforce between 2 5 and 3 9 . In companies that had a lot of younger than 2 5 -year-old employees, the educational level was the lowest of all.
0 % 10 % 20 % 30 % 40 % 50 % 60 % 70 % 80 % 90 % 100 %
Portugal
Stuttgart
Flanders
Lazio
West London
Niederösterreich
Ireland
Tampere
Total
Figure 2 .8 . Workforce age and educational level by region Figure 2 .8 . Workforce age and educational level by region
χ2 = 3 4 .5 (df = 9 ) p= 0 .0 0 0 * * *
Share o f male emplo yees
Share o f male emplo yees
In all regions, men constitute the majority of the workforce in more than 5 0 % of the companies (Figure 2 .9 .). Still, there are regional differences, as in Portugal, for example, in as many as 8 3 % of the companies more than half of the workers are men. O n the other hand, in the Tampere region, only 5 2 % of the companies predominantly have a male-dominated workforce. In quite a small number of companies, men constitute 2 5 –– 5 0 % of the employees, particularly in the West London area (3 0 % ), the Tampere region (2 8 % ), and the Stuttgart area (2 5 % ).
0 % 10 % 20 % 30 % 40 % 50 % 60 % 70 % 80 % 90 % 100 %
Majority <40, mainly <25
Majority < 40, mainly 25-39
Equally <40 - 40+
Majority 40+
Total
Figure 2 .9 . Share of male employees by region Figure 2 .9 . Share of male employees by region
χ2 = 5 3 .9 (df = 2 1 ), p 0 .0 0 0 * * *
By industrial sectors, construction and heavy manufacturing are very male–– dominated sectors; in construction 9 2 % and in heavy manufacturing 8 4 % of the companies reported having employed more than 5 0 % male workers. O n the other hand, in only 5 2 % of the companies in light manufacturing and in 5 6 % of the companies in the sales & hotel sector, men represent the majority in the personnel. Regarding the predominant gender of the workforce, company size does not matter very much. In 7 0 % of the companies, small and large firms alike, the share of male employees amounts to more than a half of the workers.
Summary o f the influencing variables
Summary o f the influencing variables
The following tables give an overview of what has been discussed so far. Table 2 .3 . shows how the regions differ according to each variable considered above. It was constructed by using the mean of each variable by regions. Deviations of 1 0 % or more from the mean (++ /–– ) are presented.
0 % 10 % 20 % 30 % 40 % 50 % 60 % 70 % 80 % 90 % 100 %
Portugal
Ireland
Niederösterreich
Lazio
Flanders
Stuttgart
West London
Tampere
Total
Table 2 .3 . Background information on companies Table 2 .3 . Background information on companies
Region Region Variables
Variables MeanMean
Flanders
Flanders LazioLazio NiederösterreichNiederösterreich PortugalPortugal IrelandIreland StuttgartStuttgart TampereTampere West LondonWest London
Type of products /services Type of products /services of the company
of the company
4 9 % 3 5 %
1 6 % Standard ++
Specified ––
Variants ++ Company' s most important
Company' s most important achieving criterion achieving criterion
5 5 % 1 3 % 1 6 %
Q uality ++ Productivity ––
Flexibility ++
Q uality –– Productivity ++
Q uality ++
Market position
Market position 1 1 % 1 8 % 1 2 % 3 8 % 2 1 %
Minor on nat. level ++
Significant internationally ––
Minor on nat. level ––
Minor internationally ++
Major on nat. level + + Minor internationally ––
Regional level ++
Minor internationally ––
Significant internationally ++ Years company has been
Years company has been operating at current address operating at current address
4 8 % 1 5 %
More than 2 0 ++ Less than
5 ––
More than 2 0 ––
More than 2 0 ++ Less than
5 ––
More than 2 0 years ––
Less than 5 ++ Company type
Company type 4 7 % 3 0 % 1 3 % 9 %
Fully independent company ++
Fully independent company +
+ Independent company in a group ––
Fully independent company –– Independent company in a group ++
Branch establishment –– Parent company ++
Fully independent company ++
Branch establishment ++
Branch establishment +
+ Location of company
Location of company 6 4 % 2 2 % 1 4 %
Urban –– Mixed ++
Urban –– Rural ++
Mixed ++
Urban ++ Mixed –– Rural –– Location of customers
Location of customers 4 5 % 3 7 % 1 4 % 5 %
In the region ––
In the region –– In the EU ++
In the region ++ In the EU ++
In the region ++ In the EU ––
In the region –– In the country ++
O utside EU ++ Type of customers
Type of customers 6 9 % 2 3 %
Mainly companies –– Mainly companies ++ Mainly individual
customers –– Age of workforce
Age of workforce 6 0 % 2 3 % 1 7 %
< 4 0 –– 4 0 ++ ++
< 4 0 ++ 4 0 ++ ––
Even ––
< 4 0 ++ < 4 0 –– < 4 0 –– 4 0 ++ ++
< 4 0 ++
Education level of workforce
Education level of workforce 7 1 % 1 0 %
Mostly vocational ++ Mostly vocational ––
Mostly low ++ Mostly low ++ Share of male employees
Share of male employees 7 1 % 2 0 %
> 5 0 % ++ 2 5 –– 5 0 % ––
> 5 0 % ––
Half of the companies offer customer specified products/services and around one third offers variants (in Niederösterreich only 2 6 % ). In the Republic of Ireland, the share of specified products/services is considerably smaller (2 3 % ). In addition, the Stuttgart area is exceptional, because companies producing variants are most typical (4 5 % ) there. Furthermore, standard products are fairly common in Lazio (2 6 % ).
Q uality is clearly the most important achieving criterion, even though there are major differences between regions. Niederösterreich and the West London area differ somewhat, since in these regions as many as about two thirds of the companies regard quality as the uppermost criterion. In the Tampere region, the same share is only 3 9 % . Compared to other regions, productivity is quite a common criterion in Tampere (2 6 % ); at the same time, only 1 % of the companies in Niederösterreich is of the same opinion. The importance of delivery period differs only little between regions. In the Stuttgart area and the Tampere region, companies consider flexibility fairly often as the most important achieving criterion (2 6 % and 2 1 % ).
In almost every region a bigger part of the companies are minor players on the international market by their market positions. Portugal is exceptional because there the share is as great as 6 1 % . The regional market is very important to the companies in the Stuttgart area(2 9 % ). Being a minor player on the national market is fairly common to the companies in Niederösterreich (2 8 % ). Companies in the Republic of Ireland are most typically major players on their national market (3 5 % ). There are many companies in the West London area that play a significant role on the international market (4 1 % ).
O n average, half of the companies have been operating at their current addresses for more than 2 0 years. The share is exceptionally large in Niederösterreich (7 4 % ) and in the Stuttgart area (6 6 % ) and, at the same time, relatively small in Portugal (3 1 % ) and in the West London area (1 9 % ). Fewer companies than on average in Niederösterreich (4 % ) and in the Stuttgart area (4 % ) have been operating at their current addresses for less than 5 years. The West London area is remarkably different because the same share is as great as 3 4 % there.
(2 8 % ) and in West London area (2 4 % ) but extremely infrequent in Portugal (3 % ). In general, parent companies are exceptional but in Portugal as many as 4 0 % of the companies belong to this category. Thus, as a whole, Portugal seems to be very different from the other regions.
Companies in every region are mainly located in urban areas (6 4 % ). The West London area, however, is exceptional because there all companies are situated in the urban area. O n the other hand, in Flanders and Niederösterreich the share of companies in an urban location is clearly small (4 6 % and 4 9 % ). O ne fifth of the companies is situated in mixed areas, which is particularly common in Portugal (3 6 % ) and in Flanders (3 3 % ). The share of companies located in rural areas is noteworthy only in Niederösterreich (2 4 % ).
The majority of customers are located in the region, especially in the Republic of Ireland (7 1 % ) and the Stuttgart area (5 9 % ) but less than on average in the West London area (2 8 % ), Flanders (3 4 % ), and Portugal (3 5 % ). The country as the location of customers is significant only in the West London area (5 2 % ). In Portugal (2 8 % ) and in Ireland (2 4 % ) many customers are situated within the EU. In Stuttgart, instead, the percentage is clearly lower (3 % ) than the average. The location of customers outside the EU is also quite significant in the West London area (1 5 % ).
Customers are mainly companies, in Portugal as many as 8 2 % . Thus, there are only few individual customers. In Niederösterreich, instead, companies as customers constitute less than the average (5 8 % ).
In many firms, the majority of workers are younger than 4 0 (6 0 % ). This age group is predominant in three fourths of the companies in Niederösterreich, the West London area, and the Republic of Ireland. The share of companies with older workforces is the greatest in the Tampere region and in Lazio (4 3 % and 3 4 ).
Male employees dominate the workforce in most companies in every region. There are some variations, however. In as many as 8 3 % of the companies in Portugal, men are the majority. In Tampere, instead, in barely half of the companies (5 2 % ) men constitute the majority of workers; the situation is extraordinary compared to that of the other regions. Still, companies having a male workforce of 2 5 -5 0 % are fairly common in the West London area (3 0 % ).
All in all, compared to the others; Portugal seems to be a very extraordinary region. Companies seem to be quite active internationally there, they have been situated at their current addresses for a somewhat shorter period of time than companies in other regions, company types are different from those of the others, customers in Portugal are located more often in the EU than customers in other regions, a notably large share of customers are companies, companies with workers mostly having a low educational level dominate, and the workforce in most companies is clearly male-dominated. No other region differs from the average as much as Portugal.
Another extreme is Flanders, which is a very average region. In addition, Lazio is quite like Flanders; the only noteworthy thing is that companies with older workforces can be found more often in Lazio. Tampere does not differ from the average much either. Compared to the other regions, there are differences in company' s most achieving criterion, as productivity is highly important. Also, in companies’ in the Tampere region, employees are a bit older and have a mostly low educational level, and there are quite many companies with a significant share of female workers. In the Stuttgart area, companies have been situated at their current addresses longer than on average, companies are significantly often fully independent, their market position is regional, and their customers are situated more in their own region than in other regions. Also, the number of companies with an older workforce is a bit greater than the average.
The West London area and Niederösterreich are both quite extreme regions, in a way opposed to each other. In the West London area, companies operate significantly more internationally, they have been operating at their same addresses only for a short time, branch establishments are more common than in other regions, companies are located in the urban area, a lot of customers are located outside the EU, and a significant share of companies has a young workforce.
3 . TECHNO LO GICAL PRACTICES
3 . TECHNO LO GICAL PRACTICES
The key concept in the research project is technological practices2. They consist of three
dimensions: technological, organisational, and cultural. Here we will first deal with the technological dimension and discuss the various forms of ICT applications. We will then focus on the organisational dimension separately before analysing the relationships between ICT applications and organisation forms. The cultural dimension was not included in the questionnaire.
3 .1 . ICT applications
3 .1 . ICT applications
ICT systems include two dimensions: computer technology as an information processing device and communication technology as a connecting device. First, we will discuss the computer technology applied within companies. Both hardware and software components are dealt with. In the second part, we will analyse the communication technology applied within companies. Characteristically, the ICT systems which we will then discuss integrate both of the two technology strands, computer technology and communication technology. O ur technology-related research also includes an analysis of the dominant functions for which ICT systems are installed. A third typology regarding ICT systems is based on the intensity and modernity of ICT applications.
3 .1 .1 The computer hardware technology
Local area networks represent a totally different and more decentralised type of computing. They can be described as client/server architecture. LANs and similar technologies connect the users to a network, shared software, databases and other users, but it also leaves space for more autonomy at work. Being integrated into a local area network, users do not have to rely only on the capacity of their own computer or the mainframe. The software is not limited to one machine but it can be processed co-operatively on various computers in the network. The computer, as Tapscott (1 9 9 6 : 1 0 0 ) argues, becomes the network and the network becomes the computer.
Nearly half of the companies (4 5 % ) in our sample apply only one of the three computer systems described above. In most cases, this is the local area network technology. This means, on the other hand, that the majority of companies still use at least two different computer technologies. In total, 7 8 % of the companies apply LANs either alone or together with another technology, 6 1 % apply stand-alone PCs and 3 5 % the mainframe with terminals.
We categorised the different applied computer systems into five types. Companies applying only one system — stand-alone PCs, the mainframe with terminals, or LANs — and multi-systems — the mainframe and PCs together or LANs with either one or both of the other systems.
The number of the applied computer systems varies significantly according to the region of the company (Figure 3 .1 .). O ver half of the companies in Flanders, the Tampere region and the West London area use only one system. Parallel use of two and more computer systems is the most common among firms in Portugal (7 0 % ) and in Lazio (6 4 % ).
Companies applying only stand-alone PCs are the most common in Flanders (1 8 % ), Portugal and Niederösterreich (1 5 % in both regions). Instead, LANs as the single applied computer system is most widely used in the Tampere region (3 9 % ) and in the West London area (3 7 % ). In general, over 8 0 % of companies in the Stuttgart area, the Republic of Ireland, the West London area and the Tampere region include LANs in their computer system, while only 6 6 % of the companies in Flanders apply LANs.
Figure 3 .1 . Applied computer system by region Figure 3 .1 . Applied computer system by region
χ2 = 6 3 .7 (df= 2 8 ) p= 0 .0 0 0 * * *
As can been seen in Figure 3 .2 ., a single computer system is most commonly used in construction industry (5 7 % ), and multi-systems in other manufacturing (6 3 % ) and heavy manufacturing (6 0 % ). Companies in construction industry rely only on stand-alone PCs most often (2 1 % ). The PC system is frequently applied in light (1 4 % ) and heavy manufacturing (1 3 % ) as well. The mainframe with terminals possibly added with stand-alone PCs is most widely used in light manufacturing (1 8 % ), in the sales, hotel & restaurant sector (1 7 % ), and in transport & finance (1 1 % ). LANs, instead, are most common in business services and other manufacturing. They can be found in over 8 0 % of the companies in these sectors.
Company size also affects the type of ICT systems applied (Figure 3 .3 .). O ver half of the small firms (5 3 % ) use only one computer system, while two-thirds of the larger companies apply a multi-system, which is most commonly LANs added with other system(s) (5 7 % ). The isolated stand-alone PC system is applied in 2 0 % of the small firms and only in 5 % of large companies.
0 % 20 % 40 % 60 % 80 % 100 %
Portugal
Lazio
Stuttgart
Ireland
Niederösterreich
West London
Tampere
Flanders
Total
PCs mainframe LAN
Figure 3 .2 . Applied computer systems by industrial sector Figure 3 .2 . Applied computer systems by industrial sector
χ2 = 5 3 .2 (df= 2 4 ) p= 0 .0 0 1 * * *
Figure 3 .3 . Applied computer systems by company size Figure 3 .3 . Applied computer systems by company size
χ2 = 5 2 .6 (df= 4 ) p= 0 .0 0 0 * * *
0 % 20 % 40 % 60 % 80 % 100 %
other manufact.
heavy manufact.
sale, hotel, etc.
transport&finance
light manufact.
business services
construction
Total
PC's mainframe LAN
mainframe + PC's LAN +
0 % 20 % 40 % 60 % 80 % 100 %
20-49
50+
Total
PCs mainframe LAN
We further analysed whether the applied computer technology is connected only locally in a company establishment if at all, whether connectivity exists between separate establishments of a company, or whether the company is connected to the outside world. O verall, 9 % of the companies lack any connection outside the particular establishment, 1 7 % have inter-establishment links and 7 3 % have external connections.
Figure 3 .4 . indicates that the establishments that are technically isolated can most often be found in companies in Niederösterreich (3 3 % ), while the share is only 4 % among companies in the Tampere region. Also, a great majority of the firms in this region have data communication links with external third parties (9 1 % ).
Figure 3 .4 . External data communication by region Figure 3 .4 . External data communication by region
χ2 = 5 1 .1 , df= 1 4 , p= 0 .0 0 0 * * *
Data communication among company establishments is most common in companies in the business service sector (9 3 % ). As many as 8 6 % of these companies have data communication linkages with external parties outside the company (Figure 3 .5 .). O n the other hand, in only 6 0 % of the companies in the energy & construction sector and 6 5 % of the firms in the sales & hotel sector establishments are externally connected. In nearly a quarter of the small companies and a tenth of the large companies, single establishments lack any external data communication link (Figure 3 .6 .).
0 % 10 % 20 % 30 % 40 % 50 % 60 % 70 % 80 % 90 % 100 %
Tampere
Stuttgart
Ireland
Portugal
West London
Lazio
Flanders
Niederösterreich
Total
Compared to the 6 9 % of the small firms, a total of 7 7 % of the large companies have the link outside the other establishment of the company.
Figure 3 .5 . External datacommunication by sector Figure 3 .5 . External datacommunication by sector
χ2 = 5 4 .8 , df= 1 2 , p= 0 .0 0 0 * * *
Figure 3 .6 . External data communication by company size Figure 3 .6 . External data communication by company size
χ2 = 3 0 .7 , df= 2 , p= 0 .0 0 0 * * *
0 % 10 % 20 % 30 % 40 % 50 % 60 % 70 % 80 % 90 % 100 %
20-49
50+
Total
No or local Betw een establishments External
0 % 10 % 20 % 30 % 40 % 50 % 60 % 70 % 80 % 90 % 100 %
business services
light manufact.
heavy manufact.
transport&finance
other manufact.
sales, hotel, etc.
construction
Total
Based on what has been discussed so far, we can distinguish between the following ICT systems (Table 3 .1 .). More than 9 3 % of all companies use network technologies, which in 7 3 % of the cases include external connectivity, and in 9 % of the cases links between the establishments of the company. More than half of the companies (5 5 % ) applying stand-alone PCs only do not have any electronic data connection at all.
Table 3 .1 . Technical systems Table 3 .1 . Technical systems
Technical system
Technical system FrequencyFrequency PercentagePercentage CumulativeCumulative percentage percentage
— O nly PC with no connection 5 3 7 7
— Mainframe and terminals (+ PC) with only local connection
1 4 2 9
— LAN with only local connections 7 0 9 1 8
Subto tal A:
Subto tal A: ICT system with only local ICT system with only local
connections (no connection between connections (no connection between other establishment of the company or other establishment of the company or externally)
externally)
1 3 7 1 8
— O nly PC between establishments connected
3 0 1 8
— Mainframe (+ PC) between establishments connected
1 1 1 1 9
— LAN between establishments connected
5 9 8 2 7
Subto tal B:
Subto tal B: ICT systems with connection ICT systems with connection to other establishments of the company to other establishments of the company
7 3 9
Subto tal A+ B:
Subto tal A+ B: ICT systems with no ICT systems with no
external connectivity external connectivity
2 1 0 2 7
— O nly PC with external connectivity 4 0 5 3 2
— Mainframe (+ PC) with external connectivity
5 1 7 3 9
— LAN with external connectivity 4 7 9 6 1 1 0 0
Subto tal C:
Subto tal C: ICT systems with external ICT systems with external connectivity
connectivity
5 7 0 7 3
To tal
3 .1 .2 Software applications for office tasks
Companies can use office software for a variety of different tasks. In our survey, we included the following tasks: accounting, personnel administration, invoicing, purchasing, sales and marketing, and customer services. It is only rarely that all of these tasks are not applicable, that is, the tasks do not exist in the company. A total of 1 2 % of the companies do not have customer service and 5 % do not have sales.
Companies' application of software in various functions differs according to region, sector, and size. Concerning the regional aspect (see Figure 3 .7 .), the Irish companies are the leading users of office software in all tasks, except in customer service. The firms in Flanders and Lazio are distinctively ahead, as far as the application of software in customer service is concerned. In Lazio, software is also widely used in purchasing.
Figure 3 .7 . O ffice tasks carried out using software applications by region Figure 3 .7 . O ffice tasks carried out using software applications by region
χ2 counted on frequencies of using/not using companies by region:
0 % 20 % 40 % 60 % 80 % 100 %
Accounting
Personnel administration
Invoicing
Purchasing
Sales
Customer service
Flanders Lazio
Accounting, χ2 = 3 3 .6 , df= 7 , p= 0 .0 0 0 * * * Personnel administration, χ2 = 5 2 .3 , df= 7 , p= 0 .0 0 0 * * *
Invoicing, χ2 = 9 .8 , df= 7 , p= 0 .1 9 9 Purchasing, χ2 = 2 4 .5 , df= 7 , p= 0 .0 0 1 * * * Sales & marketing, χ2 = 1 0 .3 , df= 7 , p= 0 .1 7 1 Customer service, χ2 = 2 6 .3 , df= 7 , p= 0 .0 0 0 * * *
In general, large companies, as expected, use office software more often than small companies, but differences are less remarkable as far as invoicing or customer service is concerned. As Figure 3 .8 . displays, companies in the manufacturing sectors are more frequent users of software support regarding purchasing. Software support in selling and marketing is most often used in light manufacturing, other manufacturing and the sales, hotel & restaurant sector. Customer service is naturally more common in the service sectors than in manufacturing.
Figure 3 .8 . O ffice tasks carried out using software applications by sector Figure 3 .8 . O ffice tasks carried out using software applications by sector
χ2 counted on frequencies of using/not using companies by sector Accounting, χ2 = 1 2 .0 , df= 6 , p= 0 .0 6 3
Personnel administration, χ2 = 8 .3 , df= 6 , p= 0 .2 1 4 Invoicing, χ2 = 1 3 .7 , df= 6 , p= 0 .0 3 3 * Purchasing, χ2 = 1 7 .6 , df= 6 , p= 0 .0 0 7 * * Sales & marketing, χ2 = 3 1 .3 , df= 6 , p= 0 .0 0 0 * * *
Customer service, χ2 = 2 2 .9 , df= 6 , p= 0 .0 0 1 * *
0 % 20 % 40 % 60 % 80 % 100 %
Accounting
Personnel administration
Invoicing
Purchasing
Sales
Customer service
Figure 3 .9 . shows that multifunctional use of software support is more common in light manufacturing, other manufacturing, and the sales, hotel & restaurant sector, while in the construction sector, isolated software support is used more often only for few tasks. As expected, companies with fewer than 5 0 employees in general apply software in fewer tasks than larger companies (Figure 3 .1 0 .).
Figure 3 .9 . Number of tasks carried out using software applications by sector Figure 3 .9 . Number of tasks carried out using software applications by sector
χ2 = 6 0 .3 , df= 3 6 , p= 0 .0 0 7 * *
Figure 3 .1 0 . Number of tasks carried out using software applications by company size Figure 3 .1 0 . Number of tasks carried out using software applications by company size
χ2 = 4 5 .6 , df= 6 , p= 0 .0 0 0 * * *
0 % 20 % 40 % 60 % 80 % 100 %
light manufact.
heavy manufact.
other manufact.
construction
TOTAL MANUF.
sale, hotel, etc.
transport&finance
business services
TOTAL SERVICE
TOTAL
0 1 2 3 4 5 6
0 % 20 % 40 % 60 % 80 % 100 %
20-49
50+
Total
Table 3 .2 . indicates that software support is used the most in companies in invoicing (9 4 % ), accounting (9 4 % ), and personnel administration (8 8 % ), and the least for customer services (7 2 % ). Companies differ in the extent to which they use software support. Some 3 7 % use software support for all tasks mentioned above. In addition, 2 7 % of all companies use software support for five of the above-mentioned tasks. Isolated use of software support for only one (3 % ) or two tasks (4 % ) is very rare.
Table 3 .2 . Tasks carried out regularly by using software applications by number of tasks Table 3 .2 . Tasks carried out regularly by using software applications by number of tasks
Applicable tasks Applicable tasks Yes
Yes NoNo TotalTotal
Not Not applicable applicable
N N
Accounting
Accounting 9 4 % 6 % 1 0 0 % 3 % 7 7 6
Personnel administration
Personnel administration 8 8 % 1 2 % 1 0 0 % 3 % 7 8 6 Invoicing
Invoicing 9 4 % 6 % 1 0 0 % 2 % 7 9 2
Purchasing
Purchasing 7 5 % 2 5 % 1 0 0 % 4 % 7 6 6
Sales
Sales 7 9 % 2 1 % 1 0 0 % 5 % 7 6 5
Customer service
Customer service 7 2 % 2 8 % 1 0 0 % 1 2 % 7 4 8
The share of employees3 using software in specific administrative tasks within companies is the
greatest in Portugal and in the Stuttgart area (Figure 3 .1 1 .). In 6 0 % of these companies over 3 0 % of the company workforce apply office automation. In larger companies, the share is only a little bigger than in small companies. Instead, the share of users varies remarkably when we look at the sector variable (Figure 3 .1 2 .). Business services and transport & finance are the sectors where the share of users of office automation in companies is the greatest.
3The distribution of values in this variable significantly deviates from the normal curve, and the share of users
Figure 3 .1 1 . Share of workforce applying office automation by region Figure 3 .1 1 . Share of workforce applying office automation by region
χ2 = 7 0 .2 , df= 2 1 , p= 0 .0 0 0 * * *
Figure 3 .1 2 . Share of workforce applying office automation by sector Figure 3 .1 2 . Share of workforce applying office automation by sector
χ2 = 1 1 8 .3 , df= 1 8 , p= 0 .0 0 0 * * *
0 % 20 % 40 % 60 % 80 % 100 %
business services
transport&finance
heavy manufact.
sales, hotel, etc.
other manufact.
construction
light manufact.
Total
1-10% 11-30% 31-80% 81-100% 0 % 20 % 40 % 60 % 80 % 100 %
Portugal
Stuttgart
Lazio
Ireland
West London
Flanders
Tampere
Niederösterreich
Total
3 .1 .3 Software applications at production stages
Computer support and automation in production concerns companies in manufacturing sectors in the first place; only few production stages can be used in the service companies as well. Therefore, the share of companies having answered to the related question is smaller than the average. In general, the lack of automation use in production and the isolated use are more common in service sectors. About half of them have not answered to this question at all, and over half of the service companies that answered use automation only at one or two stages of the production.
Table 3 .3 . provides information about the stages in the production process which companies find suitable for automation and about the actual application of automated systems in various stages of the production process. Computer systems4 are used the most in the planning and preparation stage
(6 1 % ), and in the design stage (5 8 % ) of the production.
Table 3 .3 . Computer-supported stages of production process Table 3 .3 . Computer-supported stages of production process Applicable stages Applicable stages In use
In use PlannedPlanned NotNot in use in use Total Total Not Not applicable applicable N N
Design of products
Design of products 5 8 % 2 % 4 0 % 1 0 0 % 2 4 % 5 8 3
Planning and preparation
Planning and preparation 6 1 % 8 % 3 1 % 1 0 0 % 1 8 % 5 8 4
Treatment of products
Treatment of products 4 3 % 2 % 5 6 % 1 0 0 % 2 9 % 5 7 8
Process control
Process control 4 2 % 4 % 5 5 % 1 0 0 % 2 5 % 5 8 3
Transport or warehouse Transport or warehouse management
management
3 0 % 5 % 6 5 % 1 0 0 % 2 6 % 5 8 1
Maintenance planning or Maintenance planning or quality management quality management
4 9 % 9 % 4 3 % 1 0 0 % 1 9 % 5 8 4
4 Some examples of the different computer systems were given for the respondents in the questionnaire. CAD
(Computer-Aided Design) and CAE (Computer-Aided Engineering) are computer systems for the design o f pro ducts. Likewise, MRP (Manufacturing Resource Planning) and technical production- and work preparation for systems for planning and preparatio n o f the pro ductio n pro cess. In the treatment o f pro ducts, CNC, DNC or industrial robots, for example, can be used. PLCs (Programmable Logic Controllers), DCS (Distributed Control System) and PCs with adequate software can be used in pro cess co ntro l. The example systems for
In Figure 3 .1 3 ., we can see the average applicable and automated production stages by firm size, industrial sector, and region. Large companies of course are able to apply automation in more stages of the production process than small companies, and they actually also automate production stages more often. And, for companies in manufacturing sectors, the range of stages suitable for automation is naturally wider (on average nearly 8 0 % of the six stages) than for companies in the service sectors (less than 3 0 % ). However, the transport & finance sector and the business service sector both automate as much as light and heavy manufacturing. Automation is applied the most in the dispersed sector of other manufacturing.
Production automation is the most widespread in companies in Portugal, the Stuttgart area and the Republic of Ireland (about 6 0 % of the applicable production stages). In Lazio and Flanders, the firms automate only up to 4 0 % of the applicable production stages on average.
Figure 3 .1 3 . Average applicable and automated production stages by firm size, industrial Figure 3 .1 3 . Average applicable and automated production stages by firm size, industrial
sector and region sector and region
0 % 10 % 20 % 30 % 40 % 50 % 60 % 70 % 80 % 90 %
20-49 50+
Light manufact. Heavy manufact. Other manufact. Construction Sales, hotel, etc. Transport&finance Business services
Flanders Lazio Niederösterreich Portugal Ireland Stuttgart Tampere West London
applicable stages (% of the "six") automated stages (% of applicable)
Size
Sector
The following figures include only manufacturing companies. Automation of the production process in manufacturing is the most advanced in Portugal and in the Stuttgart area (Figure 3 .1 4 .). Companies in Lazio and Niederösterreich are clearly lagging behind in the overall application of automation; in transport and warehouse management they are among the top users.
Figure 3 .1 4 . Automation of applicable production stages by region Figure 3 .1 4 . Automation of applicable production stages by region
χ2 counted on frequencies of applying/not applying companies by region: Design of products, χ2 = 2 8 .9 , df= 7 , p= 0 .0 0 0 * * *
Planning and preparation, χ2 = 1 9 .6 , df= 7 , p= 0 .0 0 6 * * Treatment of products, χ2 = 2 1 .4 , df= 7 , p= 0 .0 0 3 * *
Process control, χ2 = 1 8 .0 , df= 7 , p= 0 .0 1 2 *
Transport or warehouse management, χ2 = 9 .9 , df= 7 , p= 0 .0 1 9 3 Maintenance planning or quality management, χ2 = 4 9 .3 , df= 7 , p= 0 .0 0 0 * * *
0 % 10 % 20 % 30 % 40 % 50 % 60 % 70 % 80 % 90 %
Design of products
Planning and preparation of production
Treatment of products
Process control
Transport and warehouse management
Maintenance planning and quality management
Flanders Lazio
According to the industrial sectors (Figure 3 .1 5 .), automation varies significantly only in the design and treatment stages of products and in the process control stage. Automation is applied the most comprehensively in the other manufacturing sector. It is the least advanced in companies in the energy & construction industry. Large companies automate more of the applicable production stages than small companies (Figure 3 .1 6 .).
Figure 3 .1 5 . Automation of applicable production stages by sector Figure 3 .1 5 . Automation of applicable production stages by sector
χ2 counted on frequencies of applying/not applying companies by sector: Design of products, χ2 = 2 7 .1 , df= 3 , p= 0 .0 0 0 * * *
Planning and preparation, χ2 = 5 .0 , df= 3 , p= 0 .1 6 9 Treatment of products, χ2 = 2 0 .6 , df= 3 , p= 0 .0 0 0 * * *
Process control, χ2 = 1 0 .7 , df= 3 , p= 0 .0 1 3 *
Transport or warehouse management, χ2 = 3 .9 , df= 3 , p= 0 .2 7 6 Maintenance planning or quality management, χ2 = 3 .0 , df= 3 , p= 0 .3 8 5
0 % 20 % 40 % 60 % 80 % 100 %
Design of products
Planning and preparation of production
Treatment of products
Process control
Transport and w arehouse management
Maintenance planning and quality management
light manufact. heavy manufact. other manufact. construction Total