A Segmentation Method and Comparison of
Classification Methods for Thyroid Ultrasound Images
Nikita Singh
Deptt. of Computer Science, PEC University of Technology,
Chandigarh, India
Alka Jindal
Deptt. of IT,PEC University of technology Chandigarh, India
ABSTRACT
In the conventional and relatively simple image processing techniques are most important task in the field of medical imaging. In this work to provide information about segmentation and classification methods that are very important for medical image processing. Ultrasound is unique in its ability to image patient anatomy and physiology in real time, providing an important, rapid and non-invasive means of evaluation. In this paper uses the groups of Benign and Malignant thyroid nodules images. These images used to analysis the classification accurately. GLCM extracts the total 13 features and these features are used to analysis in classifiers such as SVM, KNN and Bayesian. Experimental results illustrated that the classifiers like SVM/k-NN/Bayesian comparing to each other and enhanced classification accuracy. Result shows the SVM is best classification method and the performance measure such as accuracy. It is observed that the SVM gives much better accuracy than KNN and Bayesian.
KEYWORDS
Thyroid Ultrasound (US) images, FNA, feature extraction, GLCM, RBAC, SVM, KNN and Bayesian.
1. INTRODUCTION
Thyroid gland is one of the largest endocrine gland and is located below the skin and muscles at the front of the neck. In modern medicine, various medical images – ultrasound, CT, Scintigraphy, SPECT, MR, PET, X-rays etc play an important role in process of disease diagnosing and treating and have become major evidence to ensure disease [1]. Ultrasonography is the most well accepted imaging modality for the diagnosis and follow-up of thyroid disorder. The advantages of using ultrasonic imaging include its mobility and low cost as well as the ability to measure the dimension of the gland check for the presence of masses or cysts and evaluate the structure and echogenicity of the parenchyma [2]. Ultrasound (US) is the most sensitive imaging test available for the examination of the thyroid gland, to detect thyroid lesions, accurately calculate their dimensions, and identify the internal structure. A thyroid ultrasound examination
Provides an objective and precise method for detection of a change in the size of the nodule, used to evaluate the US features,
which include size, echogenicity (hypo echoic or hyper echoic), and composition (cystic, solid, or mixed), as well as presence or
Absence of coarse or, a halo and irregular margins[3]. Segmentation plays an important role in medical imaging to obtain the location of the object of interest as well as to detect the area, volume or the analysis of dynamic behaviour of anatomical structure over time [4]. Thus by segmentation process the affected or the region of interest can be separated from other tissues. To detect the abnormality of thyroid gland, first the location and size of the gland must be segmented. A segmentation algorithm based on localized based [5] method to segment the local area of the images and to segment the nodule which is gives the information of which type of nodule exist benign and malignant. In digital image processing techniques offer the opportunity for texture description. The thyroid nodule can be characterized by texture description and quantifying properties [2]. The thyroid texture characterization based on statistical parameter could provide an objective diagnostic tool and contribute to the use of computer assisted application in thyroid disorders. The most famous feature extraction technique are presented based on (GLCM) next, classification method which is able to distinguish between a benign (non cancerous) nodule and malignant (cancerous) have been present based on the SVM classifier, KNN classifier and Bayesian classifier.
In previous researches discussed about literature review on feature extraction approaches for thyroid ultrasound image analysis. Maria E. Lyra [13] et al. proposed a method to characterize the thyroid in ultrasound images, Xiangbin Wang [14] et al. In content-based image retrieval, technology could be applied to medicine the query criteria itself is an image or the description of image content, Dimitris Maroulis [15] et al. The robustness of textural features on speckle noise is of vital importance for ultrasound imaging, Dimitris Maroulis [16] et al. The inherent speckle noise in the images produced by this technique introduces uncertainty; we proposed a novel fuzzy feature extraction method to encode local texture, Si Luo [17] et al. proposed to evaluate whether ultrasound elastography can be used as a screening tool to reduce the number of FNA procedures on benign thyroid nodules.
nodular (noncancerous) region in the normal thyroid nodule images and nodular (with cancerous) region in the abnormal thyroid nodule images. Segmented images were used to extraction techniques and used SVM, KNN and Bayesian classifier. From this module classified result, the results obtained from the performance measures such as accuracy are calculated
The rest of this paper is organized as follows. Methodology in section II introduces a description of the main components of the proposed scheme. Then in section III result and discussion performance Evaluation study on real US thyroid data is presented, demonstrating the effective accuracy. Finally in the last section IV the conclusion of this study is summarized.
[image:2.595.313.556.264.692.2]2. PROPOSED METHODOLOGY
Table 1. US Feature of Malignant and Benign Thyroid Nodules [18]
US Feature of Malignant thyroid nodule
Range
Shape– irregular ≥1cm
Echo structure solid ≈ 𝟏cm
Internal echo heterogeneous 0.9989
US Feature of Benign thyroid nodule
Range
Ovoid or flat shape ≤ 𝟏cm
Echo structure cystic <1cm
Internal echo homogeneous
0.9893
2.1 Database
The famous medical imaging is thyroid Ultrasound images. These images are mixed types like some images has nodules, some images has not nodules, some type of images are non-cancerous and some type of images are non-cancerous nodule. Total 13 Number of thyroid images were used where total 8 cancerous and 5 non-cancerous images was selected in database. These thyroid images provided by internet (Thyroid Images Wilmington Endocrinology PA, Gallery- category-thyroid Ultrasound Images). The format of images was used in JPEG.
2.2. Software and computer used for
analysis
MATLAB version 7.7.0 (R2008b) and image processing Toolbox were used). For our analysis and used a computer with Intel® Core™i3-350M Processor 2.26 GHz CPU and 3 Gigabyte of memory.
2.3. Data pre-processing
Ultrasound images contain speckle noise and to remove the noise various filters are used and also used histogram equalization produce visual differences and enhanced the contrast between images .The various modules of proposed work are classification of thyroid images and segmentation of thyroid nodular images. The basic steps of the proposed methodology are shown in (see Figure l)
Pre processing
Segmentation
[image:2.595.51.289.271.577.2]Classifiers
Fig 1: Flow chart of the proposed methodology Filters
Feature extraction
Localization based active contour
Histogram equalization
Comparative analysis
SVM
KNN
Bayesian2.4. Texture analysis and feature extraction
Use Gray-co-matrix and extract features from that. GLCM calculates the probability of a pixel with the gray-level value i occurring in a specific spatial relationship to pixel with the value j. The number of gray levels in the image determines the size of the GLCM [6].
Although there is a function in Matlab Image Processing toolbox that computes parameters Contrast, Correlation, Energy, solidity and Homogeneity, the paper by Haralick suggests the tabulation form where few more parameters that are also computed here [7]. It is easy to add new features based on the GLCM using this code. And also calculate the new formulas which is helps to extract the US features and also helpful to disguising the benign and malignant nodules.
There are following feature extraction equations:
Correlation = 𝑖𝑗 𝑃 𝑖,𝑗 −𝜇𝑥𝜇𝑦
𝐿 𝑗 =0 𝐿 𝑖=0
𝜎𝑥𝜎𝑦
Difference Entropy = 𝐿𝑖=0𝑃𝑥−𝑦 𝑖 𝑙𝑜𝑔(𝑃𝑥−𝑦(𝑖))
DifferenceVariance= 𝐿𝑖=0(𝑖 − 𝐿𝑗 =0𝑗𝑃𝑥−𝑦 𝑗 )2𝑃𝑥−𝑦(𝑖) Sum average = 2𝐿𝑖=2𝑖𝑃𝑥+𝑦(𝑖)
Sum Entropy = - 2𝐿𝑖=2𝑃𝑥+𝑦 𝑖 𝑙𝑜𝑔(𝑃𝑥+𝑦(𝑖))
Sum of Squares = 𝐿𝑖=0 𝐿𝑖=0 𝑖 − 𝜇 2𝑃(𝑖, 𝑗)
Sum Variance = 2𝐿𝑖=0 𝑖 − 𝐹5 2𝑃𝑥+𝑦(𝑖)
Contrast = 𝐿𝑛=0𝑛2 𝐿𝑗 =0 𝑃(𝑖, 𝑗) 𝑖−𝑗 =𝑛 𝐿
𝑖=0
Energy= 𝐿𝑖=0 𝐿𝑖=0(𝑃(𝑖, 𝑗))2
Entropy = - 𝐿𝑖=0 𝐿𝑗 =0𝑃 𝑖, 𝑗 𝑙𝑜𝑔𝑃(𝑖, 𝑗)
Local Homogeneity = 𝐿𝑖=0 𝐿𝑗 =01+(𝑖−𝑓)𝑃(𝑖,𝑗 )2
ClusterShade= 𝑖 − 𝐸𝑥+ 𝑗 − 𝐸𝑦 3
𝑃(𝑖, 𝑓)
𝐿 𝑗 =0 𝐿 𝑖=0
ClusterProminence= 𝑖 − 𝐸𝑥+ 𝑗 − 𝐸𝑦 4
𝑃(𝑖, 𝑓)
𝐿 𝑗 =0 𝐿 𝑖=0
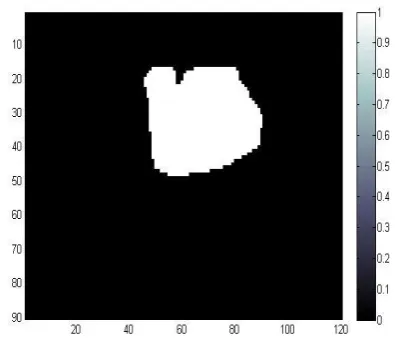
2.5. Segmentation
We process the image from the region using the segmentation based algorithm localized based active contour (region based) [5] method that is basically to select the small region of the thyroid nodule or to segment the local area of the images and to segment the nodule which is give the information of which type nodule exist benign and malignant.
Fig 2: segmentation procedure
In Figure 2 shows the proper procedure of segmentation algorithm the thyroid benign image are segmented with:
The number of iteration to run segmentation for. There will be done in total 500 iteration values.
Set the mask in initialization step. These masking is depends upon images where which part will be segmented according to its mask value.(1 = foreground, 0 = bg).
Mask= m (55:80, 105:165) = 1
Fig 3:Segmented image
RBAC effectively segments the thyroid gland in US images [5]. RBAC algorithm provides robustness against initial curve placement and insensitivity to image noise. RBAC achieves minimize energy:
E ( 𝜑 ) = ∫Ω
x𝛿𝜑 𝑥 ∫Ωxℬ 𝑥, 𝑦 . 𝐹(𝐼 𝑦 , 𝜑(𝑦)) dydx +
𝜆∫Ω
x𝛿𝜑 𝑥 ∨ 𝜑(𝑦) 𝑑𝑥
The images are inverted to remove noise from the image.
2.6 Classifiers
Following types of classification methods are discussed:
2.6.1 Support vector machine
[image:3.595.332.530.374.554.2]for pattern recognition, machine learning and bioinformatics (protein classification and cancer classification) [10]. In SVM, a separator hyperplane between two classes is chosen to minimize the functional gap between two classes, the training data on the marginal sides of this optimal hyperplane called support vector. The Learning process is the determination of those support vectors. For non linearly- separable data, SVM maps the input vector from input space to some normally higher dimension feature space given by kernel function. The kernel function is an important step is successful design of a SVM in specific classification task.
2.6.2 K-nearest neighbour
The k-nearest neighbor’s algorithm (k-NN) is a method for classifying objects based on closest training examples in the feature space. KNN is a type of instance-based learning, or lazy learning where the function is only approximated locally and all computation is deferred until classification. The k-nearest neighbor algorithm is amongst the simplest of all machine learning algorithms: an object is classified by a majority vote of its neighbors, with the object being assigned to the class most common amongst its k nearest neighbors (k is a positive integer, typically small). If k = 1, then the object is simply assigned to the class of its nearest neighbor [29].
2.6.3 Bayesian classifier
Bayesian classifiers have been used in many areas of medicine. For example, to built a Bayesian classifier to predict breast cancer. And also given that sonographic features predictive of malignancy have been extensively studied and the sensitivity and specificity of these features for malignancy are readily available [12]. In simple terms, a naive Bayes classifier assumes that the presence (or absence) of a particular feature of a class is unrelated to the presence (or absence) of any other feature, given the class variable.
For example, a thyroid image may be considered to be an nodular if its shape is oval, size is can be >1. Even if these features depend on each other or upon the existence of the other features, a naive Bayes classifier considers all of these properties to independently contribute to the probability that this thyroid image is a nodular.
2.7 Performance measure
Quantitative measurement of classification accuracy is calculated in term of true positive (TP), true negative (TN), false positive (FP), false negative (FN) with respect to the ground truth. Performance metrics calculation:
PPV=𝑇𝑃+𝐹𝑃𝑇𝑃
NPV=𝑇𝑁+𝐹𝑁𝑇𝑁
Specificity SP = 𝑇𝑁+𝐹𝑃𝑇𝑁
Sensitivity SE= 𝑇𝑃+𝐹𝑁𝑇𝑃 Accuracy = 100*((TP+TN)/n)
3. RESULT
[image:4.595.312.549.86.325.2]Total no. of 13 images was used. Where 8 images were malignant (cancerous) and 5 images were benign (non-cancerous). And total 13 features were extracted with the help of GLCM. According to features matrices there are five type of features were used which is helpful to exacts the features of images or texture of images. These following features are calculated:
Table 2. Shows the formulas for US images
AP Area/Perimeter
compactness (Perimeter) 2/Area
Solidity area/convex area
Eccentricity Minor Axis Length / Major Axis Length
Bounding Box Cords
[d1 d2 d3 d4]
(x1 = Box(1); y1 = Box(2); x2 = Box(2); y2 = Box(2); x3 = Box(3); y3 = Box(4); x4 = Box(4); y4 = Box(4);)
d1 = sqrt((x1-x2)^2*(y1-y2)^2);
d2 = sqrt((x3-x4)^2*(y3-y4)^2)
d3 = sqrt((x4-x2)^2*(y4-y2)^2);
d4 = sqrt((x1-x3)^2*(y1-y3)^2);
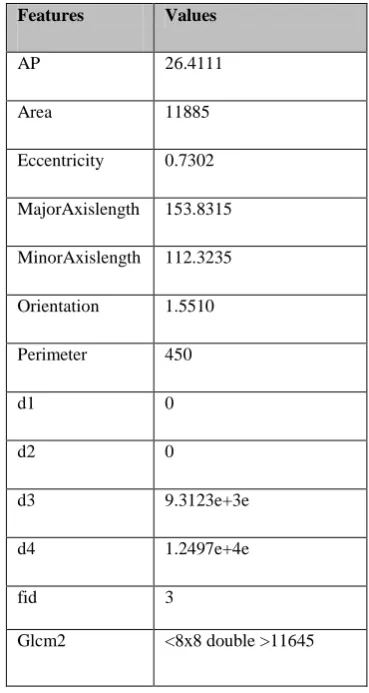
Table 3. feature extracted values
Features Values
AP 26.4111
Area 11885
Eccentricity 0.7302
MajorAxislength 153.8315
MinorAxislength 112.3235
Orientation 1.5510
Perimeter 450
d1 0
d2 0
d3 9.3123e+3e
d4 1.2497e+4e
fid 3
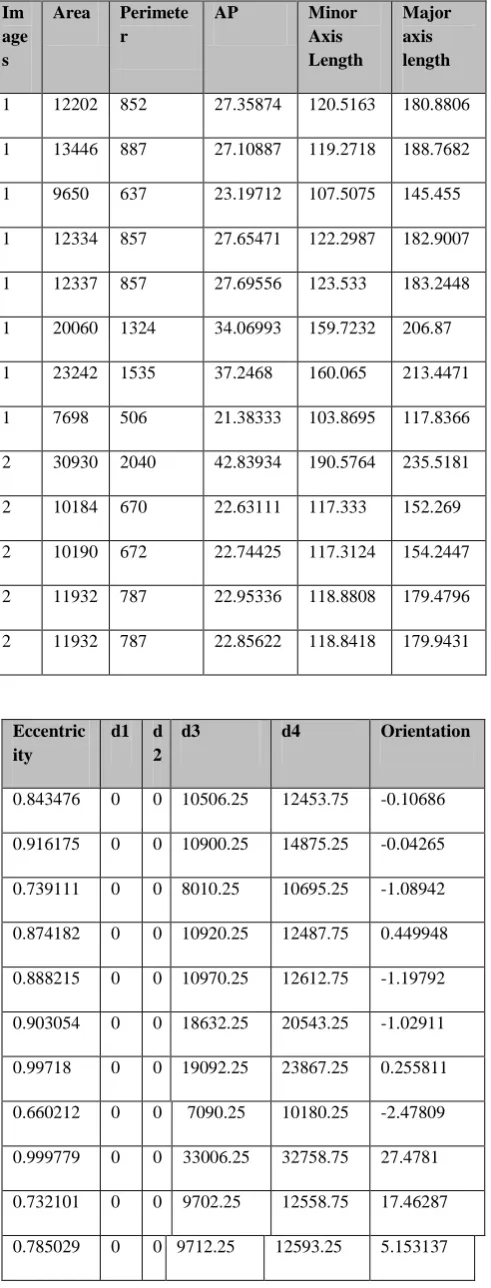
[image:4.595.333.518.357.704.2]Table 4.feature.txt file shows the feature values of malignant (name -1) and benign (name-2) where these
values may be in decimal or floats
Eccentric ity
d1 d 2
d3 d4 Orientation
0.843476 0 0 10506.25 12453.75 -0.10686
0.916175 0 0 10900.25 14875.25 -0.04265
0.739111 0 0 8010.25 10695.25 -1.08942
0.874182 0 0 10920.25 12487.75 0.449948
0.888215 0 0 10970.25 12612.75 -1.19792
0.903054 0 0 18632.25 20543.25 -1.02911
0.99718 0 0 19092.25 23867.25 0.255811
0.660212 0 0 7090.25 10180.25 -2.47809
0.999779 0 0 33006.25 32758.75 27.4781
0.732101 0 0 9702.25 12558.75 17.46287
0.785029 0 0 9712.25 12593.25 5.153137
0.794066 0 0 9713.25 12537.75 7.854064
[image:5.595.53.299.114.759.2]0.798651 0 0 9706.25 12498.75 3.302126
Table 5. shows the TP, TN, FN, FP, specificity, sensitivity and GM for SVM, KNN and Bayesian classifiers
Selected features
SVM KNN Bayesian
TP 8 6 0
TN 3 0 5
FN 2 2 8
FP 0 5 0
Specificity 1.00 0.00 1.00
Sensitivity 0.80 0.75 0.00
PPV 1.00 0.55 Nil
NPV 0.60 0.00 0.38
GM 1.34 0.87 1.00
Fig 4:True positive graph
This graph show the predictive value (true positivity) of support vector machine is higher than KNN and Bayesian.
0 0.1 0.2 0.3 0.4 0.5 0.6 0.7 0.8 0.9
0 2 4
Series1
SVM
KNN
Bayesian
TP
Im age s
Area Perimete r
AP Minor
Axis Length
Major axis length
1 12202 852 27.35874 120.5163 180.8806
1 13446 887 27.10887 119.2718 188.7682
1 9650 637 23.19712 107.5075 145.455
1 12334 857 27.65471 122.2987 182.9007
1 12337 857 27.69556 123.533 183.2448
1 20060 1324 34.06993 159.7232 206.87
1 23242 1535 37.2468 160.065 213.4471
1 7698 506 21.38333 103.8695 117.8366
2 30930 2040 42.83934 190.5764 235.5181
2 10184 670 22.63111 117.333 152.269
2 10190 672 22.74425 117.3124 154.2447
2 11932 787 22.95336 118.8808 179.4796
Fig 5: performance graph of sensitivity and specificity of classifiers
Fig 6:Performance graph of positive and negative predicative value
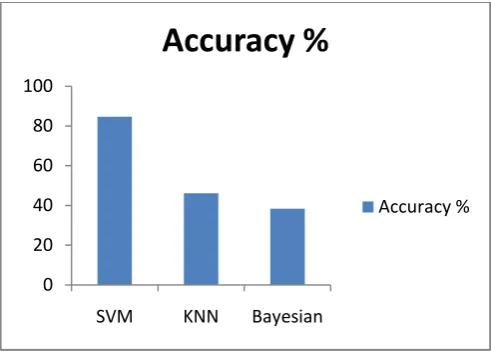
Table 6. Accuracy of Classification Methods
Classifiers ACCURACY
SVM 84.62%
KNN 46.15%
Bayesian 38.46%
Note- According to the table 6 SVM shows the best classification accuracy just because of SVM has Ability to handle large dataset where thyroid US imaging were use, memory efficient and also has maximum margin hyper plane that gives the greatest separation between the classes. A set of support vectors can uniquely define the maximum margin hyperplane for the learningproblem.SVM is extremely powerful nonlinear classifiers.
Fig 7:Accuracy of classifiers
From the analysis, it is evident that the classification performance of SVM is higher as compare to KNN and Bayesian.
4. CONCLUSION
Medical images are a widely used tool for clinical diagnosis, although it is time consuming for physicians to manually segment the thyroid nodule. This work proposed the method of classification of thyroid using the Bayesian, KNN and SVM [6], segmentation of thyroid nodules. From the experimental results, it is concluded that SVM gives the better classification accuracy than KNN and Bayesian. Our resulting SVM performance accuracy is about 84.62% was obtain. SVM is best classifier method. The utilization of new and more efficient classifiers could improve the accuracy performance thyroid. The features served as input into all classifiers in this study has proven to posses high discriminatory attributes [11] however the generation of more feature may enhance the evaluation procedure accuracy. This work is really efficient platform for researchers and scientist. In this work it can be easily to detect and analysis the what kind of problem is occurred (diseases or not) and what are the risk factor? This software platform can be Evolvement of the proposed time effective scheme, cost effective for application in an integrated real time system for the assessment of the thyroid carcinoma.
For Future perspective in this work using segmentation algorithm and set the masking values for future work using automatic segmentation method and further classify the type thyroid for example the Papillary and/or mixed papillary and Follicular and/or Hurthle cell thyroid cancer.
5. REFERENCES
[1] Ms. Nikita Singh, Mrs Alka Jindal “A Survey of Different types of Characterization Technique in Ultra sonograms of the Thyroid Nodules” Published in international journal for computer science and informatics volume 1 issue 4. 2012.
[2] Maria E. Lyra, Nefeli Lagopati, paraskevi charalabatou, Efrosini vasoura, Aristides, costas georgosopoulos, “Texture characterization in Ultrasound of the thyroid 0
0.2 0.4 0.6 0.8 1 1.2
SVM KNN Bayesian
statistical classification
Specificity
Sensitivity
0 0.2 0.4 0.6 0.8 1 1.2
SVM KNN Bayesian
PPV
NPV
0 20 40 60 80 100
SVM KNN Bayesian
Accuracy %
[image:6.595.313.559.71.249.2] [image:6.595.54.296.302.461.2]gland”. Information Technology and Applications in Biomedicine (ITAB), 2010 10th IEEE.
[3] Mary C. Frates, Carol B.Benson, “Management of thyroid nodules detected at US: society of radiologists in ultrasound consensus conference statement” radiology 2005.
[4] D.Selvathi, V.S.Sharnitha “Thyroid classification and segmentation in ultrasound imaging using machine learning algorithm” international conference on signal processing, communication, computing and network techniques (ICSCCN) 2011.
[5] Shawn Lankton, Allen Tannenbaum “Localizing Region-Based Active Contours” IEEE TRANSACTIONS ON IMAGE PROCESSING, VOL. 17, NO. 11, NOVEMBER 2008. Published in final edited form as:IEEE Trans Image Process. 2008 November; 17(11): 2029–2039.
[6] P. Babaghorbani, S. Parvaneh “sonography images for breast cancer texture classification in diagnosis of malignant or benign tumours” IEEE 2010.
[7] A. Uppuluri. GLCM Texture
Features,http://www.mathworks.com/matlabcentral/fileexc hange/22187-glcmtexture- features.
[8] Chuan-Yu Chang, “Classification of the thyroid nodules using SVM”, Neural network, 2008. (IEEE world congress on computational 2008.
[9] D.E Maroulis, M.A Savelonas, S.A Karkanis, D.K. Iakovidis, N.Dimitropoulos, “Computer- aided thyroid nodule detection in ultrasound images,’’ proc 18th IEEE Symposium on computer based medical system, 2005.
[10] Eystratios G. Keramidas “TND: A thyroid nodule detection system for analysis of ultrasound images and videos.” Springer 2010.
[11] Liujie “SVM-KNN Discriminative Nearest Neighbour Classification for Visual Category Recognition” Proceeding of the 2006 IEEE (CVPR’06).
[12] Yueyi I. Liu “Bayesian classifier for differentiating malignant and benign nodules using sonography features” AMIA 2008 symposium proceeding page-419.
[13] Maria E. Lyra, Nefeli Lagopati, paraskevi charalabatou, Efrosini vasoura, Aristides, costas georgosopoulos, “Texture characterization in Ultrasound of the thyroid gland ”.Information Technology and Applications in Biomedicine (ITAB), 2010 10th IEEE.
[14] Xiangbin Wang, JunminHe, “Texture-based retrieval of thyroid gland SPECT image”. The 2nd international conference on biomedical engineering and information IEEE. 2009.
[15] Eystratios G. Keramidas, “thyroid texture representation vie noise resistant image feature:, 21th IEEE international symposium on computer based medical system in 2008.
[16] Dimitris K. Iakovidis “Fuzzy Local Binary Patterns for Ultrasound Texture Characterization” 2008.
[17] Si Luo1, Eung-Hun Kim, ManjiriDighe and Yongmin Kim, “Screening of Thyroid Nodules by Ultrasound Elastography Using Diastolic Strain Variation” 31st Annual International Conference of the IEEE EMBS Minneapolis, Minnesota, USA, September 2-6, 2009.
![Table 1. US Feature of Malignant and Benign Thyroid Nodules [18]](https://thumb-us.123doks.com/thumbv2/123dok_us/8108102.790076/2.595.313.556.264.692/table-feature-malignant-benign-thyroid-nodules.webp)