Representation and Analysis of Object Oriented Graph
(OOG): A Graph Algorithmic Approach
Gitosree Khan
B. P. Poddar Institute of Management & Technology137 VIP Road Kolkata 700052, India
Sabnam Sengupta
B. P. Poddar Institute of Management & Technology137 VIP Road Kolkata 700052, India
Ananya Kanjilal
B. P. Poddar Institute of Management & Technology137 VIP Road Kolkata 700052, India
ABSTRACT
One of the primary concerns of the software industry lies in producing good quality software within estimated budget and time. With increased complexity of function rich software systems being developed and client’s emphasis on quality and conformance, lot of effort is invested in testing of a software product. In Object Oriented Graph, the graph data is stored in the form of a 3 dimensional matrix, i.e. sparse matrix. To address that problem, an enhancement of Object Oriented Graph is done, where our result shows a more efficient and effective Data Structure called Hierarchical Graph Adjacency List i.e. HGAL in which for each vertex in the graph, a list of all other vertices which it has an edge to (that vertex's "adjacency list"). In this paper, we have proposed three algorithm called Implementation of Hierarchical Graph into Adjacency List i.e., IHGAL for representation of an OOG to adjacency list and Identifying Constructs of Hierarchical Graph i.e. ICHG to identify different constructs and analyze the OOG ,Test Path Search (TPS) and Traversal of Trace Path i.e. TTP .On the basis of HGAL data structure our result shows all best possible paths with minimum test cases and detect minimum no. of independent paths in line with the definition of McCabe’s Cyclomatic complexity and measure the number of test path of different nodes in the OOG for finding the traceability among different phases of SDLC.
Keywords
Hierarchical graphs, Graph based test path, Graph based Trace path and Graph based analysis.
1.
INTRODUCTION
The size and complexity of the software system increases, testing becomes an important activity, which is not only confined to the testing of source code, but, also includes testing and verification of design and architecture. Designing effective test cases and identifying effective test suites consisting of effective test paths has become the prominent area of research these days. There are many limitations of UML. Firstly, UML is Visual not formal, so it is not possible to apply rigorous automated analysis or to execute a UML model in order to test its behavior, so graph formalism is used in many works. Secondly, it is not executable because it does not comprise of any code. Thirdly, UML diagrams depict different views of the same system. Possible inconsistencies are found in UML.Since, UML diagrams are not explicitly traceable, so Graph based analysis is done for traceability.
In our earlier work we have proposed a Graph model OOG to model the UML artifacts of an object oriented system through its different phases – requirement analysis, design & implementation that has been focus in the research work i.e. referred in [1]. In this work, we model the interrelationships
of artifacts as OOG and implement the OOG to be generically applicable. We propose a novel data structure called HGAL for OOG which help an effective storage of graph data in the memory and based on this data structure an algorithm called IHGAL is propose for representing the OOG into adjacency list. Various Graphs based algorithms towards a generic approach for overall analysis and testing of an object oriented system like ICHG, TPS and TTP to identify different constructs and to design effective test cases and calculate test path and trace path to the different phases of SDLC also. This is a generic approach that is applicable for all the phases of SDLC starting from requirement analysis, design, and implementation. This will also help us in requirement traceability and verification of consistency among the analysis and design models both in forward and reverse direction.
2.
REVIEW OF RELATED WORK
The OMG initiative MDA has revolutionized the way models would be used for development. Testing based on UML models has been lately quite an interesting area of research where behavioral diagrams like sequence, activity, state charts and use cases have been generally used. We have classified the research works into three categories. A) Testing or verification at the analysis phase, based on activity diagram, B) Testing or verification at the design phase, based on sequence diagram, C) Testing or verification based on object oriented code.
2.1 Verification at Analysis phase: Activity
Models
In this section we present the review of some of the research work on verification of OO systems based on UML activity diagrams which are used in the analysis phase to detail the use case flow of events.
the initial activity diagram are derived based on the single stimulus principle, which helps avoid the state explosion problem in test generation for a concurrent system. A graph based approach is done to measure the complexity of component based architecture in [14].
2.2 Verification at Design phase: Sequence
Models
Graph based methods are used in some to derive test paths, test cases or ensure scenario coverage in some of the behavioral diagrams. Graph theory is an area of mathematics that helps us in using graph based model information to test applications in many different ways. This section discusses some of them relevant to our domain of work.
In [9] an integrated approach to generate system level test cases and assess reliability of a system is proposed. The use case model is transformed into system sequence diagrams (SSD) and thereafter into usage graphs. Coverage criteria for covering all scenarios from the usage graph are proposed based on which test cases can be designed. In this work, scenarios are used to identify test paths. Scenarios are analyzed to identify test cases such that each path is covered.
A graphical model for sequence diagrams named sequence diagram graphs (SDG) have been developed in [10] which is closely related to our work and used to generate test cases from UML design diagrams. The nodes of SDG are augmented with different information necessary to compose test vectors. These information are mined from use case templates, class diagrams and data dictionary. The SDG is then traversed to generate test cases. However this work considers one sequence diagram at a time and the relation between them to realize a requirement is not yet explored.
We have extended this concept further in our work [2] to define a graphical model for integrating the sequence diagrams of a system for a particular use case, which will depict all the scenarios. It is a hierarchical graph where each node at the top layer is a sequence diagram and in the next layer is a SDG [10]. We also define a metrics to identify optimum number of paths in the D-SG as a function of the number of paths in the individual sequence diagrams. The paths within a sequence may be derived based on the path detection methods in [10]. This work in [2] will be particularly useful to be applied for modeling distributed systems. Further in [15], we propose Activity Relationship graph model that depicts the interrelationship of activity diagrams modeling a use case. We also define a set of metrics named Use case Scenario Paths (USP) that measures the minimum number of independent paths in ARG. An algorithm is proposed to analyze ARG and derive the number of Use case Scenario Paths. This gives a measure of the number of test paths for a requirement based on analysis models early in the life cycle.
2.3 Verification at Implementation phase:
Implementation Models
Software is tested usually to achieve two goals- achieve quality by detecting and removing defects (debug testing) and assessing existing quality for measuring reliability (operational testing). The relationship between the two testing goals using a probabilistic analysis has been the focus of research work in [12]. In [13], a probe based testing technique has been designed that observes the internal details of execution. Probes are predetermined and rebuilt and test coverage reports are generated at probe, method, class, inheritance, regression and dynamic binding levels. In [11], a
combination of use cases and cause effect graphing has lead to the development of a rigorous approach for acceptance testing which ensures function coverage as well. In [12] Bixin Li describes new techniques based on object oriented program slicing techniques that compute the amount and width of information flow, correlation coefficient and coupling among basic components. In [13] dynamic data flow analysis in Java programs has been presented to detect data flow anomalies.
Bertolino et al. Al presents a generalized algorithm in [13] that generates a set of paths that covers every arc in the program flow graph for branch testing of program code. In [3, 5] we have proposed an extension of McCabe’s CFG by Extended Control Flow Graph (ECFG).
Based on the reviewed works, we represent an OOG graph in our work using the adjacency list which is addressing the problem that arises in the previous research work, i.e., in OOG, the graph data is stored in the form of a 3 dimensional matrix. But, that was a sparse matrix, where, most of the cells hold the value null, which is wastage of resources. So, in this work the OOG in the form of adjacency list will help to detect all possible number of path and nodes in each path in that graph such that all nodes are covered and we describe each path along with the order of the node. An algorithm is proposed based on the data structure to identify the different constructs of OOG, where the different constructs are explained.
In this work, we use Graph theoretic techniques to model an object-oriented software system and proposed Graph based algorithms towards a generic approach for overall analysis and testing of an object oriented system. These works propose a graph based framework to ensure design effective test cases and calculate different test path with possible cases. As the use cases that capture a functional requirement are sometimes related by different relationships, and as the flow of events of use case is depicted visually using activity diagram, different activity diagrams are also related. This is a generic approach that is applicable for all the phases of SDLC starting from requirement analysis, design, and implementation phase.
3.
SCOPE OF WORK
Object Oriented Graph (OOG) is a graphical representation of the UML diagrams used in different phases of SDLC. In this paper, we propose an efficient data structure HGAL to represent OOG and two algorithms ICHG and TPS for identifying different constructs of OOG and test paths respectively. The rest of the paper is organized as follows:
which an algorithm called Traversal of Trace Path i.e. TTP is implemented. This will also help us in requirement traceability and verification of consistency among the analysis and design models both in forward and reverse direction.
4.
OBJECT ORIENTED GRAPH
(OOG) & ITS ENHANCEMENT
Testing based on UML models has been lately quite an interesting area of research where behavioral diagrams like sequence, activity, state charts and use cases have been generally used. In our earlier work [1] a graphical model – Object Oriented Graph (OOG) was proposed for object oriented software development life cycle. This graphical model can be applied for different phases of SDLC- requirement analysis, design, and implementation. We here briefly describe the features of OOG.
4.1
OOG Features
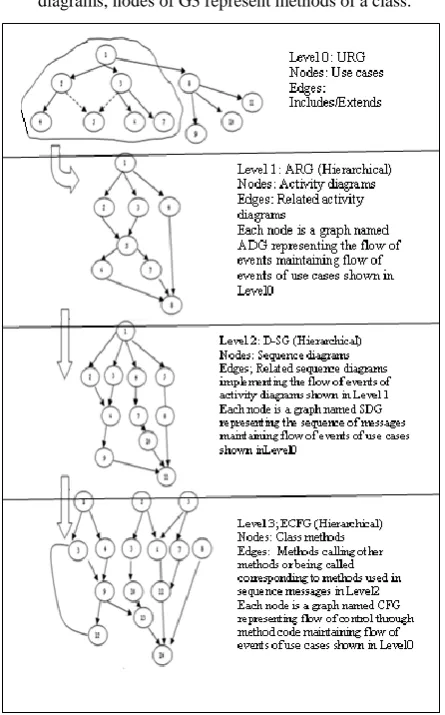
1. It is a multilayered graph which comprises of a graph at each level.
2. At each level, the graph comprises of nodes and directed edges.
3. The graphs at different levels are interconnected with each other in this order G0 G1 G2 G3
4. The significance of nodes and edges are different in each level. E.g. at L=1, the nodes of G1 represent activity diagrams, at L=2, nodes of G2 represent sequence diagrams, nodes of G3 represent methods of a class.
Fig 1: the Graph based Layered Framework: OOG
5. There may be different ways in which nodes are connected for each of which an edge is drawn. This depends upon the manner in which the diagrams are interleaved. The next section discusses the constructs of OOG and its significance corresponding to each different case of node connectivity for the different levels. 6. The edges drawn to represent connection/relation
between nodes are of different types like – firm edge, dotted edge, to model different cases of connectivity. 7. The nature of the OOG e.g. the out-degree and in-degree
of nodes, the depth depends upon the manner in which the nodes i.e. the diagrams are being called or referred. 8. Since the OOG has different meanings in different levels
depending on its context of use, we assign different names to the graph models for each level. They are – (a) Use Case Relationship Graph (URG) at Level-0. (b) Activity Diagram Graph (ARG) at Level-1. (c) Distributed Scenario Graph (D-SG) at Level-2. (d) Extended Control Flow Graph (ECFG) at Level-3.
4.2 Notations and terms used
We define certain terms and notations that we will be using in this paper and their relationship based on the features of OOG discussed in the previous subsection.
1. OOG: Object Oriented Graph comprising of several activity diagrams
2. ARG: Activity Relationship Graph comprising of several activity diagrams
3. D-SG: Distributed Scenario Graph comprising of several sequence diagrams.
4. E-CFG: Extended Control Flow Graph comprising methods of classes and their connectivity.
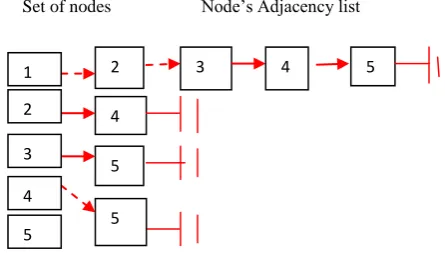
Table 1: Nodes and its corresponding adjacency list
5. OOG ENHANCEMENTS
In this section we propose an efficient and effective data structures called Hierarchical Graph Adjacency List i.e. HGAL to represent OOG. Using this we can navigate OOG easily and derive different constructs, requirement trace path and test paths as well.
5.1 Hierarchical Graph Adjacency List:
HGAL
[image:3.595.53.276.388.746.2]We use adjacency list for representation of the OOG, for storing a linked list of adjacent vertices for each vertex. The following shows the OOG and its corresponding adjacency list HGAL:
Fig 2: OOG Graph
2
4
3
In Fig 2, we have a directed OOG graph with five vertices, namely [1, 2, 3, 4, and 5]. For each vertex we keep a linked list of vertices that are adjacent to it. Each of the nodes of the OOG is connected by either firm edge or by dotted edges. Each adjacent nodes connected by firm edge, whose values stored as 1, and the nodes connected by dotted edge, the value is stored as 0.The corresponding data structure HGAL for representing the OOG into adjacency list is shown in Fig 2a.
A Hierarchical Graph Adjacency List is a data structure for representing hierarchical OOG graph. In HGAL we keep, for each vertex in the graph, a list of all other vertices which it has an edge to (that node’s "adjacency list”. In Table 1, we show the nodes of OOG and their corresponding adjacency list.
Fig 2a: List Representation of OOG: HGAL
The adjacency-list representation of the OOG is shown in Fig 2a & table 1.The arrow (->) means a link in a list. Since, the node 1->node 2, node1->3, by dotted edge, so vertex value is stored as 1,and the rest of the node in the graph is connected by node 1 by firm edges, its vertex value is stored as 0 in the list as it is depicted in the diagram. In this representation the n rows of the adjacency matrix are represented as n linked lists. There is one list for each vertex in OOG. The nodes in list I represent the vertices that are adjacent from vertex i. Each node has at least two fields: VERTEX and LINK. The VERTEX fields contain the indices of the vertices adjacent to vertex i. The adjacency list for OOG is shown above. Each list
has a head node. The head nodes are sequential providing easy random access to the adjacency list for any particular vertex.
5.2 Algorithm for Implementation of
Hierarchical Graph into Adjacency List:
IHGAL
Fig 3(A): Nodes which forms the part of the Graph, 3(B): Node which forms the part of the adjacency list
In Fig 3(A), nodes are having three fields. Firstly, vertex_val which stored the indices of the vertices adjacent to vertex i, secondly, down field represent the next adjacent node of the current vertex that is shown by red pointer, and thirdly, the next field represent the next node of the graph i.e. is represented by black pointer.
The IHGAL algorithm is as follows:
Step-1: Initialize the list which holds the nodes of the graph that are connected by firm/dotted edges.
Step-2: Make the list that holds the graph, having all the vertices in the graph
Step-3: For every vertex in that list do the following -
a. find the adjacent vertices, if any
b. add that vertex in the adjacency list for this current vertex
The implementation of Linked list Representation is shown in Fig 4
Different Nodes of HGAL
Link Nodes’ Adjacency list
node 1 adjacent to (->)
node 2
node 3
node 4
node 5
node 2 adjacent to (->) node 4
node 3 adjacent to (->) node 5
node 4 adjacent to (->) node 5
2 3 4 5
4 5 5 1
2 3 4 5
Set of nodes Node’s Adjacency list
struct adj_node /*the NODE which forms the part of the adjacency list; look at Fig [B]*/
{
char vertex_val;
struct adj_node *adj_next; /*red pointer*/
};
struct node /*the NODE which forms the part of the Graph; In refer to Fig [A]*/
{
char vertex_val;
struct adj_node *down;
struct node *next; /*black pointer*/
[image:4.595.59.282.243.377.2]Fig 4 : Linked list Representation
5.3 Identifying Constructs of Hierarchical
Graph: ICHG
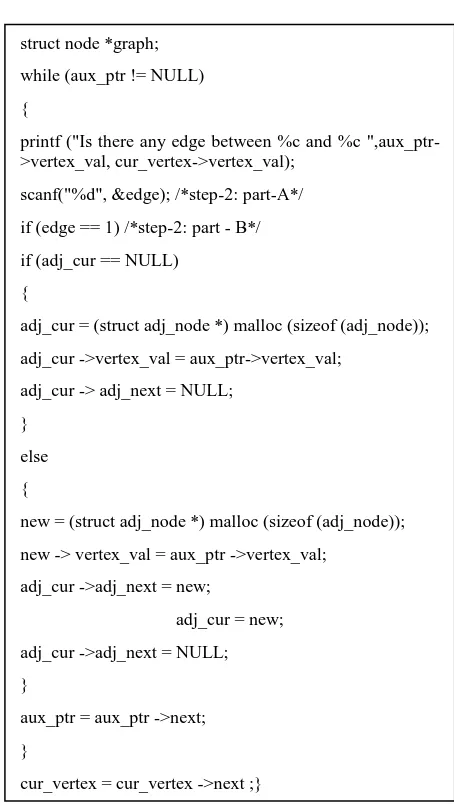
We discuss the generic algorithm for identifying different constructs of OOG based on the adjacency list representation. The OOG manifests itself as ARG, D-SG and ECFG [2, 3 and 5] in the later phases. In all these layers we use HGAL data structures for representation of the graphs. To identify constructs of OOG an algorithm ICHG is proposed, which is applicable in other phases of SDLC. In this section, we discuss the different cases that may arise in OOG and the algorithm to identify them.
Case 1: Nodes of OOG in sequence
This refers to nodes which have in-degree and out-degree equal to one. Nodes are connected to each other one after the other by firm edges in the OOG. If node N1 and N2 are in sequence, it means that the events or steps in N2 follow events or steps of N1.
Fig 5: Nodes of OOG in sequence
From the adjacency list, a set of nodes connected by firm lines denotes the group of nodes in sequence. This is identified by the black color arrow in the adjacency list of OOG. This can be easily identified from adjacency list where the following algorithm holds true.
1. for (i=0; i<p; i++); 2. p=a[i];
3. Cnt =0; 4. while (p) 5. { 6. Cnt++;
Then a[i] is in sequence, where a[i] is the starting address of the list Cnt is the counter which counts the no of nodes in the list
Case 2: Nodes of OOG connected with more than one node
[image:5.595.374.486.425.491.2]This refers to the case where the out-degree is more than one. Nodes are connected to each other by firm edges in the OOG. If node N1 calls N2, N3, N4, then the OOG will depict firm edges from N1 to each of N2, N3 and N4. It means that N2, N3 N4 are parallel and are connected to N1 at different points of its flow. The significance is different in different levels i.e. in ARG, D-SG and ECFG.
Fig 6: Nodes of OOG connected with more than one node
This can be identified from adjacency list where the following algorithm holds true.
1. for (i=0; i<p; i++); 2. P=a[i];
3. while (p) 4. { 5. Cnt++; 6. p=p->next; 7. }
8. If (cnt>2) 9. Then a[i] is calling
Where a[i] is the starting address of the list, next is the next node
Cnt is the counter which counts the no of nodes in the list
Case 3: Nodes of OOG being called/referred more than once N1
N2
N1
N2 N3 N4
struct node *graph;
while (aux_ptr != NULL)
{
printf ("Is there any edge between %c and %c ",aux_ptr->vertex_val, cur_vertex->vertex_val);
scanf("%d", &edge); /*step-2: part-A*/
if (edge == 1) /*step-2: part - B*/
if (adj_cur == NULL)
{
adj_cur = (struct adj_node *) malloc (sizeof (adj_node));
adj_cur ->vertex_val = aux_ptr->vertex_val;
adj_cur -> adj_next = NULL;
}
else
{
new = (struct adj_node *) malloc (sizeof (adj_node));
new -> vertex_val = aux_ptr ->vertex_val;
adj_cur ->adj_next = new;
adj_cur = new;
adj_cur ->adj_next = NULL;
}
aux_ptr = aux_ptr ->next;
}
This refers to the case where in-degree of nodes is more than one. Nodes are connected to each other by dotted edges in the OOG. If node N1, N2, N3 calls N4, then the OOG will depict firm edges from N1, N2, and N3 to N4. It means that N2, N3 N4 separately are connected to N1 at different points of their flow. The significance is different in different levels i.e. in ARG, D-SG and ECFG.
Fig 7: Nodes of OOG being called/referred more than once
This can be identified from adjacency list where the following algorithm holds true.
1. for (i=0; i<p; i++); 2. p=a[i];
3. Cnt=0; 4. while (p) 5. {
6. If (p->data==x)
7. Cnt++; 8.} 9. If (cnt>1) 10. Then x is called
Where a[i] is the starting address of the list
Cnt is the counter which counts the no of nodes in the list
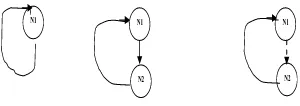
Case 4: Nodes of OOG in iteration/recursion
This refers to the case where a single node or a group of nodes is cyclically called or used. Cases where a group of nodes are in iteration, the group may be connected in any of the other three connections – sequence, calling multiple nodes, called from multiple nodes. Following Figures show visually the different constructs of an OOG.
Fig 7: Nodes of OOG in iteration/recursion
(
a) Single Node N1; (b) Group of Nodes (N1-N2 in sequence); ( c) N1 embedding/calling N2;One Node in iteration/recursion1. for (i=0; i<p; i++); 2. q=p=a[i]; 3. While (p) 4. {
5. If (q->data==p->data) 6. Cnt++;
7. P=p->next; 8.}
9. If (cnt>2)
10. a[i] is self recursion
A node of OOG (i.e., ARG, D-SG, and ECFG) may be connected in more than one ways. This is considered at the time of test path calculation.
6. ALGORITHM FOR IDENTIFYING
TEST PATHS IN OOG: TEST PATH
SEARCH (TPS)
Algorithm Test Path Search is used to identify minimum test paths of OOG in each phase of SDLC.The ECFG, D-SG, and ARG comprises of 2 layers. By applying depth-first search algorithm, we can traverse minimum no of independent test paths of OOG in each phase of SDLC.
The depth-first traversal technique is defined using an algorithm dftraverse(s) that visits all nodes reachable from s. We assume an algorithm visit (nd) that visits a node nd and a function visited (nd) that returns TRUE if nd has already visited and FALSE otherwise. This is best implemented by a flag in each node. Visit sets the field to TRUE. To execute the traversal, the field is first set FALSE for all nodes. The traversal algorithm also assumes the function select with no parameters to select an arbitrary unvisited node. select returns null if all nodes have been visited.
1. for (every node nd) 2. Visited (nd) = FALSE;
3. s=a pointer to the starting node for the traversal; 4. While (s! =NULL) [
5. Dftraverse(s); 6. S=select (); 7. /* end while */
Note that starting node s is specified for the traversal. This node becomes the root of the first tree in the spanning forest. The following is a recursive algorithm for dftraverse(s), using the routines firstsucc and nextsucc
1. /* visit all nodes reachable from s */ 2. Visit(s);
3. /* traverse all unvisited successors of s */ 4. Firstsucc(s, yptr, nd);
5. while (yptr! = NULL) { 6. if (visited (nd) == FALSE) 7. dtraverse (nd);
8. nextsucc(s, yptr, nd); 9.} /*end while */
If it is known that every node in the graph is reachable from the starting node s, the spanning forest is a single spanning tree and the while loop and select are not required in the traversal algorithm, since every node is visited in a single call to dtraverse. A depth-first traversal, as it name indicates, traverse a single path of the graph as far as it can go (that is, until it visits a node with no successors or a node all of whose successors have already been visited).It then resumes at the last node on the path just traversed that has an unvisited successors and begins traversing a new path emanating from that node.
In linked representation, nextsucc is implemented as follows. (We assume arc arcptr field in each header node and ndptr and nextarc fields in each arc node.)
1. yptr =nextarc (yptr0;
2. ynode = (yptr == NULL)? NULL: ndptr (yptr); 3. Firstsucc is implemented by
Yptr =arcptr (X);
N1 N2 N3
N4
N1 N1
N2 N2
4. ynode = (yptr ==NULL)? NULL: ndptr (yptr);
Note that if e is the number of edges (arcs) in the graph and n the number of graph nodes/n is the average number of arcs emanating from a given node. Traversing the successors of a particular node by this method is therefore O (e/n) on the average. This is one of the advantages of the adjacency list representation.
The following are the steps to display all possible test path of the OOG in different phases of SDLC
1. Algorithm To print-test path-using array of elements (arrData, n, k )
2. {
3. item=arrData [k-1]; 4. for (i=k-1; i< n-1; i++) 5. arrData [i] =arrData [i+1]; 6. n=n-1;
7. return item; 8. }
In this algorithm, the size of the array represents the number of nodes in OOG. Here arrData [] is a one dimensional array with n number of nodes. Node item is to be deleted from the kth position of the array during traversing. The arrays of elements representing the node structure will display each time on traversal the graph, and each representation of array is the all possible test path starting from source node to destination node.
7. ALGORITHM TO DERIVE THE
TRACE PATH OF OOG: TRAVERSAL
OF TRACE PATH (TTP)
The following are the steps of algorithm for finding the trace path for the entire Object Oriented Graph. Here, by using the doubly linked list the graph is traversed in both the way.
Algorithm to find-trace-path using DLLNodes (ptrStart) 1. {DLLNode *ptrTemp;
2. ptrTemp=ptrStart; 3. iCount=0;
4. while (ptrTemp ! = NULL) 5. {
6. print (ptrTemp-.>iData); 7. iCount = iCount + 1;
8. ptrTemp = ptrTemp ->ptrRight; 9. }
10. return (iCount);}
8. CONCLUSION
Graph Based Analysis of Object Oriented System models at different phases of software development life cycle is a prominent area of research. In this paper, we propose an approach to represent the OOG in the form of adjacency list in order to address the previous problem of research of a suitable and efficient data structure to represent the graph. A generic algorithm is also proposed to identify the different constructs of the nodes of the OOG graph and for finding the test paths by considering all best possible paths with minimum test cases. For each layer it refers to test paths and for entire OOG the path refers to trace path. This approach improves the requirement traceability and verification of consistency among the analysis and design models both in forward and reverse direction. Requirement traceability in different phases of software development, consistency verification, designing effective test cases in different phases of SDLC can be done and the levels or extents of the properties can be measured in
an automated manner. This approach would help analysis of object oriented system to be more efficient and less complex.
9. REFERENCES
[1] Ananya Kanjilal, Sabnam Sengupta, Swapan Bhattacharya, “A Graph Model for Analysis of OO Systems”, Horizons of Computer Research, Vol 1, Nova Publishers, 2008.
[2] Ananya Kanjilal, Goutam Kanjilal, Swapan Bhattacharya, “Integration of Design in Distributed Development using D-Scenario Graph”, Third International Conference on Global Software Engineering (ICGSE‟08), Bangalore, India, pp 141-150, August 17-20, 2008.
[3] Swapan Bhattacharya and Ananya Kanjilal “Code Based Analysis of Object Oriented Systems”, Journal of Computer Science & Technology JCST, Vol 21, No. 6, pp 965-972, November 2006.
[4] Paolo Baldan, Andrea Corradini and Fabio Gadducci Specifying and Verifying UML Activity Diagrams Via Graph Transformation Lecture Notes in Computer Science Springer Berlin / Heidelberg 18-33Volume 3267/2005.
[5] Ananya Kanjilal, Goutam Kanjilal and Swapan Bhattacharya, “Extended Control Flow graph: An empirical approach”, Proceedings of CIT'03, Sixth International Conference on Information Technology, Bhubaneswar, India, December 22-25, 2003, page 151-156.
[6] Dong Xu Wei Liu Zongtian Liu Philbert, N., “Tool Support to Deriving Test Scenarios from UML Activity Diagrams”, International Symposium on Information Science and Engineering (ISISE, 2008) '08, pp 73-76, 20-22 Dec. 2008.
[7] Dong Xu, Philbert, N., Zongtian Liu, Wei Liu, “Towards Formalizing UML Activity Diagrams in CSP”, International Symposium on Computer Science and Computational Technology, 2008. ISCSCT '08, pp. 450 - 453 20-22 Dec. 2008
[8] Eshuis, R. Wieringa, R. , Tool support for verifying UML activity diagrams IEEE Transactions on Software Engineering, Volume: 30 , Issue: 7 pp437 - 447 July 2004
[9] Debasish Kundu, Monalisa Sarma, Debasis Samanta, “A Novel Approach to System Testing and Reliability Assessment Using Use Case Model”, 1st Indian Software Engineering Conference (ISEC), Hyderabad, India, Feb 20-21, 2008
[10]Monalisa Sarma, Debasish Kundu, Rajib Mall, “Automatic Test Case generation from UML Sequence diagrams”, Proceedings of International Conference on Advanced Computing and Communications, ADCOM 2007, Guwahati, India, pp 60-67, December 18-21, 2007.
[11]Robert Binder, “Testing Object-Oriented Systems: Models, Patterns and Tools”, Addison-Wesley, pp 582-583, 1999.
[13] A. Bertolino, M. Marre , “Automatic Generation of Path Covers Based on the Control Flow Analysis of Computer Programs"”, IEEE Transactions on Software Engineering, pp. 885-899, December 1994.
[14]Sabnam Sengupta, Ananya Kanjilal, Swapan Bhattacharya: Measuring complexity of component based architecture: a graph based approach. ACM SIGSOFT Software Engineering Notes 36(1): 1-10, 2011.