A SCALABLE DESIGN FRAMEWORK FOR VARIABILITY MANAGEMENT IN LARGE-SCALE SOFTWARE PRODUCT LINES
MUHAMMAD GARBA
MARCH 2016
ii
Abstract
Variability management is one of the major challenges in software product line adoption, since it needs to be efficiently managed at various levels of the software product line development process (e.g., requirement analysis, design, implementation, etc.).
One of the main challenges within variability management is the handling and effective visualization of large-scale (industry-size) models, which in many projects, can reach the order of thousands, along with the dependency relationships that exist among them. These have raised many concerns regarding the scalability of current variability management tools and techniques and their lack of industrial adoption.
To address the scalability issues, this work employed a combination of quantitative and qualitative research methods to identify the reasons behind the limited scalability of existing variability management tools and techniques. In addition to producing a comprehensive catalogue of existing tools, the outcome form this stage helped understand the major limitations of existing tools.
Based on the findings, a novel approach was created for managing variability that employed two main principles for supporting scalability. First, the separation-of-concerns principle was employed by creating multiple views of variability models to alleviate information overload. Second, hyperbolic trees were used to visualise models (compared to Euclidian space trees traditionally used). The result was an approach that can represent models encompassing hundreds of variability points and complex relationships. These concepts were demonstrated by implementing them in an existing variability management tool and using it to model a real-life product line with over a thousand variability points.
iii
Acknowledgements
I would like to thank Dr. Rabih Bashroush, my Director of Studies, Reader in Distributed Systems and Software Engineering, School of Architecture, Computing and Engineering (ACE), University of East London, for his intellectual guidance and constant support that has led to the completion of this thesis. Thanks also to my second supervisor, Dr. Usman Naeem, for his positive feedback and assistance in this research.
I am grateful to all people who provided their valuable insight to me, at meetings, or via email. I am particularly thankful to Dr. Adel Noureddine and Dr. Rick Rabiser for their incisive feedback. Thank you, my colleagues in the Research Centre, School of Architecture Computing and Engineering, for the many discussions that have contributed to my work in this thesis.
Finally, a special thanks to Alh. Wada Sani, for his moral and financial support. My sincere gratitude to my family and friends for their constant caring and support– this work would have not been possible without their sustained
understanding.
iv Contents
Abstract ... ii
Acknowledgements ... iii
List of Tables ... ix
Glossary ... x
1 Introduction ... 1
1.2 Problem Statement ... 6
1.3 Research Context ... 8
1.4 Research Aims ... 10
1.5 Research Questions ... 10
1.6 Research Methodology ... 11
1.7 Summary of Contributions ... 13
1.8 Thesis Structure ... 16
1.9 Bibliographical Notes ... 19
PART I: STATE OF THE ART ... 20
2 Literature Review Methodology ... 21
2.1 Introduction ... 21
2.2 Research Method ... 22
2.3 Data Extraction Results ... 35
3 Existing Variability Management Tools in Software Product Lines ... 44
3.1 Introduction ... 44
3.2 Variability Management ... 45
3.3 Variability Management Tools in Software Product Lines ... 48
3.4 Commercial Tools and Tool Adoption in Industry ... 50
3.5 Summary ... 55
4 Critical Analysis of Existing Approaches ... 57
4.1 Introduction ... 57
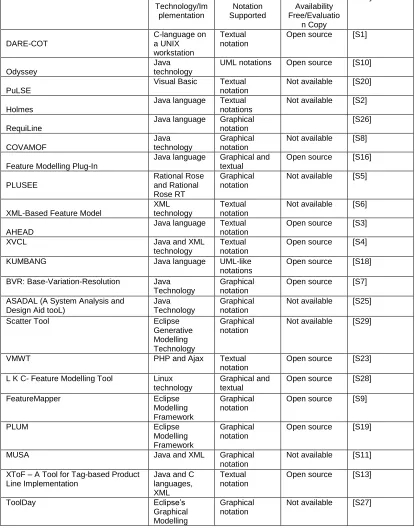
4.2 Key Characteristics of the Different Tools ... 59
4.3 Quality of the Research Conducted in the Reported Approaches ... 75
4.4 The Context of Research ... 81
4.5 Main Challenges Faced by Current Product Line Management (PLM) Tools 83 4.6 Summary ... 94
PART II: MUSA 1 Vs MUSA 2 ... 97
5 Theoretical Foundation of MUSA ... 98
v
5.2 Backgrounds and Motivation ... 99
5.3 Concept of Multitouch Technology ... 100
5.4 MUSA Theoretical Background ... 102
5.5 MUSA Technical Background ... 104
5.6 Implementation of the Earlier Version of MUSA Tool ... 106
5.7 Screenshots and Descriptions of the MUSA Tool Version One ... 110
5.8 Summary ... 113
6 Musa Version 2 ... 114
6.1 Introduction ... 114
6.2 The Musa Tool ... 115
6.3 Functionality of MUSA Using Case Studies ... 117
6.4 New Version of MUSA as Compared to Earlier Version ... 129
6.5 Summary ... 131
PART III: VALIDATION ... 132
7 Variability Management Evaluation Benchmark ... 133
7.1 Introduction ... 133
7.2 Methodology ... 133
7.3 Related Works ... 135
7.4 Benchmark ... 136
7.6 Setting up of the Evaluation ... 146
7.7 Summary ... 148
8 Case Studies and Experimental Evaluation of the Tools ... 149
8.1 Introduction ... 149
8.2 Case Studies ... 149
8.3 Results ... 151
8.4 Discussion, Lessons Learned and Recommendations ... 162
8.5 Summary ... 166
PART IV: ... 168
CONCLUSION AND FUTURE WORK... 168
9 Conclusions, Contributions, and Future Work ... 169
9.1 Conclusion ... 169
9.2 Review of Contributions ... 172
9.3 Future Work ... 176
APPENDES ... 196
Appendix A ... 197
vi
vii List of Figures
Figure 2.1: Systematic literature review process ... 23
Figure 2.2: SLR review protocol process ... 24
Figure 2.3: Study selection process ... 29
Figure 2.4: Percentage of each publication type ... 37
Figure 2.5: Distribution of primary studies over time ... 37
Figure 2.6: Gartner Hype Cycle reproduced based on (Linden and Fenn, 2003) ... 38
Figure 2.7: Phrase Map of studies published between 1997-2006 ... 40
Figure 2.8: Phrase Map of studies published between 2007-2015 ... 40
Figure 2.9: Summary of SLR review process... 40
Figure 3.1: Variability Meta-model for representing concepts in variability ... 46
Figure 4.1: Breakdown of tools based on the type of notation supported ... 61
Figure 4.2: Number of tools supporting each visualisation type ... 62
Figure 4.3: Number of views per tool for tools with more than one view ... 70
Figure 4.4: Tools with various textual notations ... 71
Figure 4.5: Frequency analysis of quality scores for each question ... 77
Figure 4.6: Distribution of total quality scores ... 77
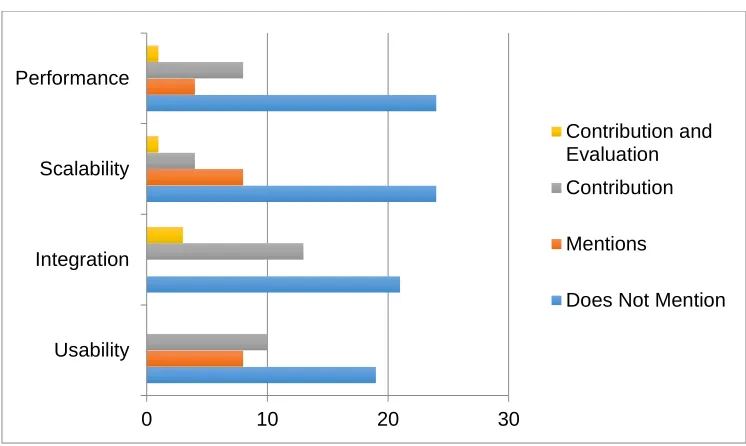
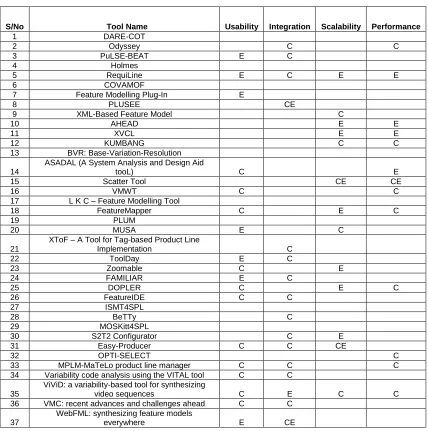
Figure 4.7: Frequency analysis of scores for each quality attribute ... 79
Figure 4.8: Research context of primary studies ... 82
Figure 4.9: Relevance of primary studies ... 83
Figure 5.1: Theoretical Foundation of MUSA ... 105
Figure 5.2: MUSA designed interface on MS-Surface showing the hierarchical view ... 108
Figure 5.3: MUSA designed interface on Windows 7 showing the hierarchical view ... 109
Figure 5.4: Main application window after successful log in ... 110
Figure 5.5: Options menu to load a tree ... 111
Figure 5.6: Viewing details of a selected feature ... 111
Figure 5.7: Click Edit button to start editing ... 112
Figure 5.8: Mandatory and optional feature distinction ... 112
Figure 6.1: Description of MUSA’s architecture ... 116
Figure 6.2: A new feature from scratch ... 118
Figure 6.3: Adding a name for the new feature ... 119
Figure 6.4: Select the Add button ... .122
Figure 6.5: Type a name and select its type ... 120
Figure 6.6: Sub-features of Test Feature- TF1-TF9 ... 120
Figure 6.7: Medium scale-size model ... 121
Figure 6.8: MUSA’s main browser View ... 122
Figure 6.9: The search process in MUSA ... 125
Figure 6.10: The feature properties window ... 126
Figure 6.11: MUSA’s dependency view ... 128
Figure 6.12: Generic_Product_Code_Parameter feature is mutually dependent on Parameters 8-19, Production Mode and Product Type features ... 128
Figure 6.13: Mutually exclusive relationships between features ... 129
Figure 7.1: The quality attributes used ... 137
Figure 8.1: Understandability of very small-scale size model ... 154
Figure 8.2: Understandability of different scale size ... 155
viii
Figure 8.4: Operability of very small-scale size models ... 157
Figure 8.5: Scalability measure of various sample sizes ... 160
Figure A1: FeatureIDE ... 241
Figure A2: FAMILIAR ... 241
Figure A3: CVM Tool ... 242
Figure A4: CaptainFeature ... 242
Figure A5: S2T2 ... 243
Figure A6: Odyssey ... 243
Figure A7: PLUM ... 244
Figure A8: MUSA ... 244
ix List of Tables
Table 2.1: Electronic databases used for searching for primary studies ... 27
Table 2.2: Quality assessment criteria ... 30
Table 2.3: Studies included in the final review ... 31
Table 2.4: Studies excluded in the final review ... 33
Table 2.5: Data extraction form ... 34
Table 3.1: Identified tools with their year of introduction ... 49
Table 4.1: Identified tools with assigned ID and their technical details ... 58
Table 4.2: Tools with FODA-like visual notations ... 63
Table 4.3: Tools with file Tree-like visualisation ... 65
Table 4.4: Tools with Graph, Logic Diagrams, UML and Hyperbolic Tree visualisations ... 68
Table 4.5: Tools with Code-like textual notations ... 71
Table 4.6: Tools with XML-based textual notations ... 72
Table 4.7: Tools with code based textual notations ... 73
Table 4.8: Results of the quality assessment of the primary studies ... 76
Table 4.9: Quality attributes addressed by studies ... 78
Table 4.10: Identified tools with the assessment summary results... 80
Table 4.11: Research context of the primary studies ... 81
Table 4.12: Summary results of VM tools challenges ... 93
Table 6.1: Comparisons between MUSA1 and MUSA 2 ... 130
Table 7.1: Ordinal scale type ... 138
Table 7.2: Tools description ... 143
Table 8.1: Usability of very small-scale size model ... 153
Table 8.2: Usability of different scale size ... 154
Table 8.3: Scalability measure ... 159
Table 8.4: Performance measure ... 161
Table 8.5: Integration measurement ... 161
x Glossary
ASADAL A System Analysis and Design Aid tooL BVR Base-Variation-Resolution
CASE Computer-Aided Software Engineering ConIPF Configuration in Industrial Product Families CPP C-preprocessor
DOORS Rational Dynamic Object Oriented Requirements System
DOPLER Decision Oriented Product Line Engineering for Effective Re-use EC Exclusion Criteria
EMF Eclipse Modelling Framework
EWSA European Workshop on Software Architecture FODA Feature Oriented Domain Analysis
FORM Feature Oriented Reuse Method GEMS Generic Eclipse Modelling Framework GMF Graphical Modeling Framework HCI Human Computer Interaction IC Inclusion Criteria
ISMT4SPLs Integrated Software Management Tool for Adopting Software Product Lines
LVAT Linux Variability Analysis Tools
MUSA Multitouch Variability Modelling Solution for Software Product Lines NUI Natural User Interface
OVM Orthogonal Variability Model PLM Product Line Management
PLUSEE Product Line UML-Based Software Engineering Environment RCP Rich Client Platform
RSEB Reuse-Driven Software Engineering Business SLR Systematic Literature Review
xi SPLC Software Product Line Conference SPLE Software Product Line Engineering SPLOT Software Product Lines Online Tools SXFM Simple XML Feature Model
UML Unified Modelling Language
VaMoS Workshop on Variability Modelling of Software Intensive Systems VARMA VARiability Modelling and Analysis
VisPLE International Workshop on Visualisation in Software Product Line Engineering
VM Variability Management VP Variation Points
WICSA Working International Conference on Software Architecture WPF Windows Presentation Foundation
1
Chapter 1
Introduction
Software Product Line Engineering (SPLE) is a paradigm of software
engineering for creating a portfolio or a collection of similar software products
with variations in their features and functions. The products can be software,
such as home automation system, as well as systems with software inside.
Typical example of these include; airplanes, automobiles, ships, cameras,
mobile phones, computers and tablets, among others (Krueger, 2007).
The SPLE technique provides a systematic way to reuse software assets.
These assets are the software artefacts or resources associated with your
products. The artefacts include, but are not limited to requirements analysis,
design specifications, software implementation, configuration, test plans, test
cases, etc. The assets are then engineered to be shared across the entire
product line, i.e., to be used in multiple products. Therefore, SPLE is a
technique that optimizes the reuse of existing software assets by creating
multiple applications that share many features, while still exhibiting certain
differences (Clements and Northrop, 2002, K. C. Kang et al., 2002). SPLE
allows for the planned reuse of artefacts among the software systems under
2
Some of the key advantages of Software Product Line (SPL) development
over “one at a time” system development include: productivity gains (the core
assets and architecture are reused), decreased time-to-market of products,
large-scale productivity, low-cost production, increased product quality and
reliability, and increased customer satisfaction (Clements and Northrop,
2001).
Over the last two and a half decades, SPLE has increasingly gained the
attention of researchers and practitioners alike. This is due to the potential
economic advantages and business competitiveness the SPLE process can
bring (Clements and Northrop, 2002, Van der Linden et al., 2007). The
benefits can range from cutting the development cost and increasing software
quality, to enabling mass customisation, market dominance, and reduced time
to market (Clements and Northrop, 2002, Pohl et al., 2005).
In traditional software development, individual software systems are
developed from scratch, i.e., one software at a time. Typical software
development process requires going through stages such as requirements,
analysis, design, implementation and testing to be performed. In contrast,
SPLE is centered around multiple developments of similar software systems
from a common core asset (Clements and Northrop, 2002, Pohl et al., 2005).
This is achieved by explicitly capturing the commonalities and variabilities in
the family of systems that forms the product line (Gomaa, 2005).
In addition, the market benefits encourage both, the software as well as the
3
software development to a product line approach. Various terminologies are
used to refer to SPL, such as software product families, system families, or
family of systems.
The SPLE process (Pohl et al., 2005, Bachmann and Clements, 2005)
involves studying and managing the common and varied features of the
different product line members, a process usually referred to as domain
engineering or development for reuse. Core (shared) assets – e.g.,
requirements, architecture, code, test cases – are then used as a basis to
derive products from the product line, a process usually referred to as
application engineering or development with reuse.
Correspondingly, defining and managing commonalities and variability in
software product lines is widely referred to as variability management and is a
key step of the SPL engineering process (Van Gurp et al., 2001). The
variability management process guides the construction of product line
variability models.
A lot of work has been conducted in the area which resulted in many
approaches including various techniques, methods, and tools. Typical
Examples of these include early methods: FODA (Kang et al., 1990) (Feature
Oriented Domain Analysis) for discovering and identification of prominent
distinctive features of software systems in a domain as well as presenting
commonalities among related software systems. FORM (Kang et al., 1998)
4
common and different features of an application and using the analysis results
to develop domain architecture and components.
Others are, FeatRSEB (Griss et al., 1998) (combination of the FODA method
and the Reuse-Driven Software Engineering Business method (RSEB)
(Jacobson et al., 1997)), this method includes domain engineering and feature
modelling into RSEB by extending the original feature diagram in FODA into a
network of features linked together using a unified modelling language (UML)
refinements. The method allows explicit representation of variation points.
Other approaches are: Decision-oriented modelling technique (Atkinson et al.,
2002), in which a set of questions (variation points) are described and a set of
possible answers or decisions to be choose from. This method offers
invaluable guidance to the development of product line variants using UML
within a Model Driven Architecture.
Furthermore, OVM (Pohl et al., 2005) (Orthogonal Variability Model) contains
the description of variation points (a representation of variability subject from
which possible selection can be made), variants (an identification of a single
option of variation point), and variability dependencies (constraints on variants
selection) and models the variability as a separate concern in a specific OVM
notations. ConIPF techniques pioneer by Bosch et al (Van Gurp et al., 2001),
which uniformly models variability in all abstraction layers of product families,
i.e. in the features, the architecture and component implementation layers.
Also, a number of tools evolved such as PLUSEE (Gomaa and Shin, 2007)
5
automated product line engineering tool where a multiple view model of the
product line architecture and components are developed and stored in a
product line repository. Feature Mapper (Heidenreich, 2009), an eclipse
plug-in software product lplug-ine tool that provides support for mappplug-ing features from
feature models to subjective modelling artefacts that are expressed by using
an Ecore-based languages such as UML2 and DSLs. DOPLER meta-tool
(Dhungana et al., 2011) (Decision Oriented Product Line Engineering for
Effective Re-use) supports variability modelling that helps define variability of
core assets, such as features, architectural elements or resources.
View Infinity (Stengel et al., 2011), is a Zoomable Interface for
Feature-Oriented Software Development. This tool offers seamless and semantic
zooming from the feature model level to file structure and the source code
level of different abstraction layers of SPL. ISMT4SPLs (Park et al., 2012) is
an Integrated Software Management Tool for Adopting Software Product
Lines that can provide traceability among the artefacts created at domain
engineering and application engineering stages.
BigLever Gears (BigLever), a commercial tool that allows defining arbitrary
reusable software assets and a product feature profile that describes products
in terms of features. Gears can be tailored to different environments with
parameter sets representing different kinds of variability. Pure::Variant
(Levent V, 1998, Beuche, 2008), is a tool that supports variant management
and product configuration based on feature models and has a strong focus on
6
good overview of existing modelling approaches can be found in Czarnecki et
al. (Czarnecki et al., 2012), (Chen et al., 2009) and Sinnema et al. (Sinnema
and Deelstra, 2007).
However, surprisingly, very few of these approaches have actually made it to
industry. These are the BigLever Gears and Pure::Variants, and both of these
tools/companies were university spin-outs based on the work of two PhD
students in America and German respectively. A recent study shown that
71.43% of these approaches have never been evaluated against industrial
settings (Chen and Ali Babar, 2011).
1.2 Problem Statement
Variability models define the commonalities and variability of the product line
from a problem space (e.g., features, decisions, or variation points) and a
solution space (e.g., the reusable assets or variants) perspective along with
the relationships that exist between these two spaces and among the
elements in these spaces. Example of relationships include exclusivity (when
two features cannot exist in one product at the same time); inclusivity (when
the existence of one feature depends on another); and alternatives (when only
one of a number of alternative features can be supported), to name a few.
Variability models tend to be very large in size, in many cases comprising
thousands of features, and complex in nature due to the myriad of
relationships that could exist among the features. This makes the construction
7
Accordingly, one of the major challenges within variability models of
large-scale (industry-size) is the handling and effective visualisation of the models,
which usually encompass a very large number of variation points as well as
the dependency relationships that exist among them (Bashroush, 2010,
Bashroush et al., 2011, Botterweck et al., 2008, Nestor et al., 2007, Pleuss
and Botterweck, 2012, Heuer et al., 2010). Product line developers are facing
problems with dependency management within variability models. An
excessive amount of time and effort is being spent on fixing dependencies to
ensure valid derivation of products (Berger et al., 2013, Sinnema et al., 2006,
Daizhong and Shanhui, 2009).
However, for more than two decades, numerous variability management tools
and techniques have been proposed and introduced from both academia and
the industry. The main goal of all these research works is to help practitioners
in the industry deal with variability management-related complexities (Chen
and Babar, 2010, Sinnema and Deelstra, 2007). In spite of all these significant
efforts, most of these approaches do not scale well when visualizing
large-scale variability models, besides, they offer limited or no mechanism for
managing dependency relationships that exist within the models. These have
raised many concerns regarding the feasibility and scalability of current
variability management tools and techniques.
As such, there has been an increasing demand for focus on making variability
management tools and techniques more scalable to handle the complexity of
8
The key scalability challenges are summarised below:
Challenge 1: Creating and visualising of large scale and complex
product line models (industry size models). Currently, existing
approaches focus on ad hoc software product line variability, and often
do not fully address real life product line variability required by SPL
practitioners.
Challenge 2: Visualising of hundreds of variants and their variation
points in a large scale product line model.
Challenge 3: Defining and visualising of constraints and dependency
relationships (such as variation point to variation point, variant to
variation point, or variant to variant) in a large scale product line model.
Challenge 4: Proper arrangement of constraints and dependency
relationships for better visualisation.
Challenge 5: Effective visualisation of the effect of constraints and
dependency relationships such as (inclusivity, alternativeness, or
multiplicity).
Challenge 6: Clear information to differentiate as to whether a feature
is mandatory, optional, or alternative.
1.3 Research Context
This thesis investigated the reasons behind the lack of scalability in current
variability management tools and techniques. Using a rigorous approach, we
have examined the types of tools developed and the characteristics of these
9
in order to understand the main challenges of the problem. We have also
explored the limitations faced by the current Product Line Management (PLM)
tools and techniques.
The overall goal of this research is to improve the scalability of modelling
variability by employing the idea of separation-of-concerns design principle, in
order to show how the dependency relationships (such as variation point to
variation point, variant to variation point, or variant to variant) of variability
models, can be captured and managed independently from the actual
variability representation.
This thesis introduced a new solution for capturing and managing
dependencies using logic circuit. A separate view is proposed (i.e.,
dependency view), for managing dependencies separately, in order to reduce
the problem of information overloading when viewing and managing
large-scale variability points from one view. Support for this was implemented by
redesigning and creating a new version of a Multitouch Variability Modelling
Solution for Software Product Lines (MUSA) tool suite (a proof-of-concept
variability management tool and framework that was developed within our
research group), that can address these challenges, and thus, lend itself to
industrial large-scale applications. This latest version of MUSA provides better
means to represent, visualise, and manage the variability of large and
complex product line models. This solution has been evaluated using a
10
1.4 Research Aims
One of the challenges with SPLE is the scalability of variability management
techniques. This has limited the adoption of SPLE to specific application
domains. The main reason behind this challenge is attributed to the inability
of current tools and techniques to scale to industry size applications. In this
research, we aim to:
1. Closely examine the current literature to identify the main reasons
behind the current limited scalability of variability management tools
and techniques.
2. Identify the barriers to adoption of current tools and techniques.
3. Based on the findings of 1 and 2, design a tool and framework that
addresses the shortcomings identified.
4. Implement a working prototype of the system.
1.5 Research Questions
The thesis answered the following research questions:
1. What are the key limiting factors affecting the scalability of existing
variability management tools and techniques?
2. What are the barriers to industrial adoption of the current variability
management tools?
11
1.6 Research Methodology
A combination of qualitative and quantitative research methodologies were
used to address the research questions identified above over three parts or
stages of the project.
In the first part, a Systematic Literature Review (SLR) approach was used to
identify gaps in the body of knowledge and answer Q1/Q2. An SLR is a formal
and rigorous way used to carefully examine, evaluate and interpret identified
research evidence based on research questions or a particular research area
(Kitchenham and Charters, 2007). The aim was to systematically review the
reported literature on variability management tools in software product lines
(known as primary studies). The process of SLR involved three main phases
which are:
1) Planning the Review:- which has three stages:
Identifying the need for a review (importance)
Indicating the research question(s)
Developing and evaluating a review protocol
2) Conducting the Review:- which consists of four stages:
Identification of primary studies
Selection of primary studies based on clear criteria
Assessing the quality of primary studies
Data extraction and synthesis
12
Writing and Formatting the main report and
Evaluating / drawing conclusions based on the findings
In the second part, a new version of the MUSA tool suit (Bashroush, 2010)
was built based on the findings of the first two stages in a way that addresses
the identified shortcomings. The tool has been ported to Java technology from
WPF (Windows Presentation Foundation). Among other features that have
been introduced to MUSA is an innovative visualisation technique based on
mind-mapping which is to replace the traditional tree structure for representing
variability models, and the use of logic circuit design to graphically represent
the dependency relationships.
After the completion of the tool’s redesign and the MUSA framework, in the
third part, we have evaluated the tool using multiple case studies, which
ranges from small, medium and large-scale. However, these case studies
were used as a basis to assess the scalability of MUSA as compared to other
tools such as Pure::variants, one of the most popular commercial tools that
we have access to. Among them, the largest sample is a case study for a
Frequency Power Drives product line, and was acquired from Danfoss Power
Electronics. Others include a case for Library Services product line
representing the variability modelling of a wide range of services offered by a
library to provide smooth and effective services to customers.
Further to that, is a case of a house automation system product line that
13
to mention a few. Chapter 8 provides detail description of the case studies
used in the evaluation.
1.7 Summary of Contributions
The main contributions of this thesis are summarized below:
C1 A systematic investigation and understanding of the state of the art
tools that can be utilised in contemporary software product line development:
This study is a contribution to knowledge, as it conducts a systematic review
of Variability Management tools according to the chronological order of
development, and provides a conclusive evaluation of these tools. The results
are intended to assist practitioners in selecting the best available tools, based
on their suitability for a particular industrial task. The analysis also identifies
gaps in the field that should be addressed through further research of product
line tools. Moreover, the analysis identifies gaps in research that should be
addressed in more studies. Based on these results, we have collected the
data and necessary requirements for the development of our new MUSA tool.
C2 Redesign of MUSA framework to improve the scalability of visualizing
and representing variability models: Although scalability was the main
motivation for developing the early version of MUSA, redesigning and
enhancing its capability to add more innovative visualisation techniques will
increase productivity, time-to-market and allow for the creation and
management of larger and more complex product families; hence, improving
14
C3 An additional view for capturing and managing dependency
relationships that exist within the model separately: Using principle of
separation-of-concerns, we have proposed a separate view called,
“dependency view” to capture and manage dependency interaction
independently from the actual representation of the models. This was
achieved using a logic circuit. The main idea is to reduce the complexities,
such as graphical overloading, when viewing and managing dependencies of
large variability points all from one view.
C4 A complete working prototype system will be implemented as a new
MUSA: Support for managing dependency relationships among variability
models has been implemented by redesigning and extending the current
version of the MUSA tool suite (a proof-of-concept variability management
tool and framework). This will allow the creation and management of larger
and more complex product families.
C5 The new version of MUSA will be available as a multi-platform
application: To make it more generic and maximise its functionality, the new
version of MUSA has been ported from Windows Presentation
Foundation-WPF to Java technology. This has solved the main problem of platform
dependency suffered by the existing version of MUSA.
C6 A benchmark for evaluating our approach: In order to evaluate the
MUSA tool in comparison with other tools, we developed a benchmark for
evaluating the quality attributes, important for practical use of SPL
15
benchmark focused on measuring the four quality attributes: Usability,
Performance, Scalability, and Integration. In addition, an evaluation study was
conducted experimentally, and involved 10 feature-modelling tools. In order to
know and get an insight on how well, and to what extent these tools satisfy
these quality attributes, four case studies of different sizes were used as the
basis for the experiment.
C7 Literature review process (Chapter 2): This process contributes to
knowledge by providing empirical step-by-step guidelines to identify, collect,
and review papers with: 1) a scope of the review clearly identified in advance;
2) a comprehensive search conducted to find all relevant studies; 3) the use
of explicit criteria to include or exclude studies; 4) the establishment of
standards to critically appraise study quality; and 5) the provision of explicit
methods for extracting and synthesizing study findings. This process will
benefit both new and experienced researchers by helping them avoid what is
regarded as author’s bias in research, while also providing a reliable basis for
making decisions.
C8 Benchmarking process: The results of this will contribute to knowledge,
as it will assist both practitioners and researchers alike by providing a
standard and empirical approach to evaluating product line tools in the future.
It also helps to identify and recommend areas that require attention in future
tool design.
C9 The Context of Research: The distribution of the research context
16
the gaps between research in academia and industry through collaborative
efforts. The figure shows that most studies (68%) have been conducted in an
academic context, whereas only 16% of the studies are joint industrial
academic endeavours. In 16% of the studies, no information was provided on
the research context. Table 4.11 presents the list of all the studies with their
research context. Please refer to Chapter 4 for details on this contribution.
1.8 Thesis Structure
This thesis is structured in three parts and nine chapters.
1.8.1 Part I: State of The Art
Chapter 2 is organised in two main sections. We present and discuss
the research methodology used to collect data in the first part. This
includes the study’s research questions, search protocol, inclusion and
exclusion criteria, quality criteria, and the data extraction and synthesis
process. Section 2 provides an overall meta-analyses of the primary
studies identifying trends and developments in the field.
Chapter 3 introduces tools’ supporting variability management, and
discusses their usable functionality, i.e., the approach it uses in tackling
variability issue— the environment, or a platform and technology,
based on which a tool was developed and implemented, respectively. It
also identifies the notations type (graphical, textual, or a combination of
both), employed by a tool, and the category to which a tool belonged
to; whether, commercial, academic, or both. The chapter also assesses
17
Chapter 4 is a thorough analysis of the state-of-the-art technology in
the field, essentially for tools supporting variability management, to
understand the tools’ characteristics, maturity, and the challenges it
might be exposed to, in the field. Consequently, two parts were formed
during the analysis: in the first part, different tools were identified and
assigned with a unique ID, then their analysis was carried out, based
on certain key topics that were recognised as follows: development
environment; support for transformations (between different formats);
management of constraints and reasoning on variability models, and;
their proposed graphical and textual notations. In the second part, an
analysis was made, based on the quality of the research conducted in
the reported approaches, as well as the research context of the studies
as they have been conducted.
1.8.2 Part II: Early Version of Musa Framework versus New Version
Chapter 5 presents the early version of MUSA (A Multitouch Variability
Modelling Solution for Software Product Lines) tool and its theoretical
foundation, upon which it was designed and developed. MUSA was
implemented as a proof-of-concept over the state-of-the-art Human
Computer Interaction (HCI), the Microsoft Surface and Windows 7
Multitouch platform.
Chapter 6 Introduces the new version of MUSA (i.e., version 2) tool,
and a framework that exhibits a number of features (multi-platform
18
etc.), for dealing with large-scale software product line models. This
version adopts the separation-of-concerns design principles and
provides multiple perspectives to the model, each of which conveys a
different set of information.
1.8.3 Part III: Validation
Chapter 7 presents a benchmark that focuses on two major aspects:
measuring the four quality attributes (usability, scalability, performance,
and integration), identified as important for practical use of SPL, and
the use of this benchmark as a basis to assess the scalability of our
(MUSA) approach, as compared to other variability management tools.
Chapter 8 describes the four case studies of varying sizes and data
elements that are used in the experimentation. Also, the results of the
experimental evaluation are presented.
1.8.4 Part IV: Conclusion and Future Research Work
Chapter 9 summarises and concludes this thesis and describes the
further work that could be conducted to improve the framework and tool
19
1.9 Bibliographical Notes
Some of the material presented in this thesis reuses and extends publications
of the author in the following papers:
Conference
1. Garba, M., Noureddine, A. and Bashroush, R. (2016) 'MUSA: A Scalable Multi-Touch and Multi-Perspective Variability Management Tool'. 13th Working IEEE/IFIP Conference on Software Architecture (WICSA), Venice, Italy: IEEE Computer Society. (Chapter 6)
Under Review
2. Garba, M., Bashroush, R., Rabiser, R., Groher, I. and Botterweck, G. (2015) 'CASE Tool Support for Variability Management in Software Product Lines', ACM Computing Survey. (Chapter 2, 4)
Chapter 2
Literature Review Methodology
2.1 Introduction
Now that we have introduced the main context of the thesis, it is time to put
these concepts into play. Earlier in this work, we have studied all the
published literature on Computer-Aided Software Engineering (CASE) tool
support for variability management over the last two decades, using a
systematic literature review as inspired by (Kitchenham and Charters, 2007).
The objective was to understand what tools have been produced, the
characteristics of these tools, their context, and the challenges and limitations
they faced.
This chapter presents and explains in its first part, the research method used
to collect and review papers, as well as the trend of analysis from the results
of the extracted data. The second section provides overall meta-analyses of
the primary studies, identifying trends and developments in the field.
The results of the study will: i) give practitioners access to a catalogue of
published tools and guide them in selecting the best tool for a given task
enhancing the accessibility of the published tools; ii) provide researchers in
the field with the main challenges and limitations that require further
22
the state-of-the-art in tool support for variability management in SPL
engineering.
2.2 Research Method
To achieve the objectives of this study, a SLR approach was adopted to
conduct the survey. An SLR, as stated in section 1.5 of chapter one is a
rigorous method for examining, evaluating, and interpreting all available
research evidence based on research question(s) or particular research
topic(s) (Kitchenham and Charters, 2007).
The study examines current literature on variability management tools in
SPLE engineering (known as primary studies) published over the last two
decades. Throughout the research study, the guidelines for SLRs were
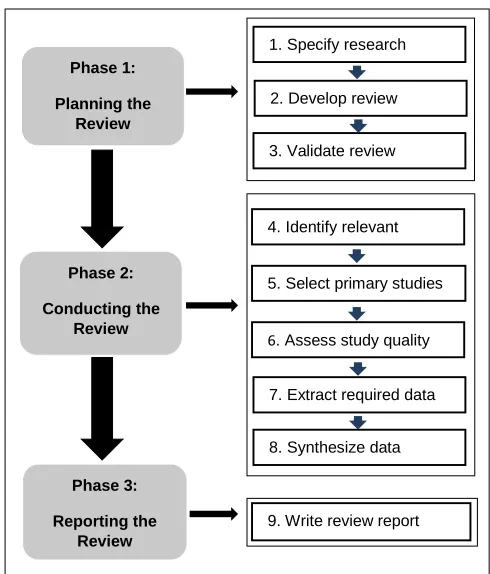
followed as provided in (Kitchenham and Charters, 2007). This involves three
main phases: (1) Planning the review; (2) Conducting the review, and; (3)
Reporting the review. Figure 2.1 depicts the stages of SLRs, adapted from
23
Figure 2.1: Systematic literature review process
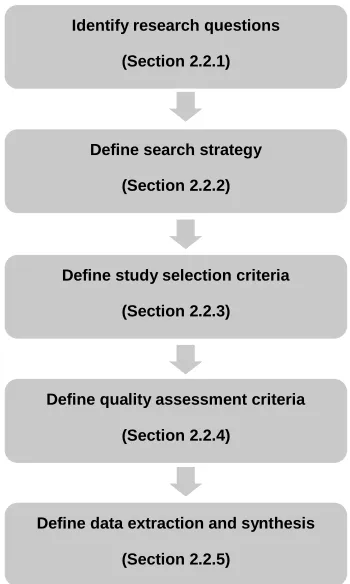
An important element in SLRs is the development of a review protocol (Figure
2.2). This protocol specifies the background and procedures to be used by
researchers to ensure rigor while conducting the review and reduces the
possibility of researchers’ bias throughout the review process.
The systematic review protocol begins by defining research questions to be
answered followed by the search strategy to be followed to identify the
primary studies (described in Sections 2.2.1 and 2.2.2). Then, the study
selection criteria for determining which studies should be included or excluded
from the surveyed literature is defined (Section 2.2.3). Then, quality
assessment criteria are defined. These are used to assess the quality of the 4. Identify relevant
research
5. Select primary studies
6. Assess study quality 7. Extract required data
8. Synthesize data 1. Specify research
questions
2. Develop review
protocol
3. Validate review
protocol
9. Write review report Phase 1:
Planning the Review
Phase 2:
Conducting the Review
Phase 3:
24
primary studies (Section 2.2.4). Finally, procedures for extracting and
[image:35.595.197.372.136.428.2]synthesizing data reported from primary studies are defined (Section 2.2.5).
Figure 2.2: SLR review protocol process
2.2.1 Research Questions
In order to achieve the research aim and objectives of this study, we defined
the following 5 research questions.
RQ1: What tools have been developed to manage variability in software product lines?
RQ2: What are the characteristics of these tools?
RQ3: What is the quality of the research conducted in the reported approaches?
RQ4: What is the context of research?
Identify research questions
(Section 2.2.1)
Define search strategy
(Section 2.2.2)
Define study selection criteria
(Section 2.2.3)
Define quality assessment criteria
(Section 2.2.4)
Define data extraction and synthesis
25
RQ5: What are the main challenges faced by current Product Line
Management (PLM) tools?
2.2.2 Search Strategy
Following Kitchenham’s guidelines (Kitchenham and Charters, 2007), we
constructed a search string to help us identify the relevant primary studies to
answer our 5 research questions.
The guidelines followed were as follows:
- Derive main terms from the topic being researched and research
questions;
- Determine and include synonyms, related terms and alternative
spellings for major terms;
- Check the keywords in all relevant papers researchers already knew
and those returned by initial searches on relevant databases;
- Include other relevant terms that increase the possibility of identifying
further related material;
Use logical operators such as "OR" and "AND" to link alternative spellings and
to join the synonym words or phrases to create one search string.
After constructing various search strings based on the guidelines above and
performing a series of test searches in diverse digital libraries and analysing
26
<<Variability AND (Product Line* OR Software Product Lines OR Software Product Family OR Software Product Families OR Product Family OR Product Families* OR Systems Family OR Family of Systems) AND (Variability OR Variability Management OR Variant OR Variation Point OR Feature Model OR Feature Modelling or Feature Modelling) AND (Tool OR Tools OR Approach, Approaches, Method* OR Methods)>>
Although it was not possible to apply only one search string for all the
electronic data sources, when varying the string for different sources we
ensured that if the syntactic nature of the strings were not the same, they
were all comparable semantically.
We also performed manual searches on different sources where SPL
researchers were known to publish their findings, this included conferences
and workshops. We searched for papers published between 1990 (i.e., when
the first Feature-Oriented Domain Analysis [FODA] technical report was
published (Kang et al., 1990)) up until February 2014 inclusive (when the
search stage of this study was completed). Although only data reported in
peer-reviewed published material was used in the analyses, we also
attempted to acquire the identified tools. Where the tools weren’t available for
download or use online, the respective authors were contacted.
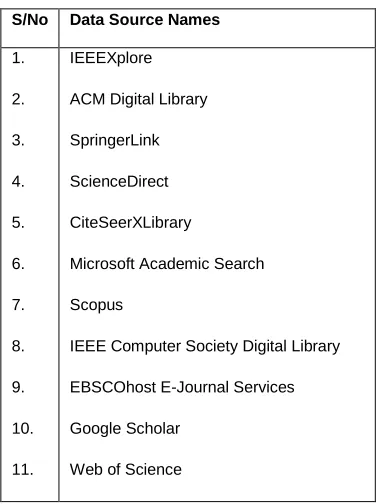
Our search covered 11 digital data sources as shown in Table 2.1. The
manual search covered the proceedings of the following conferences and
workshops:
27
- VaMoS (Workshop on Variability Modelling of Software Intensive
Systems)
- VisPLE (International Workshop on Visualisation in Software Product
Line Engineering)
- WICSA (Working International Conference on Software Architecture)
[image:38.595.204.394.269.521.2]- EWSA (European Workshop on Software Architecture)
Table 2.1: Electronic databases used for searching for primary studies S/No Data Source Names
1.
2.
3.
4.
5.
6.
7.
8.
9.
10.
11.
IEEEXplore
ACM Digital Library
SpringerLink
ScienceDirect
CiteSeerXLibrary
Microsoft Academic Search
Scopus
IEEE Computer Society Digital Library
EBSCOhost E-Journal Services
Google Scholar
Web of Science
Finally, forward and backward reference checking (“snowballing”) was
conducted on the identified primary studies. Search engines were used to find
citations of the primary studies identified that could be of relevance to the
review (forward reference checking). The reference lists of the primary studies
were then checked for any potential relevant studies missed (backward
28 2.2.3 Study Selection Criteria
This section explains the study selection process and lists the inclusion and
exclusion criteria.
Inclusion Criteria (IC):
IC1: The primary study is a peer-reviewed, scientific paper rather than
a PowerPoint presentation or a short/extended abstract paper.
IC2: The primary study discusses a variability management tool.
IC3: When several reports of the same study existed in different
sources, the most complete and recent version of the study was
included in the review.
IC4: The paper was written in English.
Exclusion Criteria (EC):
EC1: The primary study does not address variability management
tools.
EC2: The papers were published before January 1991 and after
February 2014.
EC3: It is a short paper, PowerPoint file, poster presentation or
consists of lecture notes.
EC4: The primary study consists of a compilation of work, for instance,
from a conference or workshop.
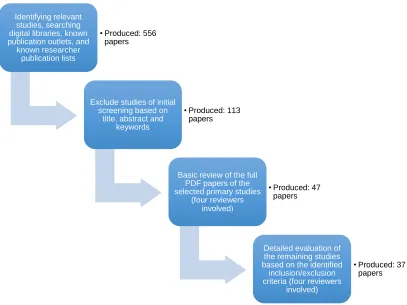
We found a total of 556 papers from different initial searches covering
29
After the initial screening of paper abstracts, in which papers
addressing non-SPL related topics were excluded by one researcher,
113 publications were selected. The full papers were then acquired and
four independent researchers reviewed the studies. 47 publications
were then selected through voting and discussions among the four
researchers in a first step. Finally, and after another round carefully
considering the inclusion and exclusion criteria, again through voting
and discussions in case of disagreements, 37 studies were selected.
[image:40.595.106.513.347.652.2]Figure 2.3 below show a summary of the study selection process.
Figure 2.3: Study selection process
Finally, thirty-seven primary studies were analysed (see Table 2.3). Identifying relevant
studies, searching digital libraries, known publication outlets, and known researcher
publication lists
• Produced: 556 papers
Exclude studies of initial screening based on
title, abstract and keywords
• Produced: 113 papers
Basic review of the full PDF papers of the selected primary studies
(four reviewers involved)
• Produced: 47 papers
Detailed evaluation of the remaining studies based on the identified
inclusion/exclusion criteria (four reviewers
involved)
30 2.2.4 Quality Assessment Criteria
The quality of the reported research in the selected 37 papers was assessed
based on the eight-quality assessment questions listed in Table 2.2 below.
These were based on the quality assessment strategy defined in (Kitchenham
and Charters, 2007). The studies were assessed using a ternary scale where
each question was given a score of 1 (for Yes), 0.5 (for Perhaps) and 0 (for
No). This system allowed us some flexibility when answering some of the
questions that were difficult to judge as Yes or No from the information
provided in the primary study. Once scores were allocated to questions, an
aggregate mark was then given to each study. This data was also used to
answer RQ3 (discussed in chapter 4).
Table 2.2: Quality assessment criteria Questions
QA.Q1 Is there a rationale for why the study was undertaken?
QA.Q2 Is there a description of the context (e.g., industry, laboratory setting, products used, etc.) in which the research was carried out?
QA.Q3 Did the paper present enough details about the variability management tool to enable us conduct the required analysis?
QA.Q4 Did the paper present an evaluation of the tool? If yes, did it include feedback from end users?
QA.Q5 Are the substantive claims in the paper supported by reliable evidence?
QA.Q6 Do the authors compare and evaluate their own results against related work?
QA.Q7 Do the authors discuss the credibility of their findings?
QA.Q8 Are limitations of the study discussed explicitly?
2.2.5 Data Extraction and Synthesis
Following the selection process, the 37 primary studies identified are shown in
31
Table 2.3: Studies included in the final review Study
ID
Paper Title Year of
Publication
Author(s) Reference
[S1] DARE-COTS A Domain Analysis Support Tool
1997 Frakes, W., Priet-Diaz, R., and Fox, C.
(Frakes et al., 1997)
[S2] Intelligent Design of Product Lines in Holmes
2001 Succi, G., et al. (Succi et al., 2001)
[S3] Scaling Step-Wise Refinement 2004 Batory, D., et al. (Batory et al., 2004)
[S4] XVCL: a mechanism for handling variants in software product lines
2004 Zhang, H. and Jarzabek, S.
(Zhang and Jarzabek,
2004)
[S5] Tool Support for Software Variability Management and Product Derivation in Software Product Lines
2004 Gomaa, H. and Shin, M., E.
(Gomaa and Shin, 2004b)
[S6] XML-Based Feature Modelling 2004 Cechticky, V., et al. (Cechticky et al., 2004)
[S7] On the Implementation of a Tool for Feature Modelling with a Base Model Twist
2006 Shakari, P. and Møller-Pedersen, B.
(Shakari and Møller-Pedersen,
2006)
[S8] COVAMOF: A Framework for Modelling Variability in Software Product Families
2004 Sinnema, M., et al. (Sinnema et al., 2004)
[S9] Towards Systematic Ensuring Well-Formedness of Software Product Lines
2009 Heidenreich, F. (Heidenreich, 2009)
[S10] Odyssey: A Reuse Environment based on Domain Models
1999 Braga, R., M., M., Werner, C., M., L., and Mattoso, M.
(Braga et al., 1999)
[S11] A NUI Based Multiple Perspective Variability Modelling CASE Tool
2010 Bashroush, R. (Bashroush, 2010)
[S12] The DOPLER meta-tool for decision-oriented variability modelling: a multiple case study
2011 Dhungana, D., Grünbacher, P., and Rabiser, R.
(Dhungana et al., 2011)
[S13] XToF – A Tool for Tag-based Product Line Implementation
2010 Gauthier, C., et al. (Gauthier et al., 2010)
[S14] View Infinity: A Zoomable Interface for Feature-Oriented Software Development
2011 Stengel, M., et al. (Stengel et al., 2011)
[S15] FeatureIDE: An Extensible Framework for Feature-Oriented Software Development
2014 Thüm, T., et al. (Thüm et al., 2014)
[S16] FeaturePlugin: Feature Modelling Plug-In for Eclipse
2004 Antkiewicz, M. and Czarnecki, K.
(Antkiewicz and Czarnecki,
32 [S17] An Integrated Software Management
Tool for Adopting Software Product Lines
2012 Park, K., et al. (Park et al., 2012)
[S18] Kumbang Configurator – A Configuration Tool for Software Product Families
2005 Myllärniemi, V., et al. (Myllärniemi et al., 2005)
[S19] Towards a Model-Driven Product Line for Web systems
2009 Martinez, J., et al. (Martinez et al., 2009)
[S20] PuLSE-BEAT – A Decision Support Tool for Scoping Product Lines
2000 Schmid, K. and Schank, M.
(Schmid and Schank,
2000)
[S21] Moskitt4SPL: Tool Support for Developing Self-Adaptive Systems
2012 Gómez, M., et al. (Gómez et al., 2012)
[S22] BeTTy: Benchmarking and Testing on the Automated Analysis of Feature Models
2012 Segura, S., et al. (Segura et al., 2012)
[S23] An Analysis of Variability Modelling and Management Tools for Product Line Development
2007 Capilla, R., et al. (Capilla et al., 2007)
[S24] Visualisation of variability and configuration options
2012 Pleuss, A. and Botterweck, G.
(Pleuss and Botterweck,
2012)
[S25] ASADAL: A Tool System for Co-Development of Software and Test Environment based on Product Line Engineering
2006 Kim, K., et al. (Kim et al., 2006)
[S26] RequiLine: A Requirements Engineering Tool for Software Product Lines
2003 von der Maßen, T. and Lichter, H.
(von der Maßen and
Lichter, 2004)
[S27] ToolDAy: A Tool for Domain Analysis 2011 Lisboa, L., B., et al. (Lisboa et al., 2011)
[S28] The Linux Kernel Configurator as a Feature Modelling Tool
2008 Sincero, J. and Schröder-Preikschat, W.
(Sincero and Schroder-Preikschat,
2008)
[S29] Automating Product-Line Variant Selection for Mobile Devices
2007 White, J., et al. (White et al., 2007)
[S30] Managing Feature Models with FAMILIAR: a Demonstration of the Language and its Tool Support
2011 Acher, M., et al. (Acher et al., 2011)
[S31] Easy-Producer – Product Line Development for Variant-Rich Ecosystems
33 [S32] OPTI-SELECT: an interactive tool for
user-in-the-loop feature selection in software product lines
2014 El Yamany, A. E.
Shaheen, M. and Sayyad, A.
(Yamany et al., 2014)
[S33] MPLM - MaTeLo product line manager: [relating variability modelling and model-based testing]
2014 Samih, H. and Bogusch, R.
(Samih and Bogusch,
2014)
[S34] Variability code analysis using the VITAL tool
2014 Zhang, B. and Becker, M. (Zhang and Becker,
2014)
[S35] ViViD: a variability-based tool for synthesizing video sequences
2014 Acher, M., et al. (Acher et al., 2014)
[S36] VMC: recent advances and challenges ahead
2014 Ter Beek, M. H. and Mazzanti, F.
(Ter Beek and Mazzanti,
2014)
[S37] WebFML: synthesizing feature models everywhere
2014 Bécan, G., et al. (Bécan et al., 2014)
Beside the 37 primary studies included in the study, we identified further 13
tools that did not meet the inclusion/exclusion requirements. These are shown
in Table 2.4 below, along with the criteria they didn’t meet.
Table 2.4: Studies excluded in the final review Reasons
for Exclusion
Paper Title Year of
Publication
Author(s) Reference
EC3 FAMA Framework 2008 Trinidad, P., Benavides,
D., Ruiz-Cort´es, A., Segura, S., Jimenez, A.
(Trinidad et al., 2008)
EC1 Development of a Feature Modelling Tool using Microsoft DSL Tools
2009 Fernández, R., Laguna, M. A., Requejo, ,J., Serrano, N.
(Fernández et al., 2009)
EC3 S.P.L.O.T. - Software Product Lines Online Tools
2009 Mendonca, M., (Mendonca et al., 2009)
EC3 V-Manage 2002 European Software
Institute (ESI)
(SAP
Configurator)
EC2 PACOGEN : Automatic Generation of Pairwise Test Configurations from Feature Models
2011 Hervieu, A., Baudry B., Gotlieb, A.
34 EC1 Variability Modelling in the Real: A
Perspective from the Operating Systems Domain
2010 Berger, T., She, S., Lotufo, R., Wasowski, A., Czarnecki, K.
(Berger et al., 2010)
EC1 MetaProgramming Text Processor Campbell, G. (Campbell)
EC1 An Algorithm for Generating t-wise Covering Arrays from Large Feature Models
2012 Johansen, F., M., Haugen, Ø., Fleurey, F.
(Johansen et al., 2012)
EC2&EC3 Varmod-Tool-Environment 2005 Pohl, K., Böckle, G., van der Linden, F.
(Klaus et al., 2005)
EC3 Linux Variability Analysis Tools (LVAT) She, S. (She)
EC2 VARMA--VARiability Modelling and Analysis Tool
2012 Russell, G., Burns, F., Yakovlev, A.
(Russell et al., 2012)
EC3 ZIPC SPLM 2009 NTTDaTa MSE
Corporation
(Gauthier et al., 2010)
EC3 Hydra Tool 2009 Jose R. Salazar (Modeling)
Upon the completion of the primary study selection phase, and the primary
study quality assessment step, data extraction commenced. In order to
answer the research questions, the following data was extracted from every
primary study (see Table 2.5). The data extraction form below also shows the
relevance of each of the extracted data
elements to the study research questions.
Table 2.5: Data extraction form
Data Field Related
Concern/Research Question
DE.Q1 Paper title Documentation
DE.Q2 Year of publication Documentation
DE.Q3 Type of publication (e.g. Journal, Conference, Workshop, etc.) Reliability of Review
DE.Q4 Publication outlet (conference name, etc.) Reliability of Review
35
DE.Q6 The research rationale, challenges or problems as reported in the paper RQ3, RQ5
DE.Q7 Research Context (e.g. industry, academic, product, etc.) RQ4
DE.Q8 Tool Performance and Stability RQ2, RQ5
DE.Q9 Visualisation technique RQ2
DE.Q10 Textual notation RQ2
DE.Q11 Usability RQ2
DE.Q12 Tool environment/Platform RQ2
DE.Q13 Integration (e.g. with DOORS, etc.) RQ2
DE.Q14 Scalability (ability to deal with large-scale models) RQ2
DE.Q15 Relevance (Research or Practice) RQ4
DE.Q16 The research limitations as reported in the paper RQ5
2.3 Data Extraction Results
The next step after the data extraction step was the data synthesis and
analysis step. In this section, we provide meta-analyses of the primary studies
relating to their publication types, venues, trends and overall characteristics.
We analyse the collected data to address the 5 main research questions of
the study.
Based on the data collected, the research question one (RQ1) is then
addressed in details in chapter 3. In chapter 4, the remaining four questions
(RQ2, RQ3, RQ4, and RQ5) were then answered. In addition, the chapter 3
also discusses additional findings on commercial tools and tool adoption in
industry. Chapter 4 discusses the study limitations and threats to validity. And
36 2.3.1 Trend Analysis
The first search of the systematic literature review resulted in 556 papers. The
application of inclusion/exclusion criteria in several iterations resulted in 37
papers for the final review.
The primary studies included 18 conference papers, 6 journal papers, and 13
workshop papers. Figure 2.4 presents a pie chart showing the percentage for
each publication outlet. From the chart, it can be seen that conferences are
more prominent venues for research on variability management tools followed
by workshops, whereas journals seem to be less attractive outlets for
research on tools. The 37 papers are scattered over 24 different venues (see
Table 2.3). This distribution further highlights the importance of this systematic
review as a manual search of well-known conferences or journals could not
possibly identify all the relevant literature.
Figure 2.5 shows the distribution of studies over time; combined in 5-year
intervals (to avoid influence of events occurring every 18 or 24 months). The
chart shows that there has been considerable surge in new tools over the past
5 years. Our search did not identify any relevant paper published before 1997.
The figure shows that there was a peak in publishing research on variability
management tools from 2011 to 2015. There was a gradual uprising from
1996 to 2000, then a steady uptrend from 2001 to 2005 and 2006 to 2010.
The shape of the curve (spike, followed by trough, then slow pickup) aligns
nicely with Gartner’s technology maturity Hype Cycle model (Linden and
37
Hype Cycle (Figure 2.6), it can be deduced that variability management tools
have now entered the slope of enlightenment/plateau of productivity stage.
This indicates that the benefits of variability management tools to the
enterprise are starting to become widely understood, while conservative
companies remain cautious.
Figure 2.4: Percentage of each publication type
Figure 2.5: Distribution of primary studies over time
Journal 16%
Conference 49% Workshop
35%
Publication Outlets
0 2 4 6 8 10 12 14 16 18
38
Figure 2.6: Gartner Hype Cycle reproduced based on (Linden and Fenn, 2003)
Technology
trigger
Peak of inflated expectations
Trough of disillusionment
Slope of enlightenment
Plateau of productivity
Maturity
Vis
ib
il
ity
Each Hype Cycle drills down into the five key phases of a technology’s life cycle.
Technology Trigger: A potential technology breakthrough kicks things off. Early proof-of-concept stories and media interest trigger significant publicity. Often no usable products exist and commercial viability is unproven.
Peak of Inflated Expectations: Early publicity produces a number of success stories—often accompanied by scores of failures. Some companies take action; many do not.
Trough of Disillusionment: Interest wanes as experiments and implementations fail to deliver. Producers of the technology shake out or fail. Investments continue only if the surviving providers improve their products to the satisfaction of early adopters.
Slope of Enlightenment: More instances of how the technology can benefit the enterprise start to crystallize and become more widely understood. Second- and third-generation products appear from technology providers. More enterprises fund pilots; conservative companies remain cautious.