2016 International Conference on Artificial Intelligence and Computer Science (AICS 2016) ISBN: 978-1-60595-411-0
Object Detection Based on SIFT and Clustering Algorithm
Yuan ZHOU
1, Zhi-yan CUI
1,*, Tao WANG
1and Xin-yu YANG
11Xi’an Jiaotong University, P.R. China
Keywords: SIFT, Clustering, Object detection.
Abstract. Detecting objects from complex scenes is a classic problem in computer vision. It is the basis of object recognition and image understanding. In this paper, we propose an object detection algorithm based on SIFT feature and clustering algorithm. We first extract feature points from the template and the target image. Then, after three times of clustering and filtering, the rotation, scaling and translation of the object from the template image to the target image are estimated. Finally, using the transformation matrix, we can obtain the position of the object in the target image. Our experiment result proved that the proposed algorithm outperforms RANSAC in effectiveness and stability. Our method also avoids manually setting of thresholds that is required in the RANSAC method.
Introduction
Object detection solves the problem of locating objects in an image. The outcome of an object detection system is usually a bounding box that indicate the location and the approximate outline of the object [1]. Object detection is the basis of object tracking, image segmentation and understanding. It is widely applied in the fields such as video surveillance, face recognition [2], and information retrieval [3,4].
Traditional object detection method uses SIFT to extract feature points and the RANSAC algorithm to match the points and estimate the transformation matrix [5]. But this method has disadvantages such as running time uncertainty and requiring manual setting of some parameters. To overcome these disadvantages, we use clustering algorithm instead of RANSAC. Our method guarantees a stable running time, provide higher accuracy results, and avoid manual setting of thresholds.
Next, we first introduce the related work of object detection, then explain our method, and finally shows the experiment results and the evaluation of our method.
Related Work
gets the best results for scaling and rotation changes comparing with PCA-SIFT and SURF. We choose SIFT for feature extraction in our method.
Many methods are proposed for matching two sets of feature points. Philbin et al. [12] uses geometric test method. Zhou et al. [13] uses the spatial position relation between the feature points. M-estimators proposed by Jiun-Hung et al. [14] and RANSAC (Random Sample Consensus) proposed by Fischler et al. [15] can also be used to do the matching. RANSAC is a method that first use a set of data to calculate the initial mathematical model, and then iteratively update the model until converge. By using the RANSAC method, we can get the transformation matrix from one image to another. Because the initial inlier points are randomly selected, the RANSAC algorithm only guarantee a reasonable result when the iteration time is large enough. Although the RANSAC algorithm is very popular, its computation time is uncertain because the computation time grows exponentially when the initial parameters increases.
RANSAC and SIFT algorithms are often used together for object detection. First, the feature points are extracted. Then the feature points are matched between the two images by using RANSAC. In this paper, we use clustering method instead of RANSAC to achieve the final match. Our method outperforms the RANSAC in results accuracy. Additionally, the running time of our algorithm is stable.
Our Method
In this section we introduce our method. Firstly, we extract the feature points from both the template image and the target image, and initially match the feature points between the two images. Secondly, the matching of feature points was filtered by three times of clustering. Thirdly, use the final matched feature points, we compute the transformation matrix to get the final result.
Calculation and Initial Matching of Feature Points
First, the classic SIFT algorithm is used to extract feature points. To match the feature points of the template image and that of the target image, for each feature point in the template image, we compare it to all points in the target image. More specifically, Euclidean distance is used to measure the distance between the SIFT features of the point pairs. We validate the match by computing the ratio between the nearest distance and the second nearest distance [8]. If the ratio is larger than threshold 0.8, the match is unlikely to be a correct match so we ignore the match. According to [8], this method can eliminate 90% of the error matching when 5% of the correct match is abandoned.
Filtering of Matching Points Based on Clustering
We assume that the objects are under the transformations including translation, rotation and scaling. By estimating the parameters of these three transformations, we can find the location of the object in the target image. In the above chapter, we have computed feature points in both images and found the corresponding point pairs. Theoretically, if the matching between feature points are perfect, we can compute the transformation matrix by any two matching pairs.
For convenience, we denote the template and target image as A and B respectively.
(1)Rotation: Let’s assume that there are n1pair of initial matching points are computed by SIFT which is represented by( , )0 0
i i
a b , i1, 2,3n1. We define the direction of each points as the SIFT dominant direction. Then the rotation angle between the directions of feature points bi and ai can be
computed by:
0 0
( ) ( ).
i i i
angle angle b angle a (1)
By calculating the rotation angle between all pairs of matching points, a sequence of anglei is
obtained. Then we use K-means cluster algorithm to divide the angles into three categories. The category containing the most points is the dominant category and it represents the rotation of the object. We keep the matching points in the dominant category and delete others. Assuming n2 (n2 n1) matching points are left, we can get remaining matching points
1 1
( , )a bi i i1, 2,3n2 .
(2) Scaling: Though there is scale in a SIFT points, we don’t use this method because it is not precise to use this scale to cluster. Assuming two points ( , )a ai j in A correspond to two points ( , )b bi j in B
(ai matches to bi and aj matches to bj). Then the scaling of the object from A to B can be
estimated by the ratio between the length of the ( , )a ai j and ( , )b bi j :
1 1 1 1
( , ) / ( , ).
m i j i j
scale dis b b dis a a (2)
2 2 1, 2,3 ( ( 1)) / 2
m n n . Distances between all pairs of points in A is calculated, and so as B. Then we can compute a sequence of scaling parameterscalem. Again the K-means clustering is used
to divided it into three categories, and the dominant category containing the most points can be got. The matching points corresponding to the dominant category will be retained, and the others are removed. After the second filter of the matching points, we get sequences ( , )2 2
i i
a b ,
3 1, 2,3
i n (n3n2).
To reduce the computation complexity, we can randomly sample point pairs within each image instead of considering all pairs. According to our experiment results, when the sampling number is set to3(n21), the results become stable. So we set sample number to3(n21)in our experiments. (3) Translation: Denoting the mean of the dominant rotation parameter category as
, and the mean of the dominant scaling parameter category as scale, we can compute the coordinates of rotated and scaled feature points by:' ' 0 cos sin
( , ) ( , ) .
0 sin cos
i i i i
scale
x y x y
scale (3)
Then the translation vector of the matching pair can be computed by:
' ' ( , ) ( , )
i i i i i
trans v w x y (4)
Where ( , )v wi i is the coordinate of the matching point in target image B.
We apply K-means clustering again to the translation list and find the dominant category. After removing the points which are not in this category, we can get the final matching sequence( , )3 3
i i
a b
4 4 3
1, 2,3 ( )
i n n n .
After the above three steps of filtering, we remove the matching points which are likely to be wrong. Then we use the sequence ( , )3 3
i i
so the order can be reversed. The translation is determined by scaling and rotation, so it is necessary to solve the translation in the final step. For each step, we first calculate the corresponding transformation, and use the mean as the final estimated transformation.
Experiments and Evaluation
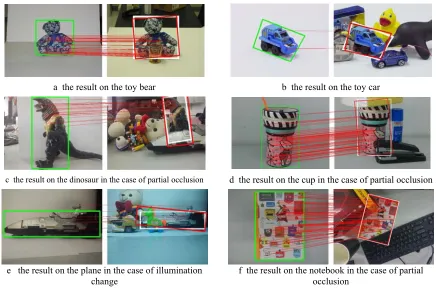
Here we use our method to detect various objects under different illumination or occlusion conditions. For convenience, we show the template image on the left with the green square showing the object position made by manual annotation, and the target image on the right, in which the white box shows the object position, and the red square shows the estimated position. The red lines between two images show the matching between feature points. All our experiments are done with the following computer configuration: Intel(R) Core(TM) i3-3210 CPU 3.2GHz, 4GB, Visual Studio2010.
a the result on the toy bear b the result on the toy car
c the result on the dinosaur in the case of partial occlusion d the result on the cup in the case of partial occlusion
e the result on the plane in the case of illumination change
[image:4.612.83.519.256.549.2]f the result on the notebook in the case of partial occlusion
Figure 1. Experimental results on indoors objects.
Experiments on indoor images
Here we show the results of our method on indoor images containing small objects, such as toys, notebooks, etc.
We can see from the Fig. 1 that no matter how was the objects transformed our method can detect the object in the target image correctly. It also works well when occlusion happens, even when more than half of the object area is occluded by other objects.
Experiment on Oxford Database
We also test our method on the affine transformation database from University of Oxford [16]. Experimental results are shown in Fig. 2.
Comparison and Evaluation
We use 8 pairs of images for the experiments in this section, including the car image in Fig. 2, and the dinosaur, toy car, notebook, cup and bear example shown in Fig. 1 and additionally an instant coffee bag example and the transformed classic Luna image.
a the results about the ship b the results about the ship
c the results about trees with a little noise d the results about trees with more noise
e the results about the car in the case of illumination
[image:5.612.98.521.128.398.2]change f the results about the car in the case of illumination change
Figure 2. Experimental results on affine transformation database from University of Oxford.
F1-Measure [17] is used to evaluate the detection results. To compute F1 value, we first need to compute the precision P and recall R of our result. We can get the area of the red box (R1), area of the white box (R2), and the area of the intersection part of these two regions (R3). Then the precision P can be computed by R3/R1, and the recall R can be computed by R3/R2. The F1 value equals (2P R ) / (PR). The range of F1 value is [0, 1], where 1 mean a better result.
To compare the precision of our method with RANSAC algorithm, we repeat each experiment 5 times and compute the mean of the F1 values. The mean F1 value of RANSAC method is 0.890, and the value for our method is 0.943. So our method can get a better result compares with RANSAC.
To compare the running times between our method and RANSAC, the experiments above were repeated 20 times. The standard deviation of running time in each experiment is shown in Table 1.
Table 1. Standard deviation of computing time in 8 groups [Unit:ms].
Group A B C D E F G H Mean
value Our
method 0.192 0.762 0.282 0.761 0.494 0.25 1.279 0.668 0.586
RANSAC 2.86 1.01 5.109 2.806 2.972 1.088 2.688 1.024 2.445
From Table 1 we can see that our method is better than RANSAC in computing time stability. That is because that the RANSAC is based on a random selection of samples to estimate the model, which introduces instability into the running time.
Limitations
[image:5.612.90.525.579.642.2]Conclusions
We propose a method to detect object under transformation of rotation, scaling and translation. The key idea of our method is using clustering algorithm to eliminate the error matching between feature points from the template image and the target image. From the experimental results, we can see that our method can deal with both indoor and outdoor images under different illumination and occlusion conditions. We also show that the overall result quality and the stability of running time of our method outperform the RANSAC algorithm. In the future, one possible direction is to extend our method for detecting multiple instances of object. We also interested in detecting the object under more complex transformations such as shear or flipping.
References
[1] Huang K.Q., Ren W.Q., Tan T.N. A Review on Image Object Classification and Detection [J]. Chinese Journal of Computers, 2014. Histograms of Oriented Gradients for Human Detection [C]// 2013 IEEE Conference on Computer Vision and Pattern Recognition. IEEE Computer Society, 2005: 886-893.
[2] Kumar Nam, Sathidevi P.S. Wavelet SIFT Feature Descriptors for Robust Face Recognition [C]//Advances in Computing and Information Technology, Heidelberg: Springer Berlin Heidelberg, 2013, 177: 851-859.
[3] Wang Meng, Hong Richang, Li Guangda, et al. Event driven web video summarization by tag localization and key-shot identification [J]. IEEE Transactions on Multimedia(S1520-9210), 2012, 14(4): 975-985.
[4] Wang Meng, Li Hao, Tao Dacheng, et al. Multimodal Graph-Based Reranking for Web Image Search [J]. IEEE Transactions on Image Processing(S1057-7149), 2012, 21(11): 4649-4661Dalal N, Triggs B.
[5] Wei W., Jun H, Yiping T. Image Matching for Geomorphic Measurement Based on SIFT and RANSAC Methods [C]// Computer Science and Software Engineering, 2008 International Conference on. IEEE, 2008: 317-320.
[6] Birchfield S.T., Rangarajan S. Spatiograms versus Histograms for Region-Based Tracking. [C]// Proceedings / CVPR, IEEE Computer Society Conference on Computer Vision and Pattern Recognition. IEEE Computer Society Conference on Computer Vision and Pattern Recognition. 2005:1158 - 1163.
[7] Felzenszwalb P.F., Girshick R.B., Mcallester D., et al. Object Detection with Discriminatively Trained Part-Based Models [J]. IEEE Transactions on Pattern Analysis & Machine Intelligence, 2014, 32(9): 6-7.
[8] Lowe D.G. Distinctive Image Features from Scale-Invariant Keypoints[J]. International Journal of Computer Vision, 2004, 60(2): 91-110.
[9] Ke Y., Sukthankar R. PCA-SIFT: a more distinctive representation for local image descriptors [C]// Computer Vision and Pattern Recognition, 2004. CVPR 2004. Proceedings of the 2004 IEEE Computer Society Conference on. IEEE, 2004: 506--513.
[10] Bay H., Tuytelaars T., Gool L.V. SURF: Speeded Up Robust Features [M]// Computer Vision – ECCV 2006. Springer Berlin Heidelberg, 2006.
[11] Luo. A Comparison of SIFT, PCA-SIFT and SURF [J]. International Journal Ofimage Processing, 2009, (4):143-152.
[13] Zhou W., Lu Y., Li H., et al. Spatial coding for large scale partial-duplicate web image search [C]// Proceedings of the International Conference on Multimedia. ACM, 2010.
[14] Jiun-Hung Chen, Chu-Song Chen, Yong-Sheng Chen. Fast algorithm for robust template matching with M-estimators [J]. IEEE Transactions on Signal Processing, 2003, 51(1): 230 - 243. [15] Fischler M.A., Bolles R.C. Random Sample Consensus: A Paradigm for Model Fitting with Applications to Image Analysis and Automated Cartography[J]. Readings in Computer Vision, 1987, 24(6): 726–740.
[16] Affine Covariant Features Database of Oxford University [DB/OL]// [2007-06]. http: //www.robots.ox.ac.uk /-vgg /research/affine/, 2007.
![Table 1. Standard deviation of computing time in 8 groups [Unit:ms].](https://thumb-us.123doks.com/thumbv2/123dok_us/298434.1031031/5.612.98.521.128.398/table-standard-deviation-computing-time-groups-unit-ms.webp)
