2017 2nd International Conference on Manufacturing Science and Information Engineering (ICMSIE 2017) ISBN: 978-1-60595-516-2
Building Aggregation Method Combining
Constrained Delaunay Triangulation and a
Filtering Process
Chengming Li, Xiaoli Liu and PeiPei Guo
ABSTRACT
Building aggregation is an important part of large-scale map generalization. A triangulation-based building aggregation approach is proposed here. To improve aggregation’s efficiency and accuracy, a six-feature filtering process is integrated to screen the triangles in the constructed constrained Delaunay triangulation (CDT). After filtering, the contours of retained triangles, as the connecting parts between buildings, are rectangularized and aggregated with buildings. Our experiments using diverse and real-world data have proved that this method is efficient and practical.1
INTRODUCTION
Buildings are the central element of large-scale city maps and their presentation is critical for the overall map effect. How to aggregate buildings is one of the processes that must be dealt with in the generation of large-scale maps. A large number of methods and strategies have developed for this challenging issue in the field of cartographic research [1-5]. Delaunay triangulation algorithm provides a new solution for building aggregation. However, there are still some limitations on its existing applications. The real-world data would tell us that the building surfaces tend to be clustered (dense), with regular shape (right-angled) and orderly located (parallel-sided) and so on. Here, we has found that, if we build Delaunay triangulation constrained by building boundaries, that is, building the triangulation covering and connecting buildings, the built triangulation can achieve full coverage without overlapping and the triangles connecting adjacent buildings tend to have
1Chengming Li, Xiaoli Liu, Peipei Guo Chinese Academy of Surveying and Mapping, Beijing,
"good" geometric features. Based on this finding, six factors are used to classify and filter triangles to determine the spatial distance between buildings. Then, the retained triangles, the connecting parts between buildings, are rectangularized. In such a way, the buildings can be aggregated by merging the connecting parts and buildings while retaining their right-angled features.
BUILDING AGGREGATION BASED ON CDT
The quality of triangulation is critical for building aggregation. A CDT can be built using the points on the building boundaries (original point set) and with the boundaries as constraints. The boundary contour of CDT is always a convex polygon, and covers all the buildings. Triangle units are distributed the entire data area, achieving seamless coverage without overlapping. The interior of the building is filled with some triangles, and the gap between the buildings is covered by other triangles. Buildings are connected by these triangles. The interconnected triangles represent the proximity between spatial objects well, making them a powerful tool for spatial proximity analysis. In this paper, they are used for qualitative analysis of buildings to be aggregated.
shared with other triangles; Type C, with all three edges share with other triangles; and Type D, isolated one with no edge shared with other triangles.(4) Altitude. The altitude of a triangle. This feature is not only applicable to single triangles, but also to a cluster of inter-connected triangles. In the case of a single triangle, the rule for altitude feature is as follows: for a Type I triangle, altitude is the altitude with edge containing two vertices as the base; otherwise, the altitude can have any edge as the base; for a Type II triangle, altitude is the altitude with edge containing two vertices of the same ID as the base; for a Type III triangle, altitude is the average altitude from its all three edges. In the case of a triangle set, the average altitude of all triangles is used. When the number of triangles in a set is less than a certain threshold C, the average altitude of all triangles is used. When the number of triangles in the set is greater than C, to eliminated the extreme values, the average altitude is calculated after excluding the largest and the smallest 1/5 values.(5) Angle. Whether the triangle is an acute or obtuse triangle. Oblique triangles are divided into acute ones and obtuse ones. There may be obtuse triangles with narrow and long shapes that connecting buildings far from each other in the boundary portion of the triangulation. They are unreasonable ones can be filtered out using the rule for angle feature.(6) Edge length. The edge length of a triangle. The average of a triangle’s three edges is considered here. The average edge length of the triangles connecting adjacent buildings tends to be shorter. On the other hand, the average edge length of the triangles connecting buildings far from each other or blocked by some other buildings is relatively longer. And these triangles can be filtered out using this rule for edge length.
AGGREGATION METHOD
Densifying Data Points And Building CDTs
Threshold determination and densification. When aggregating buildings using triangulation, the triangles are the key to identifying buildings’ proximity and connection. In the filtering process based on the above mentioned six features, the shape of the triangle is very important. In order to keep the "good" geometric shapes of the triangles in the triangulated network, it is important to increase the edges of buildings in the process of building the CDTs. Experiments has showed that the optimal densification threshold for constructing a triangulated network should be able to lead to as many approximately equilateral triangles as possible. As it is hard to reach the ideal state, triangles connecting buildings are often isosceles triangles. Such a triangulation can ensure better results of the following filtering.
Triangle Filtering Based on Six Features
The filtering process mainly consists of following steps: (1)Filtering based on location: to exclude triangles inside the building and retain those outside the building only. (2)Filtering based on attribution: to exclude type I triangles with no or only one edge building boundary, retain type II triangles and reserve type I triangles with two edges being building boundaries and type III triangles for future modification. (3)Filtering based on edge length: to exclude triangles with average edge length longer than the threshold and keep those with average edge length shorter than the threshold. (4)Filtering based on angle: keep obtuse triangles with the obtuse angle’s opposite side on the building boundary and reserve other obtuse triangles for further modification; to keep acute triangles with any edge on the building boundaries and reserve Type II acute triangles with no edges on the building boundaries for future modification. (5)Modifying the reserved obtuse triangles: to put obtuse triangles with two edges not being building boundaries that has retained connected triangles back into the set of retained triangles. (6)Filtering based on altitude: to calculate the average altitude of each set of retained triangles, then exclude the triangle set with average altitude higher than the threshold and keep the triangle set with average altitude shorter than the threshold. (7)Modifying reserved Type I, II & III triangles: keep marked triangles (Types II & III) being Type B triangles and Type I triangles with its edge not on the building boundary shared with retained triangle.
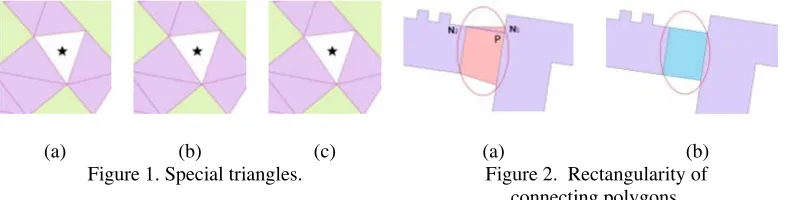
Several types of modified triangles with star mark are shown in Fig 1. Type III triangle in (a) has its all three edges shared with retained triangles; Type I triangle in (b) has its all three vertices on a consecutive boundary and its only connected triangle is retained; and the obtuse triangles in (c) have connected triangles on both sides retained.
The results of the filtering process are represented in two manners: whether a triangle is in the excluded set or retained set; and marked as “true” (retained) or “false” (excluded). The set attribution can ensure quick identification of objects to be filtered in every step. And the true/false mark enables quick querying of triangle status. These two methods are combined in our study due to the needs of the application.
Automatic Extraction And Rectangularity of Connecting Polygons
triangle from T and put it as a current seed triangle (seedTri) into the processed triangle set (S); and get the triangles sharing edge with the seedTri, and proceed to step (4). If T is empty, then proceed to step (5) directly. (4)If there is no triangle sharing edge with the seedTri or the connecting triangle is not in R, place the edge in current connecting boundary edge set (E). If all connecting triangles are processed, return to step (3); otherwise, to place unprocessed triangles into T and return to step(3). (5)Connect edges in E to form the contour of a connecting polygon. The search for a connecting polygon is finished then. Clear E and return to step (2). (6)Determine the contour of the last connecting polygon and end the search. All connecting polygons are obtained.
Connecting polygons are generated from triangles. So it is difficult to ensure the right-angled feature of the resulting buildings. Rectangularity is a processing step scarcely used previous studies[6-7]. It is used here to ensure the processing’s integrity and consistency. We try to main the right-angled feature by processing the connecting parts. The contours of the connecting part obtained through the above steps can be divided into common edges of the buildings and those edges that are not common edges. Common edges are original building boundaries. And non-common edges connect visually adjacent buildings. Only the later edges proceed with rectangularity process. In the triangulated network, the distinction between the common and non-common edges lies in the location of the triangles on the two sides of the edge. For common edge, the triangle on one side is within the building and the triangle on the other side is outside the building. And for non-common edges, triangles on both sides are outside the building. The two points of each non-common edge are shared with the common edges. A vertical line can be drawn from one point of a non-common edge to the opposite common edge. If the other end of the vertical line can fall on the opposite common edge, this end point of non-common edge is called short vertex; and the other end point of non-common edge is called long vertex. As shown in Fig 2, (a) is a non-rectangularized connecting portion, and (b) is a rectangularized connecting portion.
(a) (b) (c) (a) (b)
Figure 1. Special triangles. Figure 2. Rectangularity of
[image:5.612.100.495.513.613.2]EXPERIMENT AND ANALYSIS
Two data samples are used: one from the south China and one from the north China. Both urban data and rural data are included in the sample. Sample 1 is the 1: 2000 map data of 60-km2 central urban area of Chengdu. This map is generated into 1: 5000 and 1: 10,000 maps in the experiment. Sample 2 is the 1:500 map data of 30-km2 urban and rural areas of Handan. This map is generated into 1:5000 and 1:10,000 maps in the experiment.
Figure 3 shows original building distribution (a) and the aggregated effects (b). We can see that the neighboring polygons are reasonably merged and the right-angled features are well preserved in the results. Figure 3 also compares the aggregation effects using different methods: the original building (c); results of traditional triangulation algorithm (d); results of buffer method proposed by Bader et al.[8] (e); and results of the aggregation method proposed in this paper (f). It can be seen from the comparisons that, though able to correctly recognize the adjacent relations of buildings and aggregate them, the traditional triangulation method and the buffer aggregation method can’t keep the right-angled features of the buildings.
(a) (b)
[image:6.612.103.499.341.569.2](c) (d) (e) (f)
Figure 3. Comparisons of aggregation effects.
CONCLUSIONS
both qualitative and quantitative representations of spatial object adjacency. It enables us to determine whether one building is adjacent to another building or not and to analyze and measure the triangles within the network and calculate the proximity. Our experiment and analysis of diverse real-world data have proved the reasonableness of the proposed building aggregation method combining constrained Delaunay triangulation (CDT) and a filtering process. With efficiency much higher than that of manual process, it is able to meet the needs of actual production for building generation. The method has been applied in data reduction projects in multiple cities and contributed to good results.
The building aggregation based on CDT and filtering process focuses on the gaps between different buildings. To achieve the integration of building aggregation and simplification, further studies will be carried out to develop filtering rules based on the characteristics of the triangles within the depressed building profile.
ACKNOWLEDGEMENTS
This research was supported by the National SciTech Support Plan (2015BAJ06B01).
REFERENCES
1. Wang Guangxia, Yang Pei.2000.“Application of Mathematic Morphology in Uniting Blocks of Residential Area.” Journal of Institute of Surveying and Mapping, 17(3): 201-206.
2. Wang Huilian, Wu Fang, Zhang Linlin, et al. 2005. “The Application of Mathematical Morphology and Pattern Recognition to Building Polygon Simplification.” Acta Geodaetica et Cartographica Sinica, 34(3): 269-275.
3. Guo Renzhong, Ai Tinghua. 2000. “Simplification and Aggregation of Building Polygon in Automatic Map Generalization.” Journal of Wuhan Technical University of Surveying and Mapping, 25(1): 25-30.
4. Guo Jianzhong, Xie Mingxia, Li Zhulin. 2011.“Block Aggregation Based on Line Buffer Analysis.” Geography and Geo-Information Science, 27(6): 111-112.
5. He Yubing. 2007. “Study and Application of Algorithm for Polygon Aggregation in Geo-Cartographic Generalization.” Zhejiang University.
6. Liu Pengcheng, Ai Tinghua, Deng Jifang. 2008. “Simplification and Rectangularity of Building Polygon Based on Least Squares Adjustment.” Journal of China University of Mining and Technology, 37(5): 699-704.
7. Liu Pengcheng, Ai Tinghua, Hu Jinshan. 2008. “Rectangularity of Building Polygon Based on Condition-Extremum.” Geomatics and Spatial Information Technology, 31(5): 12-14.