Comparative Analysis of Nitrides Band
Structures Calculated by the Empirical
Pseudopotential Method
Pierre Ziade
1,∗,
Christophe Palermo
2,
Antonio Khoury
1,
Roland Habchi
1,
Myriam Rahal
3,
Luca Varani
21Research platform of nanosciences and nanotechnologies, Pierre Gemayel campus, Fanar,
Lebanese University, 90239 Lebanon
2Institut d’ ´Electronique du Sud (CNRS UMR 5214), Universit´e Montpellier II, France 3Facult´e des Sciences II, Universit´e Libanaise, Fanar, Lebanon
∗Corresponding Author: [email protected]
Copyright c⃝2014 Horizon Research Publishing All rights reserved.
Abstract
The electronic band structures of zinc blende and wurtzite GaN and InN are calculated using the empirical pseudopotential method, with the form factors adjusted to reproduce correctly the most important band features. To this end, a comprehensive analysis and comparison with several experimental and theoretical data reported in the literature is performed. Relevant energy spacings as well as direct and indirect band gaps are then derived from the band structures. The electron effective masses at high symmetry points are also obtained using a parabolic line fit. The calcu-lated parameters are reported together with existing data so that they can be easily compared and used in the interpretation of experiments and for numerical simulation purposes.Keywords
Nitrides, Band structure, Pseudopoten-tial empirical method1
Introduction
In recent years, the interest in III-V nitrides has been increasing considerably because of their important tech-nological applications due to their interesting electrical and optical properties. In particular, they have been widely investigated and exploited in the development of optoelectronic devices in the blue and ultraviolet spec-tral regions as well as for high power and high tempera-ture electronics [1, 2, 3, 4, 5, 6, 7, 8]. An additional fea-ture further enhances the III-V nitrides potential over other semiconductors: the strong interaction between the electrons and optical phonons [9, 10], a crucial prop-erty for the development of terahertz devices. In this context, it is very important to have access to all the information about the band structure details and trans-port parameters that are necessary in both
experimen-tal applications (device design and optimization), and theoretical modelling (Monte Carlo simulations, hydro-dynamic calculations, etc. ) [11].
Binary nitrides such as GaN, AlN and InN usually cristallize in the wurtzite structure, but can also be grown in the zinc blende structure [12, 13, 14]. Early studies of the interband optical absorption performed on InN thin films were interpreted as being consis-tent with a fundamental energy gap of about 2 eV [15, 16, 17, 18, 19]. Since 2002, improvements in epi-taxial growth techniques enabled the availability of both wurtzite and zinc blende InN films of much higher qual-ity with considerably low electron concentrations, much higher electron mobilities, but also lower oxygen defects caused by annealing in an oxygen atmosphere that leads to formation of InN-InO2alloys. Characterization of the
obtained high-quality InN layers revealed for InN a band gap lower than 1 eV [20, 21, 22], much smaller than the previously reported values. Parallel to the experi-mental improvements, theoretical band structure calcu-lations of wurtzite and zinc blende InN are being revised in order to fit experimental results [23, 24]. In this con-text, we present a theoretical investigation of the zinc blende and wurtzite band structures using an empirical pseudopotential approach (EPM), while providing sets of adjusted symmetrical and antisymmetrical pseudopo-tential form factors for InN consistently with those latest experimental results, but also for GaN and AlN whose band structures are also calculated for both zinc blende and wurtzite structures, in order to further validate our calculations. This will help the understanding of nitrides electronic properties and their important band structure parameters such as direct and indirect band gaps, effec-tive masses and nonparabolicity coefficients.
Sec-tion 4 summarizes the results, while presenting a com-parative analysis of the main III-nitrides parameters.
2
Band structure of zinc blende
nitrides
2.1
Zinc blende structureLet consider in the left panel of Fig. 1 the face-centered cubic lattice whose base vectors are given by: a1 = (0, a/2, a/2), a2 = (a/2,0, a/2), and a3 =
[image:2.595.58.306.304.411.2](a/2, a/2,0), whereais the side of the lattice [25]. The zinc blende structure is formed from this face-centered cubic lattice by placing at each site of the lattice an el-ementary pattern composed of an atom of zinc and an atom of sulphur separated by a distance equal to one quarter of the diagonal of the unit cell (see Fig. 1).
Figure 1. Face-centered cubic structure (left) and zinc blende lattice (right).
The reciprocal lattice of a face-centered cubic lattice, and as a consequence for a zinc blende structure, is a centered cubic lattice whose base vectors are given by [25]: b1 = (2π/a)(−1,1,1), b2 = (2π/a)(1,−1,1), and b3 = (2π/a)
(1,1,−1). Given the high symmetry of the Bril-louin zone, the band structure calculations can be considerably reduced using the symmetry operations of the crystal. It can be easily proved that a reduced region representing 1/48th of the Brillouin zone is sufficient
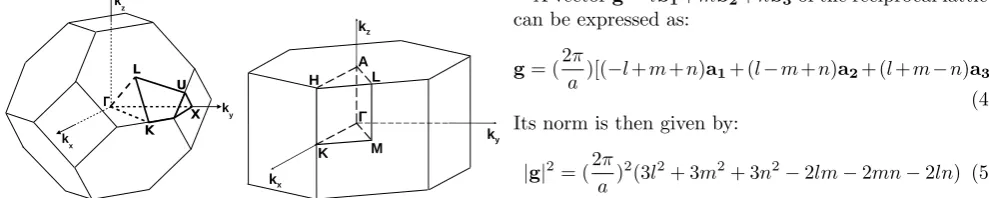
to determine the energetic structure of the zinc blende crystals [25]. The reduced region is delimited by the following points whose coordinates are given in units of (2π/a): Γ = (0,0,0), X = (0,1,0), K = (0.75,0.75,0),
L= (0.5,0.5,0.5), andU = (0.25,1,0.25) (see left panel of Fig. 2).
Figure 2. Brillouin zones of the zinc blende (left) and wurtzite (right) structures.
2.2
Semi-empirical pseudopotential calcula-tion for zinc blende nitridesThe one-electron Schr¨odinger equation resulting from the variational method by using a base of plane waves is [26]:
[
¯
h2
2m(k+g)
2−ϵ
]
Ck+g+ ∑
g′
Vg−g′Ck+g′ = 0 (1)
wherekis a vector of the first Brillouin zone,ga vector of the reciprocal lattice,ϵthe energy eigenvalues,Vg−g′
(V∆g) the pseudopotential andC the eigenvector of the
Hamiltonian.
We notice that (1) can be reduced to the formHC =
ϵC, where the elements of the matrixH can be written as:
Hg,g′ = (
¯
h2
2m)|k+g|
2δ
g,g′+Vg,g′ (2)
In this expression, Vg,g′ = V∆g = ΣVrexp(−i∆g·r),
where the sum is over the atoms of the unit cell. We consider the origin at the midpoint between the two atoms of the unit cell so that ra= (a8)(1,1,1) =sand rb= (−a8)(1,1,1) =−s(see left panel of figure 3).
V∆g = V∆gs cos[(
π
4)(∆gx+ ∆gy+ ∆gz)]
−iV∆ga sin[(π
4)(∆gx+ ∆gy+ ∆gz)] (3) where Vs
∆g and V∆ga are the symmetrical and
anti-symmetrical pseudopotential form factors respectively. They are treated as adjustable parameters that can be adapted with experimental data, which explains why the method is called semi-empirical pseudopotential method [26]. In other terms, the band structure calculations are made using experimental data that are adjusted until the results of the calculations agree with the experience.
v
f
pO
+
3
r1=s
r2=−s
f
v
f
v q
O
9 :
r1=d1 r2=d2 r3=−d2
[image:2.595.321.544.502.601.2]r4=−d1
Figure 3. Elementary patterns of the zinc blende (left) and wurtzite (right) structures.
A vectorg=lb1+mb2+nb3of the reciprocal lattice
can be expressed as:
g= (2π
a )[(−l+m+n)a1+ (l−m+n)a2+ (l+m−n)a3]
(4) Its norm is then given by:
|g|2= (2π
a )
2(3l2+ 3m2+ 3n2−2lm−2mn−2ln) (5)
Therefore, the groups of vectors of the zinc blende structure are (coordinates are in units of 2π/a):
[image:2.595.54.549.667.766.2]Table 1. Pseudopotential form factors (in Ry) of zinc blende GaN, AlN and InN used in the calculations.
Vs
3 Vs8 Vs11 V3a Va4 Va11
GaN −0.2218 0.0180 0.0989 0.3360 0.2430 0.0400
AlN −0.3284 −0.0374 0.2341 0.2311 0.2757 −0.0101
[image:3.595.46.540.256.522.2]InN −0.2186 −0.0055 0.0569 0.0811 0.0531 0.0314
Table 2. Eigenenergies of zinc blende GaN, AlN and InN for the high-symmetry points Γ,X andL. The values are in eV and are given with respect to Γv15. Our calculations are evidenced by the asterisk, while all other values have been taken from the literature.
GaN AlN InN
Γv
15 0.00*, 0[27], 0.0(0.0)[28], 0.000[18, 29, 30] 0.00*, 0[27], 0.000[18, 29], 0.0(0.0)[28] 0.00*, 0.0[24], 0.000[23, 31] Γc
1 3.23*, 3.20[27], 2.1(3.1)[28], 3.1[32],
3.200[33], 3.308[18], 3.383[29], 3.213[30]
5.88*, 5.91[27], 5.914[33], 6.0[32],
5.840[18], 5.936[29], 4.2(6.0)[28]
0.51*, 0.592[23], 0.435[31]
Γc15 12.11*, 12.14[27], 10.098[18], 10.300[29],
10.248[30], 10.6(12.2)[28]
13.99*, 14.16[27], 12.579[18], 13.406[29], 12.3(14.6)[28]
9.08*, 9.597[23], 10.174[31]
Xv3 −5.45*, −5.47[27], −6.294[18], −6.149[29],−5.923[30],−6.5(−6.9)[28] −
5.19*, −5.26[27], −5.388[18],
−5.262[29],−5.0(−5.6)[28] −
5.41*, −5.5[24],
−4.795[23],−4.687[31]
Xv
5 −2.28*, −2.29[27], −2.459[18], −2.693[29],−2.086[30],−2.8(−3.0)[28] −
1.92*, −1.98[27], −2.315[18],
−2.337[29],−1.8(−2.1)[28] −
2.25*, −2.8[24],
−1.481[23],−1.687[31]
Xc1 4.72*, 4.70[27], 4.428[18], 4.571[29],
4.585[30], 4.7[32], 4.700[33], 3.2(4.7)[28]
4.91*, 4.92[27], 4.918[33], 4.9[32], 5.346[18], 5.102[29], 3.2(4.9)[28]
4.38*, 4.758[23], 2.903[31]
Xc
3 7.45*, 7.46[27], 6.010[18], 6.805[29],
6.265[30], 12.2(14.5)[28]
10.07*, 10.10[27], 8.794[18], 10.661[29],
14.1(17.3)[28]
5.78*, 5.102[23], 6.322[31]
Lv
1 −6.15*, −6.19[27], −6.812[18], −6.743[29],−6.644[30],−7.4(−7.8)[28] −
5.86*, −5.98[27], −6.251[18],
−6.179[29],−6.0(−6.7)[28] −
6.51*, −6.5[24],
−4.967[23],−5.229[31]
Lv
3 −0.74*, −0.78[27], −0.834[18], −0.931[29],−0.772[30],−1.0(−1.1)[28]
−0.68*, −0.75[27], −0.718[18],
−0.728[29],−0.5(−0.6)[28]
−0.69*, −1.0[24],
−0.460[23],−0.557[31]
Lc1 6.23*, 6.20[27, 32], 6.200[33], 5.149[18],
5.636[29], 5.510[30], 5.0(6.2)[28]
9.14*, 9.08[27], 9.079[33], 9.3[32], 8.264[18], 9.423[29], 10.0(12.6)[28]
4.39*, 3.213[23], 3.813[31]
Lc
3 11.22*, 11.19[27], 10.416[18], 9.916[29],
10.606[30], 10.6(12.3)[28]
11.85*, 11.91[27], 12.202[18],
12.014[29], 11.0(13.2)[28]
7.52*, 10.040[23], 6.954[31]
Table 3. Energy gaps of zinc blende GaN, AlN and InN for the high-symmetry points Γ,XandL. Our calculations are evidenced by the asterisk, while all other values have been taken from the literature. All values are in eV.
GaN AlN InN
EΓg−Γ 3.23*, 3.20[27, 34], 3.10[35, 28], 3.21[30],
3.38[29, 36], 3.17[15], 3.82[37], 3.26[38],
3.25[39], 3.43[40], 3.2[41], 3.299[42], 2.08[43],
2.65[44]
5.88*, 6.0[28, 41, 42, 45], 5.914[27], 6.02[15], 5.94[29], 6.27[37], 6.18[40],
6.20[36]
0.51*, 0.592[23], 0.435[31]
EΓg−X 4.72*, 4.70[27, 28, 35], 4.58[30],
4.57[29, 40, 36], 4.61[37], 4.7[41], 4.52[42]
4.91*, 4.9[28, 41, 42, 45], 4.918[27], 4.92[15], 5.10[29, 40, 36], 5.24[37]
4.38*, 4.758[23], 2.903[31]
EΓ−L
g 6.23*, 6.20[27, 28, 35], 5.51[30], 5.64[29, 36],
5.97[37], 5.66[40], 6.2[41], 5.59[42]
9.14*, 9.079[27], 9.3[28, 41, 42], 9.70[37],
9.42[29, 36], 9.43[40], 9.21[45]
4.39*, 3.213[23],
3.831[31]
EL−L
g 6.97*, 6.9[38], 7.0[46] 9.82* 5.08*, 3.673[23],
3.85[31]
EX−X
g 7.00*, 7.2[38], 7.6[46] 6.83* 6.63*, 6.239[23],
[image:3.595.51.540.619.779.2]Table 4. Effective masses of zinc blende GaN, AlN and InN. Our calculations are evidenced by the asterisk, while all other values have been taken from the literature. All values are in units of the free electron mass.
GaN AlN InN
me 0.1393*, 0.12[30], 0.11[15], 0.13[29],
0.15[47], 0.14[38], 0.21[48], 0.124[49],
0.127[41], (0.15±0.01)[39]
0.271*, 0.23[18], 0.28[50],
0.21[29, 45, 47], 0.19[15], 0.209[41],
0.30[51], 0.25[39, 42]
0.1140*, 0.066[23], 0.07[52]
m[hh100] 0.9807*, 0.84[18], 0.86[50], 0.76[53],
0.85[51], 0.85[42], 1.34[30]
1.3114*, 1.02[18], 1.44[50],
1.05[53], 1.39[51], 1.02[42]
0.8381*, 1.262[23], 0.83[52]
m[lh100] 0.1624*, 0.22[18], 0.21[50], 0.21[53],
0.24[51], 0.24[42], 0.70[30]
0.2925*, 0.37[18], 0.42[50],
0.35[53], 0.44[51], 0.35[42]
0.0984*, 0.100[23], 0.16[52]
m[hh111] 2.6063*, 2.07[18], 2.09[50], 1.93[53],
1.79[51], 2.13[42], 1.06[30]
3.0688*, 2.64[18], 4.24[50],
2.73[53], 3.85[51], 4.55[42]
2.2593*, 2.744[23], 0.83[52]
m[lh111] 0.1350*, 0.19[18], 0.19[50], 0.18[53],
0.21[51], 0.21[42], 0.63[30]
0.2343*, 0.30[18], 0.36[50],
0.30[53], 0.36[51], 0.28[42]
0.0859*, 0.096[23], 0.16[52]
m[hh110] 0.9763*, 1.52[18], 1.65[50], 1.51[53],
1.40[51], 1.55[42], 1.44[30]
1.3140*, 1.89[18], 3.03[50],
2.16[53], 2.67[51], 2.44[42]
0.8397*, 2.122[23], 1.55[52]
m[lh110] 0.1412*, 0.20[18], 0.19[50], 0.19[53],
0.21[51], 0.21[42], 0.58[30]
0.2468*, 0.32[18], 0.37[50],
0.31[53], 0.38[51], 0.29[42]
0.0887*, 0.097[23], 0.15[52]
• g3 ≡(−1,−1,−1), (±1,0,0), (0,±1,0), (0,0,±1),
(1,1,1)
• g4 ≡(−1,−1,0), (−1,0,−1), (0,−1,−1), (0,1,1),
(1,0,1), (1,1,0)
• g8 ≡ (−2,−1,−1), (−1,−2,−1), (−1,−1,−2),
(−1,0,1), (−1,1,0), (0,−1,1), (0,1,−1), (1,−1,0), (1,0,−1), (1,1,2), (1,2,1), (2,1,1)
• g11 ≡ (−2,−2,−1), (−2,−1,−2), (−2,−1,0),
(−2,0,−1), (−1,−2,−2), (−1,−2,0), (−1,−1,1), (−1,0,−2), (−1,1,−1), (−1,1,1), (0,−2,−1), (0,−1,−2), (0,1,2), (0,2,1), (1,−1,−1), (1,−1,1), (1,0,2), (1,1,−1), (1,2,0), (1,2,2), (2,0,1), (2,1,0), (2,1,2), (2,2,1)
• g12≡(−2,−2,−2), (±2,0,0), (0,±2,0), (0,0,±2),
(2,2,2) . . .
−10
−5
0
5
10
15
20
25
Energy (eV)
3 5 1 3
1 3 1 3
15 1 15
[image:4.595.59.557.80.510.2]Γ
X U L
Γ
K
Figure 4. Band structure of zinc blende GaN obtained by our pseudopotential calculations.
Actually, only 4 groups of vectors are practically nec-essary for the calculations [26]. As a matter of fact, the form factorV0corresponding tog0is a constant
poten-tial that shifts the whole energetic scale of a quantity
V0. This is the reason why we can attribute to V0 the
−10
−5
0
5
10
15
20
25
Energy (eV)
3 5 1 3
1 3 1 3
15 1 15
Γ
X U L
Γ
K
Figure 5. Band structure of zinc blende AlN obtained by our pseudopotential calculations.
value zero or any other adequate value. Besides, we can neglect the pseudopotential form factors corresponding to g2 > 11(2π/a)2, because V
g typically decreases as
1/g2 for high values of g [26]. Furthermore, the
sym-metrical term corresponding tog4and the
antisymmet-rical term corresponding to g8 are always null because
cos(g4·s) = sin(g8·s) = 0 for any g4 or g8 vector.
Therefore, only 6 pseudopotential form factors are suffi-cient for the calculation: V3s,V8s, V11s,V3a,V4sandV11a.
In Table 1 are given the pseudopotential form factors of the zinc blende GaN and InN that we recommend and that we used in our calculations. In particular, the pseudopotential form factors of InN have been adapted to reproduce a band structure in good agreement with the latest experimental results. The lattice constants used for zinc blende GaN, AlN and InN are: 0.44953 nm [27], 0.43752 nm [27] and 0.4986 nm [54, 55] respectively. We still have to choose the size of the Hamiltonian matrix whose diagonal elements are given by:
Hi,i= (
¯
h2
2m)|k+gi|
[image:4.595.50.298.288.710.2]and non-diagonal elements are given by:
Hi,j = Vs(|gi−gj|) cos[(gi−gj)·s]
+iVa(|gi−gj|) sin[(gi−gj)·s] (7)
fori̸=j.
It is evident that the size of the Hamiltonian matrix depends on the chosen number of reciprocal lattice vec-tors. For that purpose, we choose a maximum value to limit the norm of the chosen reciprocal vectors given by (5). In our case, we have verified that the condition
|g|2 <21(2π/a)2 (corresponding to a set of 113
recip-rocal vectors) provides sufficiently accurate results. In this way, we can calculate all the elements of the Hamil-tonian matrix using (6) and (7). The diagonalization of the Hamiltonian matrix gives directly the eigenvalues of the electronic states corresponding to the vectorkof the Brillouin zone.
2.3
ResultsThe energetic band structures obtained by our pseu-dopotential calculations are represented in figures 4, 5 and 6 for zinc blende GaN, AlN and InN respectively, along the high-symmetry points Γ, X, U, L, and K of the Brillouin zone. We notice that the energy reference level matches the top of the valence band. From a qualitative point of view, the overall shape of the valence and conduction bands that we have obtained for zinc blende GaN and AlN is similar to that obtained by Fritsch et al. [18], Al-Douri et al. [37], Pugh et al. [15] and Aourag et al. [27, 33]. The same occurs for zinc blende InN whose overall shape of the va-lence and conduction bands is similar to the reexamined band structures of Fritschet al. [23] and Kinget al. [24].
−10
−5
0
5
10
15
20
Energy (eV)
3 5 1 3
1 3 1 3
15 1 15
[image:5.595.36.277.468.652.2]Γ
X U L
Γ
K
Figure 6. Band structure of zinc blende InN obtained by our pseudopotential calculations.
In order to quantitavely compare the obtained band structures with other results, the obtained energetic eigenvalues are given in Table 2 for the high-symmetry points Γ, X and L. All eigenvalues are given with re-spect to the top of the valence band Γv15. We note first
that all results and calculations before 2002 that do not take into consideration the new corrections brought into the band structure of InN have not been included in our comparison. In addition, we note that the values cor-responding to ref. [24] are approximate values that we
have estimated from the band structure of zinc blende InN obtained by Kinget al. [24], since no accurate values are available in the article, but only the obtained band structure. On the other hand, in ref. [28], there are two values proposed for each energetic eigenvalue, both cal-culated by the local-density approximation (LDA), but the value in parenthesis is the result of an additional correction by the Green’s function approximation (GW) which takes into consideration the Coulomb screening ef-fect of the electrons [28]. We can initially point out the zero value assigned to Γv
15 by all cited references [27],
[33], [32], [28], [18], [23], [29], and [30], which means that the energy reference level has been taken at the top of the valence band in all calculations. Regarding the results of zinc blende GaN and AlN, we remark an ex-cellent agreement between our results and those found by Aourag et al. [27, 33] since the relative difference between the results does not exceed 2% for most of the energy eigenvalues, and even 0.5% for some of them.
We also observe a general agreement with the results of references [18], [29], [30] and [32] and ours, since their relative deviation does not exceed 10% for most energy eigenvalues. As for the calculations performed by Rubio
et al. [28], there’s a good agreement with our results for the eigenenergies Γ15v , Γv1, Γc15, X5v, X1c, and Lc3
cor-responding to GaN and AlN, for Lc1 corresponding to
GaN, and for X3v and Lv3 corresponding to AlN. But
the eigenvalues Γv
1,X1v,X3c of GaN and AlN are widely
overestimated (by at least 20%) in [28]. We also notice an underestimation of the eigenvaluesXv
3 andLv3
corre-sponding to GaN with respect to our results and to other calculations. On the other hand, regarding the results of zinc blende InN, we first remark a slight underesti-mation of most valence band eigenenergies obtained by our calculations with respect to those of references [23] and [31]. This is due to the fact that we have adapted our valence band structure to the very recent results by King et al. obtained by a combination of experi-mental characterization by high-resolution x-ray photoe-mission spectroscopy assisted by theoretical calculations via the quasiparticle corrected density functional theory [24]. Despite this slight underestimation, our values are generally in good agreement with the results of the cited works of Fritschet al. [23], Bechstedtet al. [31] and of course King et al. [24].
In order to ensure the precision of our semi-empirical results in comparison to other semi-empirical and ab-initio calculations and experimental results, the values of the bandgapsEΓ−Γ
g ,EgΓ−X,EgΓ−L,EgX−X andELg−L
at high-symmetry points Γ, X and L are shown in Ta-ble 3. Regarding the energy spacings of GaN and AlN, we remark a good agreement between the values found by our calculations and those of most other references in Table 3. Even the bandgap values given by Rubio
et al. [28] agree with our calculations. As a matter of fact, for most values of Table 3, the relative difference between our calculations and those of the other refer-ences does not exceed 10%. Only the values of EgΓ−Γ
proposed by Al-Douri et al. [37] and Palummo et al.
[44] for zinc blende GaN make an exception: Palummo underestimates the gap value to 2.65 eV and Al-Douri overestimates it to 3.82 eV. However, the value ofEΓ−Γ
g
for AlN and the values ofEΓ−X
AlN proposed by Al-Douriet al. are in good agreement with our calculations. The slight disagreements do not prevent a general good agreement with other theoreti-cal and experimental results. As for the obtained energy spacings for zinc blende InN, they are in good agreement with the results of Fritschet al. [23] and Bechstedt et al. [31], despite the slight overestimation of the energy spacingsEΓ−L
g ,EgL−LandEgX−Xdue to the adaptation
of our InN valence band structures with the very recent results and theoretical calculations performed by King
et al. [24], as we have already explained.
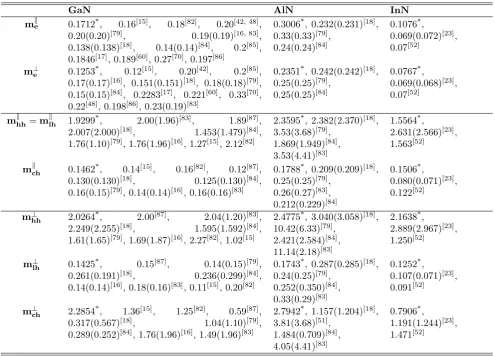
On the other hand, the effective electron mass is a fun-damental quantity of semiconductors, whose knowledge is necessary for the interpretation of several experiments and theoretical models. Its value at the bottom of the conduction band (or at the top of the valence band) can be obtained from the band structure of the material un-der investigation using the parabolic approximation
1
m∗ =
4π2
h2
∂2E(k)
∂k2 (8)
We have calculated through the parabolic approxima-tion the electronic effective mass at Γ point, but also the light hole (lh) and heavy hole (hh) effective masses along the [1, 0, 0], [1, 1, 1] and [1, 1, 0] directions for zinc blende GaN, AlN and InN. Our obtained results are given in Table 4 in comparison with other theoret-ical and experimental values available in the literature. Concerning the electronic effective masses, our results agree with most references cited in Table 4. As for the hole effective masses, we remark a discrepancy between the values given by the different cited references, which prevents to assert definitely the validity of our results. Nevertheless, although we use the parabolic approxima-tion method which is simple compared to more sophis-ticated methods, some of our values actually coincide with the results from other references.
3
Band structure of wurtzite
ni-trides
3.1
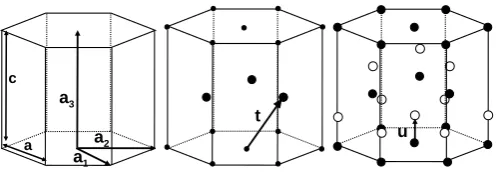
Wurtzite structureThe base vectors of the hexagonal lattice are shown in the left panel of Fig. 7: a1= (a,0,0),a2= (a2)(1,
√
3,0) and a3 = (0,0, c) [25]. The compact hexagonal
struc-ture is made from the hexagonal lattice by placing at each site of the lattice two atoms separated by a vector
t = (13a1 + 31a2 + 12a3) (see middle panel of figure
7). Finally, the wurtzite structure is made from the compact hexagonal lattice by placing at each site two atoms separated by a vector ua3, where u ≈ 0.375 is
a parameter relative to the wurtzite structure (right panel of figure 7). Therefore, as a result, the elementary pattern of the wurtzite structure is made of 4 atoms.
The reciprocal lattice of the hexagonal lattice is also hexagonal. The base vectors of this reciprocal lattice are given by: b1 = (a2π√3)(
√
3,1,0), b2= (a4π√3)(0,1,0)
andb3= (2πc )(0,0,1). Thus, the first Brillouin zone of
[image:6.595.311.560.51.138.2]the reciprocal lattice of the hexagonal structure is also hexagonal. Given the high symmetry of the Brillouin
Figure 7. Hexagonal lattice (left), compact hexagonal structure (middle) and wurtzite structure (right).
zone, the band structure calculations can be consider-ably reduced using the symmetry operations of the crys-tal. In particular, it can easily be proved that a reduced region representing 1/24thof the Brillouin zone such as
reported in the right panel of Fig. 2 is sufficient to de-termine the energetic structure of the wurtzite crystals. This reduced region is delimited by the following points: Γ = (0,0,0) (origin),H = (2π3a,2πa ,2πc ) (extremity of an edge joining two rectangular sides), A= (0,0,πc) (cen-ter of an hexagonal side), K = (2π
3a, 2π
a ,0) (middle of
an edge joining two rectangular sides), L = (0,2π
a ,
2π
c )
(middle of an edge joining an hexagonal and a rectan-gular side), and M = (0,2πa ,0) (center of a rectangular side).
3.2
Semi-empirical pseudopotential
cal-culation for wurtzite nitrides
The elementary pattern of the wurtzite structure is made of 4 atoms (see right panel of figure 3). By consid-ering the origin at the center of the parallelogram formed by these atoms, their positions according to the base vec-tors (a1,a2,a3) are given by: r1 = (−16 −16,−14−u2), r2 = (16,16,14 −u2), r3 = (−16,−16,−14 + u2) and r4 =
(16,16,14 +u2). Letd1 =r1 =−r4 andd2=r2=−r3.
According to the unit vectors (i,j,k), the expressions of d1 and d2 become: d1 = (14,
√
3 12,
1+2u√
6 )a, and d2 =
(14,√123,1−√2u
6 )a.
Because the atoms at positions r1 and r2 are
iden-tical (same atomic pseudopotential V1), and the atoms
at positions r3 and r4 are also identical (same atomic
pseudopotentialV2), the expression of the
pseudopoten-tial is given by: V∆g=V1(expi∆g·r1+expi∆g·r2)+
V2(expi∆g·r3+ expi∆g·r4). The calculation leads to
the final expression:
V(|∆g|) =Vs(|∆g|)Ss(|∆g|) +iVa(|∆g|)Sa(|∆g|) (9) where Ssand Sa are the symmetrical and antisymmet-rical structure factors with:
Ss= cos[2π(∆l 6 +
∆m
6 + ∆n
4 )] cos(πu∆n) (10) and
Sa = cos[2π(∆l 6 +
∆m
6 + ∆n
4 )] sin(πu∆n) (11) and whereVsandVa are the symmetrical and antisym-metrical pseudopotential form factors.
A vector of the reciprocal lattice can be expressed as:
g= 2πa (li+2m√−l
3 j+
√
3
Table 5. Pseudopotential form factors (in Ry) of wurtzite GaN, AlN and InN used in the calculation. The values of|G|2are given
in units of (2π/a)2.
|G|2 113 121 11724 256 4 41724 513 512 51724 6 656 713
GaN VsG −0.348 −0.371 −0.280 −0.053 0.059 0.083 0.056 0.066 0.067 0 0.021 0
VaG 0 0.276 0.225 0.110 0 0.051 0 0.036 0.033 0.0065 0.005 0.002
AlN VsG −0.363 −0.321 −0.130 −0.153 0.034 0.187 0.076 0.066 0.058 0 0.121 0
VaG 0 0.476 0.125 0.310 0 −0.051 0 0.034 0.033 0.012 0.005 −0.013
InN VsG −0.288 −0.255 −0.217 −0.010 0.044 0.056 0.025 0.015 0.036 0 −0.006 0
VaG 0 0.251 0.274 0.109 0 −0.032 0 0.029 0.0205 0.0125 0.016 −0.066
Table 6. Eigenenergies (in eV and with respect to Γv
6) of wurtzite GaN, AlN and InN. Our calculations are evidenced by the asterisk.
All other values have been taken from the literature.
GaN AlN InN
Kv
1 −5.43*,[16],−5.37[44],−5.47[56],−5.6(−6.1)[28] −4.66*,−4.9(−5.6)[28] −5.00*,−5.1[24] Kv
3 −5.26*, −5.25[16], −5.29[44], −5.24[56],
−5.5(−6.1)[28] −
4.52*,−3.9(−4.5)[28] −4.93*,−4.9[24]
Kv
2 −3.37*, −3.44[16], −2.80[44], −2.85[56],
−3.0(−3.2)[28] −
2.90*,−2.5(−3.0)[28] −2.82*,−2.7[24]
Kv
3 −2.92*, −2.77[16], −3.02[44], −2.96[56],
−3.2(−3.5)[28] −
2.51*,−2.5(−2.9)[28] −2.57*,−2.6[24]
Kc2 6.35*, [57], 6.70[16], 4.93[44], 7.59[58], 4.9(6.6)[28],
6.6004[17], 5.74(6.97)[56], 6.97[59]
7.94*, 6.43[58], 6.29[57], 7.3[59], 7.0908[17], 4.8(6.7)[28]
5.18*
Mv1 −6.55*, −6.52[16], −6.56[44], −6.49[56],
−6.8(−7.4)[28] −
5.63*,−5.6(−6.3)[28] −5.46*,−6.0[24]
Mv
3 −5.61*, −5.59[16], −5.35[44], −5.32[56], −5.6(−6.1)[28]
−4.82*,−4.3(−4.9)[28] −4.65*,−5.0[24]
Mv
1 −4.09*, −3.88[16], −4.25[44], −4.18[56],
−4.4(−4.9)[28] −
3.52*,−3.4(−4.0)[28] −4.29*,−4.0[24]
Mv
2 −2.79*, [16],−2.57[44],−2.75[56],−2.8(−3.1)[28] −2.40*,−2.2(−2.6)[28] −2.68*,−2.6[24] Mv3 −2.15*, −2.01[16], −2.29[44], −2.14[56],
−2.4(−2.6)[28] −
1.85*,−1.8(−2.1)[28] −2.41*,−2.0[24]
Mv
4 −1.09*, −1.12[16], −0.88[44], −0.93[56], −1.0(−1.1)[28]
−0.94*,−0.7(−0.9)[28] −0.91*,−1.0[24]
Mc1 5.43*, 5.49[16], 6.5777[17], 5.02[44], 5.94[57],
5.22(6.45)[56], 5.1(6.5)[28], 7.35[58], 6.45[59]
7.39*, 7.03[58], 6.82[57], 7.62[59], 7.7826[17], 5.5(7.4)[28]
3.52*
Av
1,3 −4.18*, −3.97[16], −4.06[44], −3.86[60],
−4.1(−4.6)[28] −
3.64*,−3.4(−3.9)[28] −4.30*,−3.8[24]
Av
5,6 −0.55*,[16],−0.49[44],−0.52[60],−0.5(−0.6)[28] −0.49*,−0.6(−0.7)[28] −0.56*,−0.5[24] Ac
1,3 5.37*, 5.31[16], 5.00[44], 5.58[60], 5.31[57],
4.6(6.1)[28], 6.46[58], 5.8915[17]
7.35*, 7.67[58], 7.78[57],
8.1610[17], 8.13[61], 9.06[62, 63],
6.1(8.3)[28]
3.39*
Hv
3 −5.98*, [60],−5.93[16],−6.22[44],−6.4(−7.1)[28] −5.14*,−5.0(−5.6)[28] −5.34*,−5.6[24] Hv1,2 −4.55*, −4.54[16], −4.35[44], −3.85[60],
−4.6(−4.9)[28] −
3.92*,−4.0(−4.6)[28] −3.67*,−3.8[24]
Hv
3 −1.43*, −1.40[16], −1.35[44], −1.36[60], −1.5(−1.6)[28]
−1.22*,−0.8(−1.0)[28] −1.78*,−1.5[24]
Hc3 7.62*, 7.89[16], 6.62[44], 7.47[57], 8.74[58],
6.6(8.3)[28], 8.5073[17]
8.71*, 9.19[58], 8.56[57], 9.6651[17], 10.38[61], 9.96[62, 63],
7.2(9.5)[28]
4.12*
Lv
1,3 −6.60*, −6.57[16], −6.75[44], −6.34[60], −7.0(−7.6)[28]
−5.70*,−5.7(−6.5)[28] −5.72*,−6.0[24]
Lv
2,4 −2.05*, −2.06[16], −1.84[44],−1.76[60],
−2.0(−2.2)[28] −
1.79*,−1.5(−1.8)[28] −2.07*,−1.9[24]
Lv
1,3 −2.00*, −1.95[16], −1.81[44], −1.71[60],
−2.0(−2.2)[28] −
1.72*,−1.4(−1.7)[28] −1.73*,−1.8[24]
Lc
1,3 5.52*, 5.66[16], 4.54[44], 5.53[60], 5.49[57],
4.4(6.0)[28], 6.71[58], 5.9506[17]
7.44*, 7.1549[17], 6.64[58],
7.82[63, 62], 6.6[57], 5.0(6.9)[28]
[image:7.595.52.541.251.795.2]by:
|g|2= (2π
a )
2[4
3(l
2+m2−ml) +3
8n
2] (12)
Therefore, the reciprocal lattice vectors in increasing or-der of the modulus are in units of (2π/a):
• g0≡(0,0,0) • g3
8 ≡(0,0,±1) • g1+1
3 ≡ (−1,−1,0), (−1,0,0), (0,−1,0), (0,1,0),
(1,0,0), (1,1,0)
• g1+1
2 ≡(0,0,±2) • g1+17
24 ≡ (±1,0,±1), (0,±1,±1), (−1,−1,−1),
(1,1,1), (−1,−1,1), (1,1,−1)
• g2+5
6 ≡ (0,±1,±2), (±1,0,±2), (−1,−1,−2),
(1,1,2), (−1,−1,2), (1,1,−2)
• g3+3
8 ≡(0,0,±3)
• g4 ≡ (1,2,0), (−1,−2,0), (2,1,0), (−2,−1,0),
(−1,1,0), (1,−1,0)
• g4+3
8 ≡ (1,−1,±1), (−1,1,±1), (1,2,±1),
(−1,−2,±1), (2,1,±1), (−2,−1,±1)
• g4+17
24 ≡ (0,±1,±3), (±1,0,±3), (−1,−1,−3),
(1,1,3), (−1,−1,3), (1,1,−3)
• g5+1
3 ≡(±2,0,0), (0,±2,0), (2,2,0), (2,2,0) • g5+1
2 ≡ (1,−1,±2), (−1,1,±2), (2,1,±2),
(1,2,±2), (−2,−1,±2), (−1,−2,±2)
• g5+17
24 ≡ (±2,0,±1), (0,±2,±1), (2,2,1),
(−2,−2,1), (2,2,−1), (−2,−2,−1)
• g6≡(0,0,±4) • g6+5
6 ≡ (±0,±2,±2), (±2,±0,±2), (2,2,2),
(−2,−2,2), (2,2,−2), (−2,−2,−2)
• g7+1
3 ≡ (±1,±0,±4), (±0,±1,±4), (−1,−1,−3),
(1,1,3), (−1,−1,3), (1,1,−3)
• g7+3
8 ≡ (−1,1,±3), (1,−1,±3), (2,1,±3),
(1,2,±3), (−2,−1,±3), (−1,−2,±3) . . .
We neglect the pseudopotential form factors correspond-ing to g0 and to g2 > (7 + 13)(
2π
a )
2. Besides, we can
easily verify that the term cos[2π(∆l6 +∆m6 +∆n4 )] cor-responding to the groups of vectorsg3
8,g3+38 andg4+38
is always null. This is the reason why the symmetri-cal (Ss(|∆g|)) and antisymmetrical (Sa(|∆g|)) struc-ture factors for these groups of vectors are always null.
Thus, only 12 groups of vectors remain for the cal-culation (g1+1
3, g1+12, g1+1724, g2+56, g4, g4+1724, g5+13,
g5+1
2, g5+1724, g6, g6+56, g7+13), which means 24
pseu-dopotential form factors: 12 symmetrical and 12 anti-symmetrical. In Table 5 are given the pseudopotential form factors for wurtzite GaN and InN that we recom-mend and that we used in our calculations. The values of the lattice constantsaandc that we used in the cal-culations are: a= 0.3189 and c = 0.5185 nm for GaN
[16, 64],a= 0.3110 andc= 0.4980 nm [65, 15] for AlN anda= 0.354 andc= 0.570 nm [16, 64] for InN.
Therefore, the diagonal elements of the matrix H are given by:
Hi,i= (
¯
h2
2m)|k+gi|
2 (13)
and the non-diagonal elements are given by:
Hi,j = Vscos(
∆l
6 + ∆m
6 +
∆n
4 ) cos(π∆nu) +iVacos(
∆l
6 + ∆m
6 + ∆n
4 ) sin(πu∆n)(14) As in the zinc blende structure, we have to choose a maximum value to limit the norm, given by (12), of the reciprocal vectors that are taken into consideration in the calculation. In our case, we have verified that the condition |g|2 <8(2π
a)
2 (corresponding to 135 vectors)
provides sufficiently accurate results. Using (13) and (14), we can calculate all the elements of the Hamilto-nian matrix whose diagonalization gives the eigenvalues of the electronic states corresponding to the vectorkof the Brillouin zone.
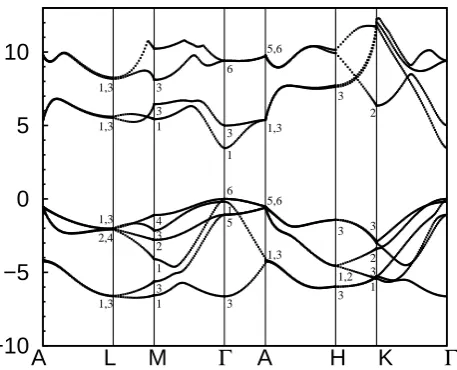
3.3
ResultsIn figures 8, 9 and 10, the energetic band structures obtained by our pseudopotential calculations are rep-resented for wurtzite GaN, AlN and InN respectively, along the high-symmetry points Γ, K, M, A, H andL
of the Brillouin zone.
−10
−5
0
5
10
Energy (eV)
1,3 2,4 1,3 1,3 1,3
1 3 1 2 3 4 1 3 3
3 5 1 6 1 3 6
1,3 5,6 1,3 5,6
3 1,2 3 3
1 3 2 3 2
[image:8.595.316.545.430.615.2]A L M
Γ
A H K
Γ
Figure 8. Band structure of wurtzite GaN obtained by our pseu-dopotential calculations.
From a qualitative point of view, the overall shape of the valence and conduction bands of wurtzite GaN and/or AlN is similar to that obtained by the calcula-tions performed by Yeo et al. [16], Fritsch et al. [18], Deibuk et al. [68], Al-Douri et al. [37], Goano et al.
[17], Foley et al. [19], Christensenet al. [57], Rubio et al. [28], Pughet al. [15], Wanget al. [38], Rezaeiet al.
[66]. The same occurs for wurtzite InN whose overall shape of the valence and/or conduction bands is similar to the reexamined band structures of Fritschet al. [23] and Kinget al. [24].
Table 7. Energy spacings, with respect to Γv
6, of wurtzite GaN, AlN and InN for the high-symmetry points Γ,L,M,H andK. Our
calculations are evidenced by the asterisk, while all other values have been taken from the literature. All values are in eV.
GaN AlN InN
Γc1−Γv6 3.45*, 3.5036[66], 3.503[67, 68],
3.44[57, 58], 3.6[69], 3.47(3.47)[18],
3.51[15], 3.5211[17], 3.36[38], 3.35[46],
3.65[59], 2.76[44], 2.89[48], 2.71[70],
3.0[43], 3.0[71, 72], 3.50[73, 74, 60, 16]
6.20*, 6.28[75, 63, 59], 6.2196[66], 6.24[15], 6.2[61, 62, 63], 5.8369[17],
6.11(6.11)citefritsch, 6.2 − 6.3[74],
4.84[58], 6.05[57], 5.84[17], 6.21[68],
6.20[76], 6.29[77], 4.64[70]
0.70*,
0.824(0.790)[23],
0.8[20, 22], 0.7[21]
Γv
6−Γv3 6.63*, 6.816[66], 8.0135[17],
6.94(6.97)[18], 7[78], 6.8[16], 6.78[60], 7.18[44], 7.21[79], 7.0[72]
6.70*, 6.2136[66], 6[80], 7.0061[17],
6.41(6.44)[18]
6.33*,
6.024(6.154)[23], 6.10[81]
Γv
5−Γv6 1.08*, 1.00(1.00)[18], 1.00[72] 0.92*, 1.03(1.04)[18] 1.03*,
1.022(1.037)[23]
Γv
6−Γc3 4.99*, 4.97[16], 4.68[60], 4.76[44],
5.8735[17]
7.92*, 8.2907[17] 2.81*
Γv
5−Γc3 6.07*, 5.96(5.96)[18], 5.28[68], 5.3[69],
5.9[72]
8.84*, 8.94(8.95)[18], 8.63[68], 8.92[76],
8.02[77]
3.84*,
3.581(3.602)[23]
Γv5−Γc6 10.48*, 10.74(10.74)[18], 11.1[72] 13.03*, 12.97(12.99)[18], 14.00[77] 10.15*,
9.822(9.859)[23]
Lv
2,4−Lc1,3 7.57*, 7.34[38], 7.29[69], 7.24[60],
7.57[16], 7.05[70]
9.23* 5.11*,
5.216(5.245)[23], 5.41[81]
Mv
4−Mc1 6.52*, 6.60[38], 6.07(6.07)[18], 7.0[46],
7.05[60], 6.61[16], 6.7[70]
8.33*, 7.87(7.88)[18] 4.43*,
4.522(4.556)[23]
Mv
4−Mc3 7.54*, 7.47[38], 7.68(7.68)[18], 7.3[60],
7.69[16], 7.25[70], 6.8[68], 7.0−7.1[69]
8.94*, 8.83(8.81)[18], 9.7[68] 5.12*,
5.101(5.134)[23]
Mv
2−Mc1 8.22*, 8.35[38], 7.9[46], 8.5[60], 8.26[16],
7.13[68], 7.0−7.1[69], 7.67(7.67)[18]
9.79*, 10.24[68], 8.21[76],
9.54(9.56)[18]
6.20*,
6.090(6.142)[23],
6.10[81]
Hv
3−Hc3 9.05*, 8.04[38], 8.4[60], 8.07(8.06)[18],
9.0[16]
9.93*, 10.91(10.10)[18], 10.39[77] 5.90*,
5.892(5.883)[23],
6.10[81]
Kv
2−Kc2 9.72*, 9.12[38], 8.68(8.68)[18], 9.0[46],
9.45[60], 10.1[16], 9.82[56], 8.3[72]
10.84*, 9.57(9.59)[18] 8.00*,
8.028(8.141)[23]
Kv
3−Kc2 9.27*, 9.08[38], 8.55(8.54)[18], 9.05[60],
9.43[16], 8.29[68], 8.3−8.7[69], 7.9[72]
10.45*, 9.43(9.43)[18], 10.84[68],
7.90[76]
7.75*,