Journal of Chemical and Pharmaceutical Research, 2012, 4(1):538-545
Research Article
CODEN(USA) : JCPRC5
ISSN : 0975-7384
Determination of vanillin in real samples using
Lysine modified carbon paste electrode
B. K. Chethana
a, S. Basavanna
b, Y. Arthoba Naik
a,*a
Department of Chemistry, School of Chemical Science, Kuvempu University, Shankaraghatta, India
b
Department of Chemistry, BTL Institute of Technology & Management, Bommasandra Industrial Area,
Bangalore, India
_____________________________________________________________________________________________
ABSTRACT
A new chemically modified electrode has been constructed based on Lysine modified carbon paste electrode (LCPE). The electrode was evaluated as sensor for sub-micromolar determination of vanillin. LCPE displayed excellent electrochemical catalytic activity towards vanillin. The oxidation peak of vanillin increased significantly compared to that of carbon paste electrode (CPE). The electrochemical behavior of vanillin at the surface of LCPE has been analyzed with respect to sweep rate and pH of the solution. An analytical procedure based on differential pulse voltammetry (DPV) has been optimized with a detection limit of 2.88 µM (S/N = 3). The proposed method has been successfully applied for the determination of vanillin in real samples, and the assay results were satisfactory.
Key words: Cyclic voltammetry, Differential pulse voltammetry, Vanillin, Carbon paste electrode, Lysine.
_____________________________________________________________________________________________
INTRODUCTION
Vanilla, being the world’s most popular flavoring materials, finds extensive applications in foods, beverages, perfumery and pharmaceutical drugs such as aldomet, L-dopa etc [1, 2]. Also it finds application as a preservative for soft drinks, corrosion inhibitor for metals and as a catalyst to polymerize methacrylate [3]. Vanillin is obtained from different species of plant genus vanilla (Orchidaceace), a tropical climbing orchid [4]. Out of the total 110 species only 3 species are find commercial importance. These are Vanilla planifolia, Vanilla tahitensis and Vanilla
pompona. However the commercial vanillin is obtained from Vanilla planifolia and Vanilla pompona [1]. The
aroma and flavor of vanilla extract is attributed mainly due to the presence of vanillin, which occurs in a concentration of 1.0 to 2.0% w/w in cured vanilla pods [1].
Vanillin (4-hydroxy-3-methoxybenzaldehyde) is a naturally occurring hindered phenolic compound derived from plant source and is capable to undergo three different types of reactions because of the aldehyde group, the phenolic hydroxyl group and the aromatic nucleus [5]. Most of the naturally occurring phenolic compounds exhibit antioxidant and pro-oxidant activity [6-9]. Antioxidants act by counteracting the oxidizing effects on lipids, proteins and DNA bases, by scavenging reactive oxygen species. Hence natural compounds with antioxidant activity have a potential as a good radio-protectors [10].
Chemically modified electrodes are extensively applied in the electrochemical determination of a wide variety of electroactive species as a sensitive and selective analytical method [18-20]. One of the most important properties of modified electrodes, in comparison to unmodified electrodes, has been their ability to catalyze the electrode process by a significant decrease in the necessary overpotential. With respect to the relatively selective interaction of the electron mediator with the target analyte, these electrodes are capable of considerably enhancing the selectivity in electroanalytical methods. Carbon electrodes have got advantages such as a wide potential window, low background current, chemical inertness and low cost that has resulted in their wide use in electrochemical detections. Carbon paste electrodes (CPEs) which are one of the most important types of carbon electrodes have been widely used for the electro-analysis of pharmaceutical formulations and drugs, since their introduction by Adams in 1958 [21]. The development of carbon paste electrodes in electrochemistry and electroanalysis has been recently reviewed on the occasion of their half-century anniversary. A particularly attractive advantage of chemically modified electrodes is the convenient renewal of the electrode surface [22-25]. The effective renewal is coupled with the reproducible pre-concentration and the robust electrode surface.
In the present work, a carbon paste electrode modified with Lysine was prepared for voltammetric determination of vanillin. Differential pulse voltammetry (DPV) was used to evaluate the analytical performance of the modified electrode in the real samples.
EXPERIMENTAL SECTION
2.1 Apparatus and reagents
Electrochemical measurements were performed with the help of CHI660D electrochemical work station (CH Instruments, USA) coupled with a conventional three electrode system. The carbon paste electrode (CPE) modified with L-Lysine was used as working electrode. A platinum wire and Ag/AgCl (3M KCl) were used as counter and reference electrodes, respectively.
All the chemicals were of analytical-reagent grade and used as received without any further purification. potassium ferricynide was purchased from Sigma-Aldrich. Vanillin was purchased from s.d. fine Chem. Ltd. India. All the solutions were freshly prepared with Millipore water. The 0.1M phosphate buffer solutions were prepared from potassium phosphate and pH of the solutions were adjusted by using H3PO4 or NaOH.
2.2 Preparation of Lysine modified carbon paste electrodes (LCPE)
The LCPE was prepared by mixing graphite powder, paraffin oil (mineral oil) and modifier in the ratio of 77:20:3 (w/w) and grinding the resultant mixture in a mortar for 30 minutes. The homogenized paste was packed carefully into the cavity at the end of a glass tube (3 mm inner diameter and height 6 cm) to avoid air gap which often enhance the electrode resistance. A copper wire was inserted inside the tube to establish electrical contact. For each reading, the external surface of the carbon paste was mechanically renewed and polished with weighing paper to get smooth and shiny surface. This operation was made before starting a new set of experiments. The CPE was prepared in the same way without the addition of modifier (Lysine).
RESULTS AND DISCUSSION
3.1 Electrochemical behavior of [Fe(CN)6]3-/[Fe(CN)6]4- couple
The electrochemical behavior of LCPE can be monitored via the redox behavior of [Fe(CN)6]
3-/[Fe(CN)6] 4-
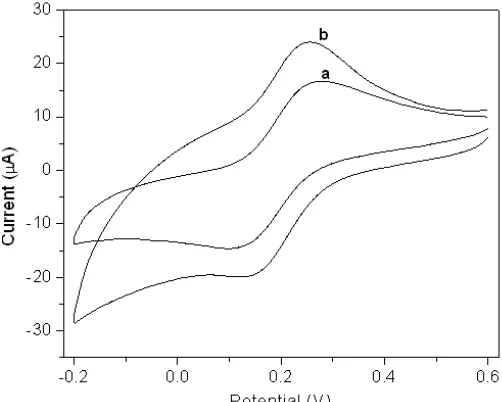
couple. Figure 1 shows cyclic voltammograms obtained at CPE and LCPE in 0.1M KCl containing 1mM K3[Fe(CN)6]. The
cyclic voltammograms of [Fe(CN)6]3-/[Fe(CN)6]4- couple show a peak to peak separation of 134mV at CPE and
110mV at LCPE. The reduction in peak to peak separation potential at LCPE clearly indicated the better performance of LCPE than that of CPE. From Figure 1 it can also be confirmed that the redox peak current of [Fe(CN)6]3-/[Fe(CN)6]4-couple is found to be high at LCPE in contrast to that of unmodified CPE.
The active surface area of the CPE and LCPE were obtained by the cyclic voltammetric method using 1 mM K3Fe(CN)6 as a probe at different scan rates. For a reversible process, the following Randles-Sevcik formula [26]
has been used, which is as given below.
Ip = (2.69 × 10 5
) n3/2 AD0 1/2
Co*υ1/2
where Ip refers to the anodic peak current, n is the number of electrons transferred, A is the surface area of the
electrode, D0 is diffusion coefficient, υ is the scan rate and Co* is the concentration of K3Fe(CN)6. For 1 mM
______________________________________________________________________________
[image:3.595.175.426.115.316.2]υ½, the surface area of the electrode can be calculated. In CPE, the electrode surface area was found to be 0.0416 cm2 and for LCPE, the surface area was nearly 2.0 times greater than that of CPE.
Fig. 1. Cyclic voltammograms of 1mM K3[Fe(CN)6] in 0.1M NaCl on (a) CPE and (b) LCPE. Scan rate 50mVs-1
3.2 Cyclic voltammetric determination of vanillin
Figure 2A shows the cyclic voltammograms of vanillin at CPE and LCPE in 0.1M phosphate buffer of pH 7.0. The oxidation of vanillin at LCPE occurred at 0.95 V, with an enhanced anodic peak current (~1.6 times) compared to that of CPE. A small negative shift in the oxidation potential (~0.06V) of vanillin could be explained on the basis of electrostatic interaction between vanillin and the modified electrode. On the reverse scan, no corresponding reduction peak was observed, indicating that the electrochemical oxidation of vanillin is an irreversible process. Nevertheless, it was found that the oxidation peak current of vanillin showed a remarkable decrease during the successive cyclic voltammetric sweeps (Figure 2B). The first cycle shows large increase in the oxidation peak current and in the subsequent scans the peak height has been decreased due to the fouling of electrode surface by the oxidation product of vanillin. Therefore, the voltammograms corresponding to the first cycle was generally recorded.
Fig. 2. (A) Cyclic voltammograms of 5mM of vanillin on CPE (a) and LCPE (b) in 0.1M PBS pH 7.0; Scan rate: 10 mVs-1. (B) Successive cyclic voltammograms of 5mM vanillin on LCPE in 0.1M PBS pH 7.0; scan rate 50mVs-1.
3.3. Influence of scan rate
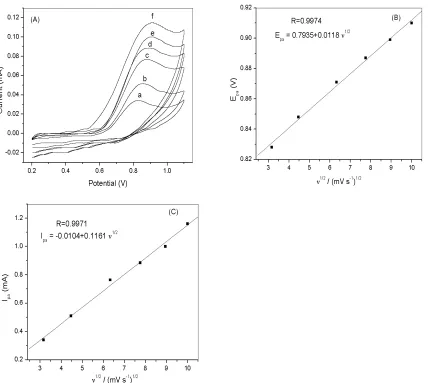
Useful information involving electrochemical mechanism can usually be acquired from the relationship between the peak current and scan rate. Therefore, the effect of scan rate (ν) on the oxidation of vanillin was investigated. Figure 3A shows cyclic voltammograms of 5mM vanillin at LCPE with different scan rates in 0.1M phosphate buffer solution. As the scan rate increases, the Ipa has increased and Epa has shifted slightly to the positive direction. The
increase of peak current is derived by the decrease of a diffusion layer thickness on an electrode during the scan. The values of Epa (Fig. 3B) and Ipa (Fig. 3C) have been increased linearly with the square root of scan rate, ν
1/2
[image:3.595.82.516.467.628.2]range 10–100mVs−1. These results indicated that the oxidation process of vanillin in phosphate buffer solution (pH 7.0) on LCPE is a diffusion-controlled process [27].
Fig. 3. A) Cyclic voltammograms of 5mM vanillin on LCPE at different scan rates, a →→→→f : 10, 20, 40, 60, 80 and 100 mVs-1 in 0.1M phosphate buffer solution, pH 7.0. B) The variation of the peak potential, Epa vs. νννν1/2. C) Dependence of the anodic
peak current Ipa, on νννν1/2 for the oxidation of vanillin at the surface of LCPE obtained from data of Figure 3A.
3.4 Differential pulse voltammetric (DPV) determination of vanillin
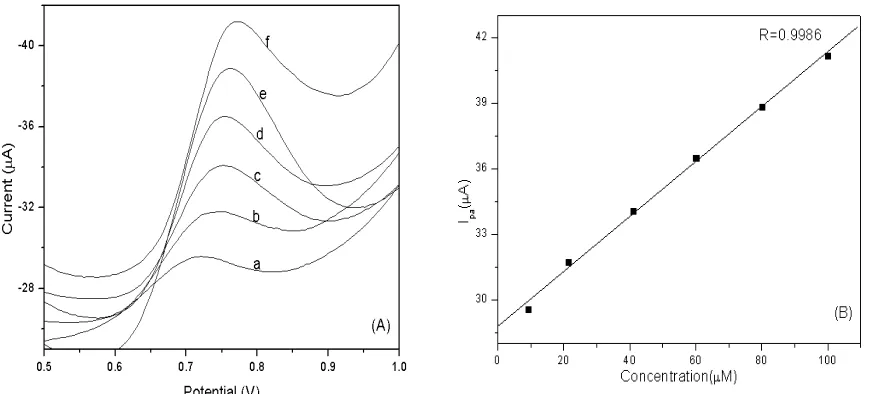
Since the differential pulse voltammetry has a much higher current sensitivity and better resolution than cyclic voltammetry, it was used in the determination of vanillin concentration and the estimation of the lower limit of detection at LCPE. The oxidation peak current of vanillin at LCPE was measured in 0.1M Phosphate buffer solution of pH 7.0, and plotted against the bulk concentration of vanillin. As shown in Fig. 4, the dependence of the peak current on the concentration of vanillin is in a linear relationship in the range of 10 to 100 µM. The linear regression equation is expressed as Ipa (µM) = 0.1305C (µM) + 2.8036, R = 0.9967. The detection limit (S/N=3) is 2.88 µM.
The relative standard deviation of the same electrode in 10 successive scans is 3.5% for 40 µM vanillin indicated that the LCPE had an excellent reproducibility. All the results indicated the analytical applicability of LCPE for the determination of vanillin in real samples.
3.5 Effect of pH
Effect of pH on the oxidation of vanillin at LCPE was investigated by cyclic voltammetry in Mcllvanie’s buffer (mixture of 0.2M Na2HPO4 and 0.1M Citric acid). No significant changes in peak currents were observed below pH
[image:4.595.75.506.109.492.2]______________________________________________________________________________
Fig. 4. (A) Differential pulse voltammograms of solutions containing various concentrations of Vanillin, a →→→→f: 10, 20, 40, 60, 80 and 100µM. Supporting electrolyte in all measurements was 0.1M phosphate buffer with pH7.0 B) Dependence of the anodic peak current Ipa, on concentration for the oxidation of vanillin at the surface of LCPE obtained from data of
[image:5.595.80.519.81.278.2]Figure 4A.
Fig. 5. Variation of anodic peak potential (A) and peak current (B) with the pH of buffer solution at the modified electrode in the sweep rate of 10mVs−1 and presence of 5mM Vanillin.
Figure 5B shows that the oxidation peak potentials of vanillin shifted to negative direction with increase in pH from 3.0 to 8.0. The variation of Epa with pH follows the typical oxidation behavior of phenols. The linear dependence of
peak potential with a pHindicates that the protons are directly involved in the oxidation of vanillin. At higher pH deprotonation of the hydroxyl group of the vanillin is favored. The peak potential (Epa) obeys the following
equation: Epa (V) = −0.073 pH + 1.12 versus Ag/AgCl (R = 0.9818). The dEpa/dpH value of 0.073V/pH indicates
that equal number of protons and electrons are involved in the oxidation process of vanillin.
3.6 Real sample analysis
In order to evaluate the applicability of the proposed method to the real sample analysis, the determination of vanillin in Vanilla planifolia extract (VPE) and commercial vanilla flavor (CFV) sample has been undertaken.
[image:5.595.80.514.347.531.2]that the Vanilla planifolia pods contain 1.17% of vanillin and these results are comparable with the literature value [3, 32-34].
[image:6.595.168.442.197.484.2]Commercial vanilla flavor sample was purchased from Venkateswara fine chem. laboratory, Bangalore, India and it contains vanillin as the major ingredient. About 0.1 mL of commercial vanilla sample was added to 10 mL of phosphate buffer (pH 7.0) and stirred for 10 minutes at room temperature. The resultant solution was taken for DPV studies. It was found that, commercial vanilla sample contains 4.9 % of vanillin which is in good agreement with the reported value [35].
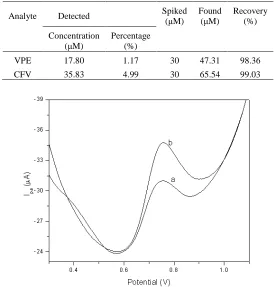
Table 1. Determination of vanillin present in real samples
Analyte Detected Spiked
(µM)
Found (µM)
Recovery (%)
Concentration (µM)
Percentage (%)
VPE 17.80 1.17 30 47.31 98.36
CFV 35.83 4.99 30 65.54 99.03
Fig. 6. DPV graphs for the detection of (a) Vanilla planifolia extract (VPE) (b) after addition of 30 µM vanillin at LCPE in 0.1 M phosphate buffer solution of pH 7.0
3.7 LC-MS Studies
LC-MS studies were carried out for the synthetic vanillin, vanillin present in the commercial sample and Vanilla
planifolia. Figure 7 represents the LC-MS spectrum of synthetic vanillin. The retention time was observed at 14.35
min and mass peak at 152.15 (m/z) on BDS HYPERSIL C18 column. In Figure 8, the peaks observed at 14.00 min and 14.50 min correspond to the retention times of vanillin present in Vanilla planifolia and commercial vanilla flavor, respectively.
A small shift in the retention time in case of real samples is attributed to the presence of other ingredients, such as proteins and carbohydrates. These results confirmed the presence of vanillin in the commercial vanilla flavor and
Vanilla planifolia extract.
CONCLUSION
______________________________________________________________________________
[image:7.595.122.488.397.696.2]Fig. 7. LC-MS spectra of synthetic vanillin eluted from BDS HYPERSIL C18 column methanol and water solvent
Fig. 8. Liquid chromatographs of (A) Vanilla planifolia extract and (B) commercial flavored vanillin eluted from BDS HYPERSIL C18 column methanol and water solvent.
(A
)
Acknowledgement
The authors are grateful to the Department of Science and Technology, New Delhi, India for providing financial assistance. The authors wish to thank Kuvempu University, Shankaragatta, India for providing laboratory facilities to carry out this work. The authors are thankful to Prof. K.J. Rao and Dr. H.N. Vasan, SSCU, Indian Institute of Science, India for their encouragement and useful discussions.
REFERENCES
[1] A.K. Sinha, K.U. Sharma, N. Sharma, Int. J. Food Sci. Nutr. 2008, 59, 299-326. [2] J.N. Walton, J.M. Mayer, A. Narbad, Phytochemistry 2003, 63, 505-515. [3] A.Y. El-Etre, Corr. Sci. 2001, 43, 1031-1039.
[4] I. Mourtzinos, S. Konteles, N. Kalogeropoulos, V.T. Karathanos, Food chem. 2009, 114, 791-797. [5] H.S. Mahal, L.P. Badheka, T. Mukherjee, Res.Chem.Intermed. 2001, 27, 595-604.
[6] A. Simic, D. Manoklovic, D. Segan, M. Todorovie, Molecules 2007, 12, 2327-2340.
[7] N. A. Zakaria, D. Ibrahim, S. F. Sulaiman, N. A. Supardy, J. Chem. Pharm. Res. 2011, 3,182-191. [8] S. Mandal, S.Yadav, S. Yadav, R. K. Nema, J. Chem. Pharm. Res. 2009, 1, 102-104.
[9] L. V.B. Hoelz, B. A.C. Horta, J. Q. Araujo, M. G. lbuquerque, R. B. de lencastro, Joaquim F. M. da Silva, J.
Chem. Pharm. Res. 2010, 2, 291-306.
[10] D.K. Maurya, S. Adhikari, C.K.K. Nair, P.A.T. Devasagayam, Mut. Res. 2007, 634, 69-80. [11] Y. Ni, G. Zhang, S. Kokot, Food Chem. 2005, 89, 465-473.
[12] A.A. de Lima, E.M. Sussuchi, W.F. De Giovani, Croat. Chem. Acta 2007, 80, 29-34. [13] N.G. Tsierkezos, J. Solution chem. 2007, 36, 289-302.
[14] M. Luque, E. Luque-perez, A. Rios, M. Valcarcel, Anal. Chim. Acta 2000, 410, 127-134.
[15] L. Agui, J.E. Lopez, A. Gonzalez-Cortes, P. Yanez-Sedeno, J.M. Pingarron Anal. Chim. Acta 1999, 385, 241-248.
[16] J.L. Hardcastle, C.J. Paterson, R.G. Compton, Electroanalysis 2001, 13, 899-905. [17] F. Bettazzi, I. Palchetti, S. Sisalli, M. Mascini, Anal. Chim. Acta 2006, 555, 134-138. [18] Y. Zhang, Y. Liu, X. Ji, C.E. Banks, W. Zhang, J. Mater. Chem. 2011, 21, 7552-7562.
[19] J. Petrlova, S. Krizkova, V. Supalkova, M. Masarík , V. Adam, L. Havel, K.J. Kramer, R. Kizek, Plant Soil
Environ. 2007, 53, 345-349.
[20] R.H. Patil, R.N. Hegde, S.T. Nandibewoor, Colloids Surf. B 2011, 83, 133-138. [21] R.N Adams, Anal. Chem 1958, 30, 1576-1581.
[22] C. Li, Colloids Surf. B 2007, 55, 77-83.
[23] L.P. Souza, F. Calegari, A.J.G. Zarbin, L.H. Marcolino-Jnior, M.F. Bergamini, J. Agric. Food Chem. 2011, 59, 7620-25.
[24] M. Aklilu, M. Tessema, M. Redi-Abshiro, Talanta 2008, 76, 742-746.
[25] T. Sheela, S. Basavanna, R. Viswanatha, H.C.B. Kalachar, Y.Arthoba Naik. Electroanalysis 2011, 23, 1150-1157.
[26] B. Rezaei, S. Damiri, Sens. Actuators, B: Chem. 2008, 134, 324-331.
[27] F. Belal, A. Al-Majed, S. Julkhuf, J. Pharmaceut. Biomed. Anal. 2003, 31, 989-998. [28] Z. Wang, K. Chen, J. Li, Q. Wang, J. Guo, Clean 2010, 38, 1074-1079.
[29] Q. Xu, S.F. Wang, Microchim. Acta 2005, 151, 47-52.
[30] H.C.B. Kalachar, S. Basavanna, R. Viswanatha,Y. Arthoba Naik, D. Ananda Raj, P. N. Sudha, Electroanalysis
2011, 23, 1107-1115.
[31] Frenkel, D.H. Frenkel, Perfumer Flavorist 2006, 31, 28-36.
[32] L.J. Esposito, K. Formanek, G. Kientz, F. Mauger, V. Maureaux, G. Robert, F. Truchet, Kirk-Othmer,
Encyclopedia of Chemical Technology (fourth ed.), John Wiley Sons, New York (1997) 812.
[33] R.S. Rao, G.A. Ravishankar, J. Sci. Food Agric. 2000, 80, 289-304.