Journal of Chemical and Pharmaceutical Research
__________________________________________________
ISSN No: 0975-7384 CODEN(USA): JCPRC5
J. Chem. Pharm. Res., 2011, 3(4):937-944
Development and Validation of HPLC Method for Quantification of
Phytoconstituents in Phyllanthus emblica
Laxman Sawant1,*, Bala Prabhakar1, Anil Mahajan2, Nandini Pai2, Nancy Pandita1
1
School of Pharmacy & Technology Management, SVKM’s NMIMS, Vile Parle (W), Mumbai, India
2
Department of Chemistry, D. G. Ruparel College, Mahim, Mumbai, India
_______________________________________________________________________________
ABSTRACT
A high performance liquid chromatography method coupled with diode array detection was developed to simultaneously determine eight different marker compounds in Phyllanthus emblica. These markers are ascorbic acid (1), gallic acid (2), methyl gallate (3), chlorogenic acid (4), ethyl gallate (5), ellagic acid (6), rutin (7) and chebulagic acid (8). HPLC analysis was carried out at wavelength 272nm. The developed method was able to determine the marker compounds with excellent resolution, precision and recovery. The chromatographic separation was performed on Thermo Scientific BDS HYPERSIL Phenyl reversed-phase column (250mm×4.6mm, 5µm). The mobile phase was consisted of 0.1% ortho-phosphoric acid: Methanol (95:05v/v) (A) and acetonitrile (B) at a flow rate of 1.5 ml/min gradient mode. Regression equations showed good linear relationships (R2 > 0.998) between the peak area of each marker and concentration. The assay was reproducible with overall intra- and inter-day variation of less than 3.4%. The recoveries, measured at three concentration levels, varied from 97.8% to 101.1%. The method was applied to determine the amounts of the marker compounds in dried fruits of Phyllanthus emblica, and significant variations in phytoconstituents were observed.
several biochemical events associated with tumor promotion such as alteration of protein kinase C (PKC) activity (5). It is a rich dietary source of vitamin C, minerals, flavonoids and amino acids, and also contains a wide variety of phenolic compounds, such as tannins, phyllembelic acid, phyllemblin, rutin, curcuminoides, mucic acid, and emblicol (6-10). Scartezzini et al. proposed a reliable HPLC-DAD for the identification and quantification of ascorbic acid and further indicated that high antioxidant activity is due to a large percentage of the presence of ascorbic acid (11).
Reversed-phase high-performance liquid chromatography (RP-HPLC) is the commonly used analytical separation technique for either phenolic compounds like flavonols or for various derivatives of benzoic acid. Due to the variability of column filling materials and solvent systems, RP-HPLC exhibits a great potential in separating complex mixtures of phenolic compounds [12–18].
The purpose of this study was to develop a novel high-performance liquid chromatography procedure for simultaneous determination of all eight phytoconstituents in the fruits of
Phyllanthus emblica Linn.
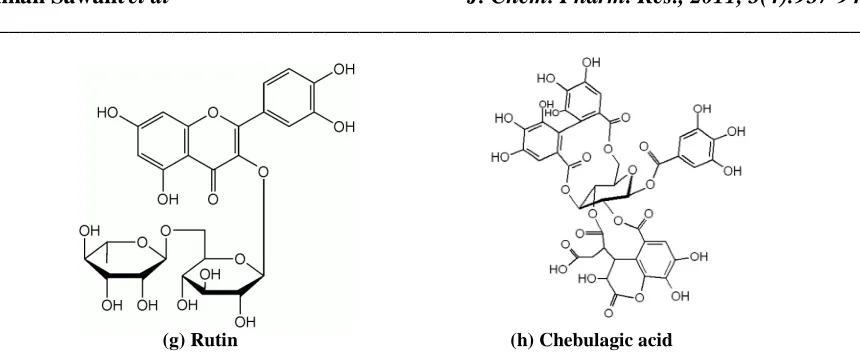
(a) Ascorbic acid (b) Gallic acid (c) Methyl gallate
[image:3.595.89.519.80.262.2]
(g) Rutin (h) Chebulagic acid
Fig. 1. Structures of phytoconstituents in Phyllanthus emblica
EXPERIMENTAL SECTION
Chemicals and materials:
The chemicals used were analytical or HPLC-grade. HPLC-grade acetonitrile, methanol, ortho-phosphoric acid (AR grade) were purchased from Merck specialty India Pvt. Ltd. Ultra pure water, generated by use of a Milli-Q System (Millipore), was used for sample preparation and preparation of mobile phases for HPLC analysis. Dried and fresh fruits of Phyllanthus emblica were procured from local market in Mumbai, India and authenticated at Agharkar Research Institute Pune, India, with a voucher specimen (F-140) which deposited in the herbarium. Standard compounds ascorbic acid (1), gallic acid (2), chlorogenic acid (4), ellagic acid (6), rutin (7) were purchased from Sigma Aldrich. Other standard compounds such as methyl gallate (3), ethyl gallate (5) and chebulagic acid (8) were isolated from the dried fruit of the Phyllanthus
emblica Linn. (Euphorbiaceae).
Sample preparation
The accurately weighed dried fruits powder (0.2 g) was transferred in 50ml volumetric flask contains 30ml extraction solvent (methanol–water (70:30, v/v) and sonicated for 20 min at 27±3°C in ultra sonicator water bath and diluted up to mark. The fruits (1kg) were cut into pieces, and expressed to get juice at room temperature for 2 h with stirring. The filtered juice was freeze-dried (Freezone 4.5, Labconco, USA) under high vacuum (133 × 104 mBar) at −40 ± 2°C. to get dry powder. The freeze-dried powder (100 mg) was extracted overnight, with 10 ml methanol. The solutions of dried fruits (AM-D) and fresh fruits (AM-L) were filtered through a 0.45-µm membrane prior to injection into the HPLC system.
Chromatographic condition
Fig.2. HPLC chromatograms of (a) standard mixture: ascorbic acid (1), gallic acid (2), methyl gallate (3), chlorogenic acid (4), ethyl gallate (5), ellagic acid (6), rutin (7) and chebulagic acid (8). (b) Phyllanthus
emblica dried fruits (AM-D) (c) Phyllanthus emblica fresh fruits (AM-L).
Table.1 Method validation data (Linearity, LOD & LOQ)
Phytoconstituent RT R2 Linear range LOD LOQ (min) (µg/ mL) (µg/ mL) (µg/ mL) Ascorbic acid 2.38 0.999 90-240 0.7 2.331
Gallic acid 3.51 0.998 40-140 0.6 1.998
Methyl gallate 8.41 0.999 5-30 0.5 1.665
Chlorogenic acid 12.80 0.999 20-45 0.4 1.332
Ethyl gallate 13.98 0.998 5-30 0.5 1.665
Ellagic acid 21.90 0.999 30-80 0.6 1.998
Rutin 22.58 0.999 20-45 0.4 1.332
Chebulagic acid 23.36 0.999 100-350 0.5 1.665
RESULTS AND DISCUSSION
Extraction procedure
Various extraction methods, solvents and times were evaluated to obtain the best extraction efficiency. The results revealed that ultrasonic bath extraction was better than other extraction methods, so the further experiments were carried out with ultrasonic bath extraction. Various solvents including water, methanol–water (50:50 v/v; 60:40 v/v; 70:30 v/v; 80:20 v/v) and methanol were screened. Methanol–water (70:30 v/v) exhibited complete extraction of all the major constituents. No second extraction step was found necessary.
Phytoconstituent Recovery a Precision (RSD%) (%) Intra-day b inter-day c
Ascorbic acid 100.48 1.3 2.2
Gallic acid 99.63 1.6 1.4
Methyl gallate 101.47 2.4 2.2
Chlorogenic acid 99.24 2.3 2.6
Ethyl gallate 98.96 2.5 2.1
Ellagic acid 100.40 1.5 2.6
Rutin 99.78 2.2 2.7
Chebulagic acid 100.45 2.1 2.8
[image:6.595.173.423.246.375.2]b mean ofsamples were analysed on same day n=6
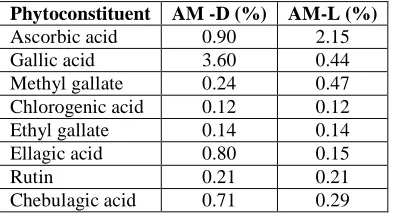
Table.3 Quantification of Phytoconstituents in Phyllanthus emblica
Phytoconstituent AM -D (%) AM-L (%)
Ascorbic acid 0.90 2.15
Gallic acid 3.60 0.44
Methyl gallate 0.24 0.47
Chlorogenic acid 0.12 0.12
Ethyl gallate 0.14 0.14
Ellagic acid 0.80 0.15
Rutin 0.21 0.21
Chebulagic acid 0.71 0.29 Sample analysis
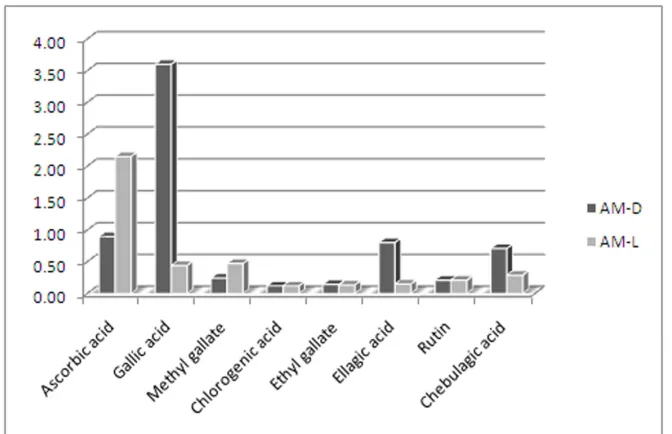
The method was applied to simultaneous determination of phytoconstituents (1-8) in dried fruits of Phyllanthus emblica collected from market. Representative chromatograms are shown in Figure. 2. The contents of the eight compounds in the samples were quantified and the results are shown in Table 3 with the mean values of three replicate injections. Variations of the eight compounds content in the fruits of Phyllanthus emblica are shown in histogram Figure 3
Accuracy
[image:6.595.201.398.415.523.2]Precision
[image:7.595.131.467.265.482.2]The precision of an analytical procedure expresses the closeness of agreement between a series of measurements obtained from multiple sampling of the same homogeneous sample under the prescribed conditions. The intra and inter-day precisions were determined by analyzing known concentrations of the seven analytes in six replicates during a single day and by duplicating the experiments on two successive days. In order to confirm the repeatability, six different working solutions prepared from the same sample obtained from different manufacturers were analyzed. The relative standard deviation (R.S.D.) was taken as a measure of precision and repeatability. The results are shown in Table 2, indicating that the intra-, inter-day and repeatability R.S.D. values of the eight compounds were all less than 3.5%, which showed good reproducibility of the developed method.
Fig.3. Histogram presenting phytoconstituents contents in Phyllanthus emblica samples.
Linearity
Standard stock solutions containing ascorbic acid, gallic acid, methyl gallate, chlorogenic acid, ethyl gallate, ellagic acid, rutin and chebulagic acid were prepared and diluted to appropriate concentrations for plotting the calibration curves. At least six concentrations of the analyte solutions were analyzed in triplicate, and then the calibration curves were constructed by plotting the mean peak areas versus the concentration of each analyte. The calculated results are given in Table 1. All the analytes showed good linearity (R2 > 0.998) in a relatively wide concentration range.
Limits of detection and quantification
CONCLUSION
In this study, an HPLC–DAD method for the qualification and quantification of phtyoconstituents in Phyllanthus emblica has been developed. The possible reasons for variations are the how the materials processed, polarity of the solvents used for extraction and thermal stability of phytoconstituents. This method is validated for good accuracy, repeatability and precision, and can be used to evaluate the quality of the drug. This multi-phytoconstituents assay method will be helpful to quality control and stability studies of Phyllanthus emblica.
REFERENCES
[1] YJ Zhang; T Tanaka; Y Iwamoto; CR Yang; I Kouno. Tetrahedron Lett., 2000, 41, 1781– 1784.
[2] J Ahmad; Z Mehmood; F Mohammad. J. Ethnopharmacol., 1998, 62, 183–193. [3] JB Calixto, ARS Santos, Filho VC, RA Tunes. J. Med. Biol., 1998, 31, 225-228. [4] JK Jose, Y Kuttan, R Kutan. J. Ethnopharmacol., 2001, 75, 65–69.
[5] L Anila and NR Vijayalakshmi. Food Chem., 2003, 83, 569–574.
[6] KJ Jeena, G Kuttan, J George, R Kuttan. J. Clin. Biochem. Nutr., 1996. 22, 171–176. [7] YJ Zhang, T Abe, T Tanaka, CR Yang. I Kouno. J. Nat. Prod., 2001, 64, 1527–1532. [8] YJ Zhang, T Tanaka, CR Yang, I Kouno. Pharm. Bull., 2001, 49, 537–540.
[9] M Majeed, B Bhat, A Jadhav, J Srivastava, K Nagabhushanam. J. Agric. Food Chem., 2009, 57, 220–225.
[10]S Ghosal, VK Tripathi, S Chauhan. Indian J. Chem., 1996, 35B, 941–948.
[11]P Scartezzini, F Antognoni, MA Raggi, F Poli, C Sabbioni. J. Ethnopharm., 2006, 104, 113–118.
[12] XG He, LZ Lian, LZ Lin. J. Chromatogr. A., 1997, 757, 81–87.
[13]U Justesen, P Knuthsen, T Leth. J. Chromatogr. A., 1998, 799, 101–110.
[14] A Crozier, E Jensen, MEJ Lean, MS McDonald. J. Chromatogr. A., 1997, 761, 315–321. [15]M Keina¨nen, R Julkunen-Tiitto. J. Chromatogr. A., 1998, 793, 370–377.
[16]A Escarpa, MC Gonza´les. J. Chromatogr. A., 1998, 823, 331–337.
[17]M Brolis, B Gabetta, N Fuzzati, R Pace, F Panzeri, F Peterlongo. J. Chromatogr. A., 1998, 825, 9–16.