www.hydrol-earth-syst-sci.net/14/1963/2010/ doi:10.5194/hess-14-1963-2010
© Author(s) 2010. CC Attribution 3.0 License.
Earth System
Sciences
Modelling the hydrologic response of a mesoscale Andean watershed
to changes in land use patterns for environmental planning
A. Stehr1, M. Aguayo1, O. Link2, O. Parra1, F. Romero3, and H. Alcayaga3
1Environmental Research Center EULA-Chile, Universidad de Concepci´on, Concepci´on, Chile 2Civil Engineering Department, Universidad de Concepci´on, Concepci´on, Chile
3National Water Agency, Ministerio de Obras P´ublicas, Chile
Received: 15 April 2010 – Published in Hydrol. Earth Syst. Sci. Discuss.: 18 May 2010 Revised: 24 September 2010 – Accepted: 29 September 2010 – Published: 15 October 2010
Abstract. A multidisciplinary approach is followed for
anal-ysis of the effect of changes in land use patterns on the hydro-logic response of the Vergara watershed (4340 km2) located in central Chile. Probable future land use scenarios were gen-erated using heuristic rules and logistic regression models, in order to identify and represent the main pressure on the wa-tershed, namely forestation of extensive areas used for agri-culture with rapid growing exotic species. The hydrologic response of the watershed was computed with a physically based distributed precipitation-runoff model, which was cali-brated and validated for the current period. Results show that mean annual discharge increase with agricultural land use and diminish with introduced forest coverage. Thus, foresta-tion of areas with introduced species like Pinus radiata and Eucalyptus globulus might be regulated in order to protect the water resources of the watershed.
1 Introduction
Water is essential for human life and welfare, and its demand is increasing. Many people worldwide are already living in conditions of water scarcity, and with increasing concentra-tion of populaconcentra-tion in urban areas, future water supply and availability is a globally sensitive issue (Jenerette and Larsen, 2006). Provision of clean water, as an essential ecosystem service, is a crucial factor in watershed/catchments manage-ment (Mark and Dickinson, 2008). Land use and climate changes introduce additional complexity in the management
Correspondence to: A. Stehr ([email protected])
process. A challenging issue for countries with emerging and developing economies, like Chile, where ecosystem ser-vices are becoming increasingly vulnerable as demand in-crease and environment degrade is the generation of scientific information in order to support political decisions on devel-opment of environmental relevant projects. Such informa-tion can arise from extensive and time consuming centralized monitoring programs, but also complementarily from appli-cation modelling tools. Typically, mesoscale watersheds in the Southern Hemisphere represent a challenging manage-ment problematic: developmanage-ment of land use planning instru-ments considering the conservation of the native forest and the water availability for economic activities, recreation and human consumption.
Tendencies and extent of water yield affected by land use patterns depends on the particular study case. Land use changes modify interception and infiltration affecting surface runoff and groundwater flows (Sahin and Hall, 1996; Costa et al., 2003; Foley et al., 2005). Thus, combined with other biogeophysical properties of the land such as texture, relief, and soil types, land use controls the availability of water for its different uses e.g. irrigation and drinking water (Postel et al., 1996; Vitousek et al., 1997; Bronstert et al., 2002; Naef et al., 2003).
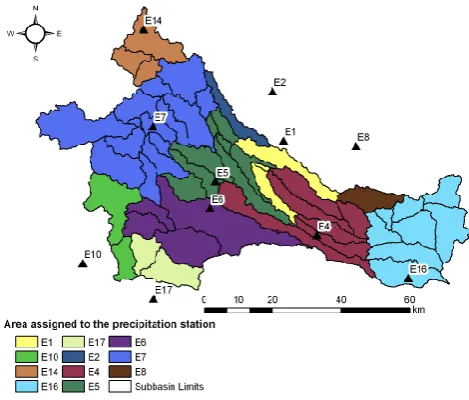
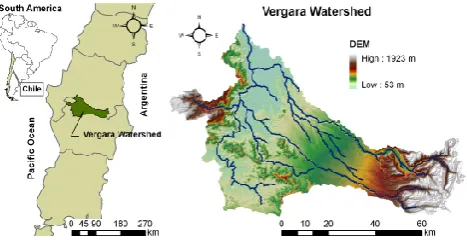
Fig. 1. Location of the Vergara watershed and DEM.
The processes dominating watershed hydrological re-sponse differ at various spatial scales. In micro-scale catch-ments (smaller than ca. 1 km2)response to rainfall is dom-inated mainly by the runoff generating processes at the hill slopes and the near-stream areas (Anderson and Burt, 1990; Montgomery and Buffington1997). In macro-scale water-sheds (larger than 104km2)spatio-temporal distribution of precipitation, drainage pattern and runoff control to a con-siderable extend the response behaviour (Uhlenbrook et al., 2004). Heterogeneous land use in large watershed intro-duces additional complexities for modelling the water bal-ance (Wilk et al., 2001). Kl¨ocking and Hamberlandt (2002) stated that land use changes affect the hydrologic response of large watershed at the subbasin scale, and thus the inter-action between the different subbasins plays a key role in the behaviour of the watershed. Even when the hydrologic re-sponse of small watersheds (<10 km2)has been extensively documented in previous studies (Bosch and Hewlett, 1982; Sahin and Hall, 1996; Stednick, 1996; Brown et al., 2005), and the response to land use changes of large scale basins have been documented for the Northern Hemisphere (Thana-pakpawin et al., 2007; Hejazi and Moglen, 2008; Breuer and Huisman, 2009; van Roosmalen et al., 2009) a lack of stud-ies on the response of mesoscale basins located in the South-ern Hemisphere is detected (Costa et al., 2003; Croke et al., 2004).
[image:2.595.309.546.62.231.2]The relationships between the different components of the hydrological cycle and their sensitivity to changes in land uses can be quantified applying physicaly based hydrologic models (Lahmer et al., 2001; Fohrer et al., 2001; Klock-ing et al., 2002; Eckhardt et al., 2003; Ott and Uhlenbrook, 2004). In particular, SWAT (Neitsch et al., 2002) allows the computation of hydrologic flows for long term analysis following a semi-distributed approach (Arnold et al., 1998; Fohrer et al., 2001, 2005; Arnold and Fohrer, 2005). Ap-plications of SWAT for modelling watersheds located in the Northern Hemisphere have derived in well known recom-mended ranges of the involved parameters (Arnold et al., 1995; Arnold and Allen, 1999; Fontaine et al., 2002; Liu et al., 2002; Kannan et al., 2003; Van Liew et al., 2005; Muleta and Nicklow, 2005). For central Chile, Pe˜na et al. (1985)
Fig. 2. Soil types in the Vergara watershed.
and Escobar and Vidal (1992) made some considerations on previous recommended ranges for the particular study cases. In this contribution the hydrologic response of the Vergara watershed to different probable future scenarios of land use was analysed through the annual mean discharge applying the physically based hydrologic model SWAT. The land use scenarios were generated using heuristic rules and the logis-tic regression model. First, the study area, available hydrom-eteorological records, and methods for land use analysis and hydrologic flows computation are presented. Next, the model sensitivity analysis, calibration and validation are presented. Finally, simulation results are analysed in order to suggest adequate guidelines for watershed management.
2 Study area
The Vergara watershed (4340 km2)is located between the parallels 37◦290 and 38◦140 and 71◦360–73◦200. The river is 154 km long and emerges at an elevation of about 1900 m a.s.l. It flows into the Biob´ıo river near the city of Nacimiento at an altitude of 200 m a.s.l. Its Strahler’s stream order is 4. The climate in the watershed is temperate mediter-ranean, with a dry season of 5 months (November–March), and a wet season of approximately 3 months (May–July) dur-ing which more than 50% of the precipitation occurs. Ambi-ent mean daily temperature ranges between 18◦C in January
and 8◦C in June, with an annual mean of 12.5◦C. The
Fig. 3. Land cover in 1979 (left) and 1994 (right).
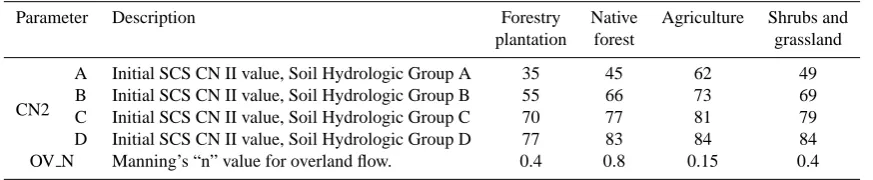
Table 1. Curve number and Manning’s coeficient for the main land uses in the Vergara watershed.
Parameter Description Forestry Native Agriculture Shrubs and
plantation forest grassland
CN2
A Initial SCS CN II value, Soil Hydrologic Group A 35 45 62 49 B Initial SCS CN II value, Soil Hydrologic Group B 55 66 73 69 C Initial SCS CN II value, Soil Hydrologic Group C 70 77 81 79 D Initial SCS CN II value, Soil Hydrologic Group D 77 83 84 84 OV N Manning’s “n” value for overland flow. 0.4 0.8 0.15 0.4
from available images of the shuttle radar topography mis-sion, SRTM DEM (final version).
3 Data sets used
3.1 Soil types
The GIS layer representing the different soils in the wa-tershed was obtained from CIREN (1999a) and CIREN (1999b). The most common soils in the watershed are silt loam soils (33%) originated from volcanic ash deposits, silty clay loam soils (29%) developed from old volcanic ashes and sandy clay loam soils (13%) with granitic origin and richness in quartz. Figure 2 shows the soil type distribution in the wa-tershed.
3.2 Land uses
Land uses are classified according to the land cover database proposed by Neitsch et al. (2002) which includes the de-scription of 97 different land uses. In the particular study case, all the observed land uses where found in the land cover database by Neitsch et al. (2002). Arising differences between (introduced) forest plantation and native forest are mainly the corresponding curve number and the Manning roughness coefficient for overland flow. Table 1 shows Curve Number and Manning’s coefficient for the main land uses in
the Vergara watershed. Note that as expected and according to the curve number method, forestry plantation consumes more water than native forest and native forest consumes more water than agriculture, while initial abstraction, i.e. re-tention, decreases with the curve number.
[image:3.595.80.517.264.354.2]Table 2. Changes in land cover between 1979 and 1994.
Land cover Covered area Portion of the Covered area Portion of the Land use Change in land in 1979 (ha) basin (%) in 1994 (ha) basin (%) change (ha) cover (%)
Native forest 133.096 31 92.533 21 −40.563 −30
Scrubland 77.532 18 29.897 7 −47.635 −61
Steppe 3.157 1 3.157 1 0 0
Forestry plantation 15.129 3 164.587 38 149.458 988
Agriculture 203.055 47 140.945 32 −62.110 −3
Urban areas 1.071 0 1.992 0 921 86
Bare soil 108 0 209 0 101 94
Water bodies 814 0 643 0 −171 −21
[image:4.595.59.541.273.418.2]Total 433.963 100 433.963 100
Table 3. Land use transition matrix for the years 1979 and 1994. Values in [ha].
1979
Native Scrubland Steppe Forestry Agriculture Water Bare Urban Total
forest plantation bodies soil areas
1994
Native forest 92 533 0 0 0 0 0 0 0 92 533
Scrubland 6836 14 228 0 306 8459 15 53 0 29 897
Steppe 0 0 3157 0 0 0 0 0 3157
Forestry plantation 30 428 38 550 0 14 817 80 706 80 6 0 164 587
Agriculture 3202 24 453 0 6 113 189 72 22 0 140 945
Water bodies 0 0 0 0 0 643 0 0 643
Bare soil 31 80 0 0 71 3 24 0 209
Urban areas 67 222 0 0 631 0 1 1071 1992
Total 133 096 77 532 3157 15 129 203 055 814 108 1071 433 963
Main land cover changes in the watershed observed be-tween 1979 and 1994 are the increase in forestry plantations and the decrease of scrubland, native forest and agriculture. In the year 1994, the areas covered by forest plantations in-creased 10 times with respect to those observed in 1979, mainly occupying previous agriculture land (54% of the to-tal new forest plantation), and areas with shrubs and native forest (56%). The shrub coverage diminished by 50%, of which one half was occupied by forest plantations and one half by agricultural production. The native forest diminished in 40 000 ha, i.e. the 30% of the area covered in 1979. Of this, 75% was replaced by forest plantations. Table 3 shows the landuse transition matrix, i.e. the changes of landuses for different years. The total of each column and row indicates the area of the land covers for the years 1979 and 1994, re-spectively. Column values indicate the land cover changes occurred between 1979 and 1994 (e.g. 30 428 ha of native forest for a total of 133 096 ha were converted to forest plan-tations). The values of the diagonal indicate the area that remained the same during the period (e.g. 92 533 ha of native forest from a total of 133 096 ha were maintained during the period 1979–1994).
3.3 Hydrological records
Table 4. Mean monthly discharges [m3s−1] at the different control points in the Vergara basin (1977–2002).
Tijeral Rehuea Renaicob Mininco Malleco
Maximum mean monthly discharge 162.37 (July) 17.17 (July) 88.75 (July) 40.02 (July) 59.17 (July) Minimum mean monthly discharge 7.39 (February) 0.22 (February) 6.89 (March) 2.16 (February) 3.81 (March)
Mean annual discharge 57.52 6.07 42.63 15.81 26.58
[image:5.595.296.545.175.606.2]aMeasured discharge data since July 1997.bMeasured discharge data since July 1982.
Fig. 4. Location of hydrometeorologic stations and available record
periods.
Figure 6 shows the location of the five gauging stations and corresponding drainage area.
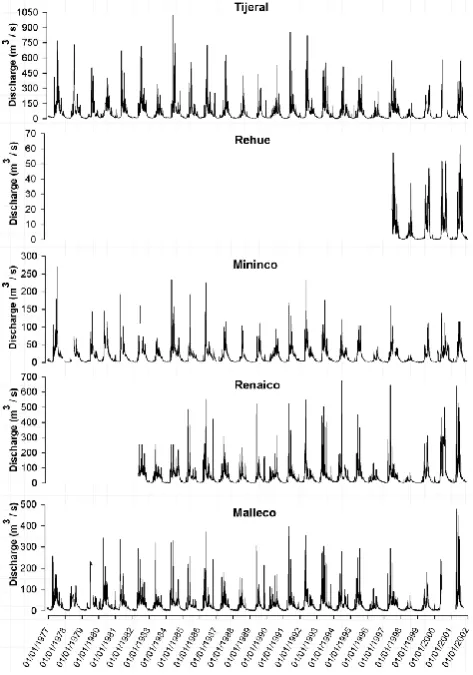
Figure 7 shows the existing hydrographs for the period 1977–2002 recorded at Tijeral, Rehue, Mininco, Renaico, and Malleco gauging stations.
Table 4 indicates maximum, minimum and mean monthly discharges for all gauging stations.
[image:5.595.309.544.190.390.2]Observed discharges diminish from Tijeral to Renaico, Malleco and Mininco. Rehue is a nested basin of Tijeral, presenting the smallest discharges.
Fig. 5. Gauging stations in the watershed.
Fig. 6. Gauging stations in the watershed.
4 Generation of probable land use scenarios
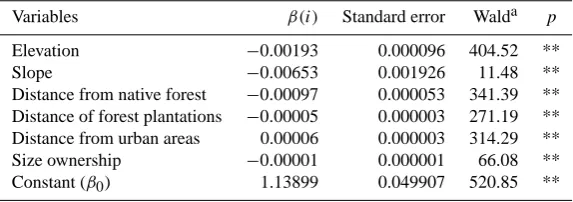
[image:5.595.49.288.192.527.2] [image:5.595.310.543.421.601.2]Table 5. Results of the adjustment of the logistic regression for forest plantation sprawl (** =p <0.01).
Variables β(i) Standard error Walda p
Elevation −0.00193 0.000096 404.52 **
Slope −0.00653 0.001926 11.48 **
Distance from native forest −0.00097 0.000053 341.39 ** Distance of forest plantations −0.00005 0.000003 271.19 ** Distance from urban areas 0.00006 0.000003 314.29 ** Size ownership −0.00001 0.000001 66.08 ** Constant (β0) 1.13899 0.049907 520.85 **
aWald test is used to test the statistical significance of each coefficient (b) in the model
Table 6. Ranking of the four most sensitive parameters in Tijeral, Rehue, Renaico, Mininco and Malleco.
Parameter Description Tijeral Rehue Mininco Renaico Malleco
GWQMN Threshold water depth in the shallow aquifer for flow 2 3 2 4 2
GW REVAP Groundwater revap coefficient 4
CN2 Initial SCS CN II value 1 2 1 1 1
SOL AWC Available water capacity 3 4 2 3
rchrg dp Deep aquifer percolation fraction 4 1 3 3 4
portion that could be covered by a certain land use. Gener-ated scenarios with this approach simulGener-ated the existence of laws for conservation of native forest, causing that (1) the ac-tual native forest coverage does not change and the rest of the watershed become covered by introduced forest species, and the inexistency of adequate land use planning instruments al-lowed a deliberated land use in the watershed causing that (2) the native forest coverage does not change, but the rest of the watershed becomes completely covered by agriculture land. The regression model was based on observed infor-mation available in the satellite images of 1979 and 1994 for the prediction of patterns of forest expansion, deforesta-tion advancing, and substitudeforesta-tion of native forest generating a scenario where (3) observed patterns of land use changes between 1979 and 1994 continue with the same tendency. Scenario 3 was obtained using a set of prediction variables such as elevation, slope, distance from native forest, dis-tance of forest plantations, disdis-tance from urban areas and size ownership. To quantify the relationship between land cover changes and its causal factors, the maps of 1979–1994 were sprawl and the results were related to a set of predictor variables (change and non change) that were selected based on current knowledge of landuse change process in the Ver-gara watershed as presented in Echeverr´ıa et al. (2006, 2007), Altamirano et al. (2007) and Aguayo et al. (2009). Table 5 shows these variables. An appropriate binary response vari-able was constructed from the observed forest expansion pat-tern and a logistic regression model was used to predict the probability of land cover change depending on the various predictor variables (Eq. 1; Table 5).
P (y=1|x)= e
β0+Pni=1βixi
1+eβ0+Pni=1βixi
(1)
where,P (y=1|x)is the Probability,xiare the different
vari-ables,β0is a Constant,βi are the variable coefficients and n
number of variables.
5 Soil and water assessment tool, SWAT
The physically based hydrologic model SWAT computes runoff, infiltration, percolation and groundwater flows at a daily scale for long-term response analysis. In the model, the watershed is divided in subbasins, which for semi-distributed computation of flows are again internally subdivided into hy-drologic response units with relative homogeneous topogra-phy, soil type, and land use. For computations, SWAT re-quires a digital elevation model, soil type and land use maps as well as precipitation and ambient temperature.
Surface runoff was computed with the curve number method. Several previous studies show the applicability of the SCS CN approach for the study region. The SCS CN method has been extensively tested and modified in order to represent local conditions. For details, please refer to Iroum´e et al. (1999), Saavedra and Stowhas, (2003), Stowhas (2003) and Pizarro et al. (2006).
[image:6.595.66.527.248.326.2]Table 7. Sensitive parameters obtained in the referred studies.
Author Country Most sensitive parameters
Kannan et al. (2007) UK AWC, Sol K, ESCO, GWQMN and CN2 Spruill et al. (2000) USA Sol K, Alpha Bf
Arnold et al. (2000) USA CN2, Sol Awc, ESCO
Holvoet et al. (2005) Belgium CN2, surlag, rchrg dp, GWQMN
Van Griensven et al. (2006) USA CN2, Gwqmn, Alpha Bf, Sol Awc, Sol z, Smfmx, ESCO, CANMX White and Chaubey (2005) USA CN2, ESCO, Sol AWC,
Fig. 7. Hydrographs based on daily mean discharges for the
pe-riod 1977–2002 recorded at Tijeral, Rehue, Mininco, Renaico, and Malleco gaugin stations.
soil moisture. Water is routed using the kinematic wave ap-proach, using Manning’s relation for estimation of the runoff speed.
SWAT includes three different methods for computation of evaporation/evapotranspiration, namely: Penman-Monteith, Priestley-Taylor and Hargreaves. As there are no records of wind speed, relative humidity and solar radiation in the basin, but maximum and minimum temperatures are available from
existent meteorological stations the Hargreaves method was employed. The Hargreaves method has shown good results in different type of climates (Jensen et al., 1990; Allen et al., 1998; Antonioletti et al., 1998; Droogers et al., 2002; Saghravani et al., 2009). Moreover, Jensen et al. (1990) compared 20 different evapotranspiration methods against lysimeter data. Of all methods that required only air tem-perature the Hargreaves method showed the best results.
SWAT split groundwater into two aquifer systems: a shal-low, unconfined aquifer which contributes return flow to streams within the subbasin, and a deep, confined aquifer which contributes return flow to streams outside the sub-basin (Arnold et al., 1993). Water percolation under the root zone is partitioned in two fractions – each fraction becomes recharge contributing to one of both aquifers. In addition to return flow, water stored in the shallow aquifer may replenish moisture in the soil profile in very dry conditions or be di-rectly removed by plants. The model considers transfer from the shallow to the deep aquifer. In snow accumulation and melt modelling each sub-basin generated in SWAT is divided into 10 elevation bands in order to incorporate temperature and precipitation variations with respect to altitude (Hartman et al., 1999). For each sub-basin, different lapse rates for precipitation plaps (mm H2O km−1) and temperature tlaps (◦C km−1) were defined, which were then used to account for the differences in precipitation and temperature between these elevation bands.
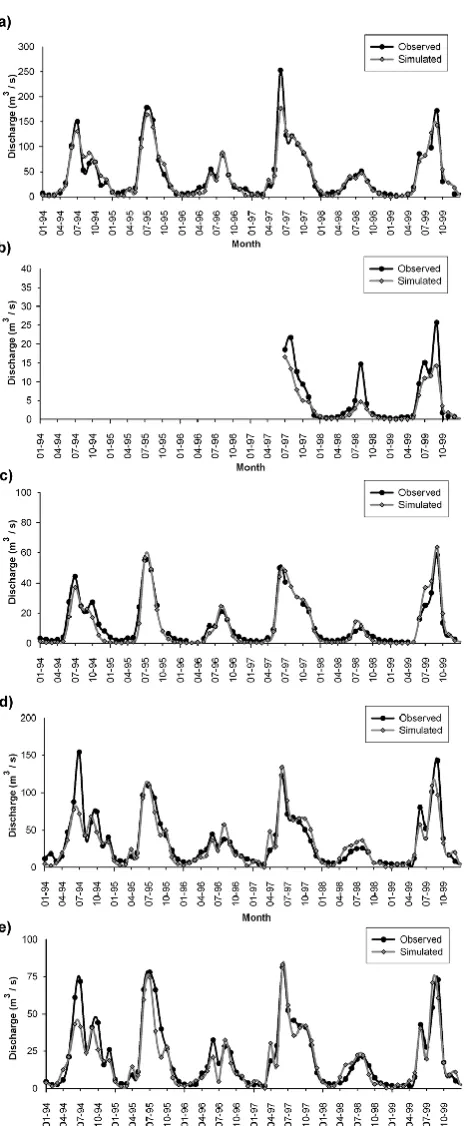
[image:7.595.49.286.213.551.2]Fig. 8. Observed and simulated mean monthly discharges during
[image:8.595.313.546.66.408.2]years 2000–2002 at Tijeral (a), Rehue (b), Mininco (c), Renaico (d) and Malleco (e).
Fig. 9. Observed and simulated mean monthly discharges for the
years 1977–1982 at the gauge stations Tijeral (a), Mininco (b) and Malleco (c).
with the concept of a controlled random search, a systematic evolution of points in the direction of global improvement, competitive evolution and the concept of complex shuffling (Van Griensven et al., 2006). To obtain the optimum so-lution the sum of the squares of the residuals (SSQ) was used. Upper and lower parameter value bounds used for au-tomated calibration were established based on recommenda-tions made by (Van Liew et al., 2005) and based on own ex-perience from previous work on the Biob´ıo basin (Stehr et al., 2008, 2009).
6 Results and discussion
Fig. 10. Observed and simulated monthly discharges for the years
[image:9.595.52.286.77.641.2]1994–1999 at gauge stations Tijeral (a), Rehue (b), Mininco (c), Renaico (d) and Malleco (e).
Table 8. RMS error, absolute error, efficiency, determination
coef-ficient and percentage of Bias calculated for the period 2000–2002 after calibration.
Tijeral Rehue Mininco Renaico Malleco
RRMSE 0.30 0.51 0.50 0.82 0.37
ABSERR 11.64 1.99 6.31 24.16 7.52
EF 0.93 0.82 0.72 0.54 0.85
R2 0.96 0.88 0.76 0.71 0.93
PBIAS 11.78 21.35 8.32 32.04 14.94
of 1994, in order to check if the model is able to adequately reproduce the catchment hydrology under different land use scenarios, i.e. if model performance significantly varies with land use change. Computed and measured monthly dis-charges were compared at Tijeral, Rehue, Renaico, Mininco and Malleco and model performance was evaluated through RMS error, absolute error, Nash-Sutcliffe’s efficiency, deter-mination coefficient, and percent bias.
[image:9.595.309.550.120.198.2]6.1 Sensitivity analysis
Table 6 shows the ranking of the four most sensitive parame-ters obtained with LH-OAT analysis for basin Tijeral, Rehue, Renaico and Mininco for years 2000–2002. The subbasin Malleco was not analysed, because there are insufficient dis-charge records between the years 2000–2002. As Malleco is a subbasin of Tijeral, identical parameter values were con-sidered for both.
The most sensitive parameter is the CN2 value. Other sen-sitive parameters are Gwqmn, Sol Awc and rchrg dp. This results are in agreement with those by Arnold et al. (2000), Spruill et al. (2000), White and Chaubey (2005), Holvoet et al. (2005), Van Griensven et al. (2006), and Kannan et al. (2007). Table 7 shows the sensitive parameters obtained in the referred studies.
According to Table 7 a similar behaviour of SWAT for ap-plications in the basins located in south-central Chile, i.e. Vergara and subbasins, to that reported for watersheds lo-cated in the Northern Hemisphere is observed.
6.2 Calibration of the model
The most sensitive parameters of the model were calibrated for the years 2000–2002 in order to reproduce the observed discharges at the available gauge stations: Tijeral, Rehue, Renaico, Mininco and Malleco using the parameter solution method PARASOL. Figure 8 shows the observed and com-puted discharges for the years 2000–2002 after calibration.
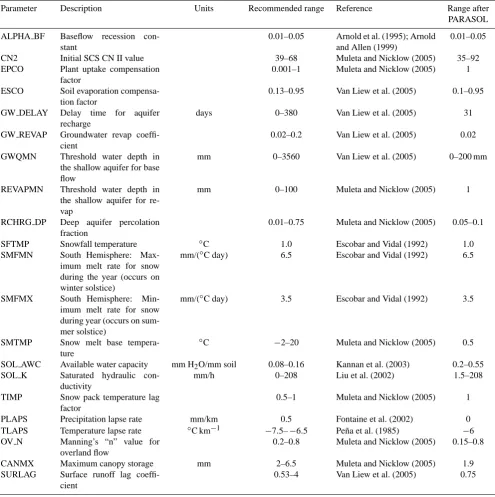
Table 9. Parameters involved in the computation of surface runoff in the Vergara watershed.
Parameter Description Units Recommended range Reference Range after
PARASOL
ALPHA BF Baseflow recession con-stant
0.01–0.05 Arnold et al. (1995); Arnold and Allen (1999)
0.01–0.05
CN2 Initial SCS CN II value 39–68 Muleta and Nicklow (2005) 35–92
EPCO Plant uptake compensation factor
0.001–1 Muleta and Nicklow (2005) 1
ESCO Soil evaporation compensa-tion factor
0.13–0.95 Van Liew et al. (2005) 0.1–0.95
GW DELAY Delay time for aquifer recharge
days 0–380 Van Liew et al. (2005) 31
GW REVAP Groundwater revap coeffi-cient
0.02–0.2 Van Liew et al. (2005) 0.02
GWQMN Threshold water depth in the shallow aquifer for base flow
mm 0–3560 Van Liew et al. (2005) 0–200 mm
REVAPMN Threshold water depth in the shallow aquifer for re-vap
mm 0–100 Muleta and Nicklow (2005) 1
RCHRG DP Deep aquifer percolation fraction
0.01–0.75 Muleta and Nicklow (2005) 0.05–0.1
SFTMP Snowfall temperature ◦C 1.0 Escobar and Vidal (1992) 1.0
SMFMN South Hemisphere: Max-imum melt rate for snow during the year (occurs on winter solstice)
mm/(◦C day) 6.5 Escobar and Vidal (1992) 6.5
SMFMX South Hemisphere: Min-imum melt rate for snow during year (occurs on sum-mer solstice)
mm/(◦C day) 3.5 Escobar and Vidal (1992) 3.5
SMTMP Snow melt base tempera-ture
◦C −2–20 Muleta and Nicklow (2005) 0.5
SOL AWC Available water capacity mm H2O/mm soil 0.08–0.16 Kannan et al. (2003) 0.2–0.55 SOL K Saturated hydraulic
con-ductivity
mm/h 0–208 Liu et al. (2002) 1.5–208
TIMP Snow pack temperature lag factor
0.5–1 Muleta and Nicklow (2005) 1
PLAPS Precipitation lapse rate mm/km 0.5 Fontaine et al. (2002) 0
TLAPS Temperature lapse rate ◦C km−1 −7.5–−6.5 Pe˜na et al. (1985) −6 OV N Manning’s “n” value for
overland flow
0.2–0.8 Muleta and Nicklow (2005) 0.15–0.8
CANMX Maximum canopy storage mm 2–6.5 Muleta and Nicklow (2005) 1.9
SURLAG Surface runoff lag coeffi-cient
0.53–4 Van Liew et al. (2005) 0.75
discharges during high water events. Table 8 shows the RMS error (RRMSE), absolute error (ABSERR), Nash-Sutcliffe’s efficiency (EF), determination coefficient (R2), and percent of Bias (PBIAS) for the years 2000–2002.
Overall, calculated and measured discharges are well cor-related. The model was able to reproduce the flow regime in the watershed.
Fig. 11. Land use maps according to observed scenario in year 1994 (a) baseline, (b) scenario 1, (c) scenario 2, (d) scenario 3.
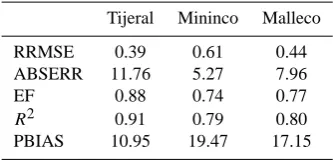
Table 10. RMS error, absolute error, efficiency and determination
coefficient calculated for the period 1977–1982.
Tijeral Mininco Malleco
RRMSE 0.39 0.61 0.44
ABSERR 11.76 5.27 7.96
EF 0.88 0.74 0.77
R2 0.91 0.79 0.80
PBIAS 10.95 19.47 17.15
6.3 Validation of the model
Figure 9 shows the observed and computed discharges for years 1977–1982 at Tijeral, Mininco and Malleco, using the land use map of 1979. Note that gauge stations Renaico and Rehue did not operate in this period.
With the calibrated parameters, the model was able to cor-rectly reproduce the order of magnitude of the observed dis-charges in the years 1977–1982, as well as their change ten-dency in time. Again, peak flows were not precisely repro-duced by SWAT. Table 10 shows the RMS error, absolute
Table 11. RMS error, absolute error, efficiency, determination
coef-ficient and percentage of Bias calculated for the period 1994–1999.
Tijeral Rehuea Mininco Renaico Malleco
RRMSE 0.31 0.63 0.33 0.42 0.38
ABSERR 8.24 2.15 2.98 9.12 5.07
EF 0.93 0.75 0.92 0.82 0.86
R2 0.93 0.89 0.94 0.83 0.88
PBIAS 2.77 32.75 9.13 7.88 10.38
aMeasured discharge data since July 1997
error, Nash-Sutcliffe’s efficiency, determination coefficient, and percentage of bias calculated for the years 1977–1982.
Overall, simulated and observed discharges are well cor-related. The model reproduced with sufficient efficiency the flow regime in the subbasins for the validation period. Fig-ure 10 shows the observed and computed discharges for years 1994–1999 using the land use map of 1994.
[image:11.595.307.555.481.559.2]Table 12. Percentage of area covered by the different land uses for the Vergara watershed and its subbasins: Tijeral, Rehue, Mininco, Renaico
and Malleco in baseline and scenarios 1, 2, and 3.
Land use Tijeral Rehue Mininco Renaico Malleco Vergara
Baseline
Agriculture 20.92 22.22 39.12 6.48 11.89 21.11
Native forest 22.64 3.07 9.49 61.03 60.25 23.37 Forestry plantation 35.99 40.45 49.07 23.95 23.81 39.44 Shrubs and grassland 19.72 33.90 2.31 5.33 3.79 14.46
Others 0.74 0.36 0.00 3.21 0.25 1.62
Scenario 1
Agriculture 0.00 0.00 0.00 0.00 0.00 0.00
Native forest 22.64 3.07 9.49 61.03 60.25 23.37 Forestry plantation 77.36 96.93 90.51 38.97 39.75 76.63 Shrubs and grassland 0.00 0.00 0.00 0.00 0.00 0.00
Others 0.00 0.00 0.00 0.00 0.00 0.00
Scenario 2
Agriculture 77.36 96.93 90.51 38.97 39.75 76.63 Native forest 22.64 3.07 9.49 61.03 60.25 23.37 Forestry plantation 0.00 0.00 0.00 0.00 0.00 0.00 Shrubs and grassland 0.00 0.00 0.00 0.00 0.00 0.00
Others 0.00 0.00 0.00 0.00 0.00 0.00
Scenario 3
Agriculture 5.71 7.80 0.54 8.73 2.41 7.70
Native forest 11.53 0.99 60.40 0.00 51.93 16.03 Forestry plantation 67.53 81.29 32.92 72.84 42.94 62.87 Shrubs and grassland 15.12 9.86 6.10 18.30 2.47 13.26
Others 0.12 0.07 0.04 0.13 0.24 0.15
Table 13. Percentage of change respect to the baseline scenario for mean annual, wet season (May–October) and dry season (November–
April) flows.
Vergara Tijeral Rehue Mininco Renaico Malleco
Year Wet Dry Year Wet Dry Year Wet Dry Year Wet Dry Year Wet Dry Year Wet Dry
Scenario 1 −4.09 −4.83 0.24 −1.86 −2.81 2.93 −10.61 −10.67 −9.94 −8.57 −9.02 −4.42 −2.32 −2.81 0.06 −1.69 −2.48 1.19 Scenario 2 5.08 5.41 3.06 7.30 7.28 6.32 7.23 7.70 1.55 2.38 2.63 −1.06 1.13 1.27 0.81 1.86 1.37 3.86 Scenario 3 −2.40 −2.86 0.28 −0.48 −1.25 3.21 −9.37 −9.34 −9.83 −6.30 −6.55 −4.03 −1.62 −1.96 0.07 −1.66 −2.46 1.26
tendency in time. Peak flows were not precisely reproduced by the model. Table 11 shows the RMS error, absolute error, Nash-Sutcliffe’s efficiency, determination coefficient, and percentage of bias calculated for the years 1994-1998 at the different gauge stations.
The double validation process demonstrates that the model was able to compute the hydrologic response of the Vergara watershed under different land use scenarios with at least ac-ceptable performance, i.e. EF>0.75. Thus, it is assumed that the model can be applied for analysis of the hydrologic response of the Vergara watershed to land use changes.
6.4 Modelling the hydrologic response to land use changes
The hydrologic response of the watershed to land use changes was simulated, maintaining the observed
precipi-tation and ambient temperature for the years 1994–1999 as input. Consequently, each simulation differed from the base-line only in the land use conditions.
Figure 11 shows the 1994 land use map, i.e. baseline, and the three generated scenarios according to the described methodology. Note that land uses generated with the logis-tic regression model (Fig. 11, map d) show a strong growth of forest plantations over most part of the watershed, occupy-ing agricultural areas and substitutoccupy-ing native forest at the east hills of the Coastal Mountain Chain and the foothills of the Andes Mountain Chain. Table 12 indicates the percentage of area covered by the different land uses for the Vergara wa-tershed and its subbasins: Tijeral, Rehue, Mininco, Renaico and Malleco in baseline and scenarios 1, 2, and 3.
[image:12.595.50.559.431.483.2]Fig. 12. Changes of mean annual discharges at Tijeral, Rehue,
Re-naico, Mininco and Malleco under land use scenarios respect to the baseline.
Mean annual discharge under land use scenarios 1 and 3 diminished in all the subbasins, with maximum reductions of ca. 10%. Both scenarios represent land uses with predom-inant forest plantation. Land use scenario 2, representing a land use with predominant agricultural cover, caused an in-crease in annual mean discharge in all the subbasins up to ca. 7% in Tijeral and Rehue. In general, forestry plantations tend to reduce mean annual discharge, whereas agriculture increases it. These results are in agreement with those ob-tained by (Hejazi and Moglen, 2008) for a watershed located in Thailand. Thus, implementation of protection laws for native species conservation and regulated land use change are strongly recommended in order to preserve the water re-sources of the watershed.
Table 13 shows a comparison of results obtained for the dry (mean values for November to April) and wet (mean val-ues from May to October) season. Major relative changes in mean annual discharge are expected to occur at Rehue, fol-lowed by Malleco and Tijeral. Note that Rehue and Malleco are nested sub-basins of Tijeral.
7 Conclusions
The hydrologic response of a mesoscale watershed to dif-ferent land use scenarios was analysed, applying heuristic rules and logistic regression models and the semi-distributed model SWAT. The Vergara’s watershed response was anal-ysed in terms of the annual mean discharge at the five sub-basins gauged in the area which covered ca. 80% of the wa-tershed.
The current model version successfully passed a double validation processes considering monthly outputs, with two different land use conditions. Calibration and validation of SWAT showed that it is able to reproduce the observed flows
at Tijeral, Rehue, Mininco, Renaico and Malleco under dif-ferent land use conditions satisfactorily.
Simulations of probable scenarios showed that substitu-tion of agriculture areas, shrubs and grassland with planta-tions of introduced species cause a reduction of annual mean discharge in up to 10%, while substitution of introduced for-est plantations, shrubs and grasslands with agricultural land increases the annual mean discharge in up to 7%. Based on the observed tendency of landuse change in the period 1979– 1994, a reduction of the mean annual discharge is expected. Thus, forestation of areas with introduced species like Pinus radiata and Eucalyptus globulus might be regulated in order to protect the water resources of the watershed.
Acknowledgements. The authors thank the Chilean Research
Council CONICYT for Grant FONDECYT 1090428.
Edited by: A. Bronstert
References
Aguayo, M., Pauchard, A., Azocar, G., and Parra, O.: Land use change in South-central Chile by the end of the XX century. Understanding spatial and temporary landscape dynamics, Rev. Chil. Hist. Nat., 82, 361–374. 2009 (in Spanish).
Allen, R. G., Pereira, L. S., Raes, D., and Smith, M.: Crop Evap-otranspiration: Guidelines for Computing Crop Water Require-ments, FAO Irrigat. Drainage, Rome, 1998.
Altamirano, A., Echeverr´ıa, C., and Lara, A.: Effect of forest frag-mentation on the vegetation structure of threatened populations of Legrandia concinna (Myrtaceae) in the center-south of Chile, Rev. Chil. Hist. a Nat., 80, 27–42, 2007 (in Spanish).
Anderson, M. G. and Burt, T. P.: Process studies in hillslope hy-drology, John Wiley and Sons Ltd, England, 1990.
Antonioletti, R., Gonzalez, P., and Ortega, S.: Comparative analysis of methods for estimating evapotranspiration in the Maule region of Chile, Agro-Ciencia (Chile), 14, 435–440, 1998 (in Spanish). Arnold, J. C., Allen, P. M., and Bernhardt, G.: A comprehensive surface groundwater flow model, J. Hydrol., 142, 47–69, 1993. Arnold, J. G., Allen, P. M. Muttiah, R., and Bernhardt, G.:
Au-tomated base flow separation and recession analysis techniques, Ground Water, 33, 1010–1018, 1995.
Arnold, J. G., Srinivasan, R., Muttiah, R. S., and Williams, J. R.: Large area hydrologic modeling and assessment – Part 1: Model development, J. Am. Water Resour. Assoc., 34, 73–89, 1998. Arnold, J. G. and Allen, P. M.: Automated methods for estimating
baseflow and ground water recharge from streamflow records, JAWRA, 35, 411–424, 1999.
Arnold, J. G., Muttiah, R. S., Srinivasan, R., and Allen, P. M.: Re-gional estimation of base flow and groundwater recharge in the upper Mississippi basin, J. Hydrol., 227, 21–40, 2000.
Arnold, J. G. and Fohrer, N.: SWAT2000: current capabilities and research opportunities in applied watershed modeling, Hydrol. Processes, 19, 563–572, 2005.
Breuer, L. and Huisman, J. A.: Assessing the impact of land use change on hydrology by ensemble modeling (LUCHEM), Adv. Water Resour., 32, 127–128, 2009.
Bronstert, A., Niehoff, D., and Burger, G.: Effects of climate and land-use change on storm runoff generation: present knowl-edge and modeling capabilities, Hydrol. Processes, 16, 509–529, 2002.
Brown, A. E., Zhang, L., McMahon, T. A., Western, A. W., and Vertessy, R. A.: A review of paired catchment studies for deter-mining changes in water yield resulting from alterations in vege-tation, J. Hydrol., 310, 28–61, 2005.
Centro de Informaci´on de Recursos Naturales (CIREN): Estudio Agrol´ogico VIII Regi´on. Descripci´on de Suelos, Materiales y s´ımbolos. Tomos 1 y 2, CIREN CORFO, Santiago, Chile, 1999. Centro de Informaci´on de Recursos Naturales (CIREN): Estudio Agrol´ogico IX Regi´on. Descripci´on de Suelos, Materiales y s´ımbolos, CIREN CORFO, Santiago, Chile, 1999.
Corporaci´on Nacional Forestal – Comisi´on Nacional del Medio Ambiente – Banco Interamericano de Reconstrucci´on y Fomento (CONAMA-CONAF-BIRF): Catastro y evaluaci´on de los recur-sos vegetacionales nativos de Chile. Informe Regional, Octava Regi´on, CONAF-CONAMA, Santiago, Chile, 1999.
Costa, M. H., Botta, A., and Cardille, J. A.: Effects of large-scale changes in land cover on the discharge of the Tocantins River, Southeastern Amazonia, J. Hydrol., 283, 206–217, 2003. Croke, B. F. W., Merritt, W. S., and Jakeman, A. J.: A dynamic
model for predicting hydrologic response to land cover changes in gauged and ungauged catchments, J. Hydrol., 291, 115–131, 2004.
Droogers, P. and Allen, R. G.: Estimating reference evapotranspira-tion under inaccurate data condievapotranspira-tions, Irrigat. Drainage Syst., 16, 33–45, doi:10.1023/A:1015508322413, 2002.
Duan, Q., Sorooshian, S., and Gupta, V.: Effective and efficient global optimization for conceptual rainfall-runoff models, Water Resour. Res., 28, 1015–1031, 1992.
Echeverr´ıa C, Coomes, D., Salas, J., Rey-Benayas, J. M., Lara, A., and Newton, A.: Rapid deforestation and fragmentation of Chilean temperate forests, Biol. Conserv., 130, 481–494, 2006. Echeverr´ıa, C., Newton, A., Lara, A., Rey-Benayas, J. M., and
Coomes, D.: Impacts of forest fragmentation on species compo-sition and forest structure in the temperate landscape of southern Chile, Global Ecol. Biogeogr., 16, 426–439, 2007.
Eckhardt, K., Breuer, L., and Frede, H. G.: Parameter uncertainty and the significance of simulated land use change effects, J. Hy-drol., 273, 164–176, 2003.
Escobar, F. and Vidal, F.: Experience on the determination of the snowline in drainage basins of central Chile, Sociedad de Inge-nier´ıa Hidr´aulica Revista (Santiago), 2, 5–18, 1992 (in Spanish). Fohrer, N., Haverkamp, S., Eckhardt, K., and Frede, H. G.: Hy-drologic response to land use changes on the catchment scale, Physics Chem. Earth: B: Hydrol., Oceans Atmosphere, 26, 577– 582, 2001.
Fohrer, N., Haverkamp, S., and Frede, H. G.: Assessment of the effects of land use patterns on hydrologic landscape functions: development of sustainable land use concepts for low mountain range areas, Hydrol. Processes, 19, 659–672, 2005.
Foley, J. A., DeFries, R., Asner, G. P., Barford, C., Bonan, G., Car-penter, S. R., Chapin, F. S., Coe, M. T., Daily, G. C., Gibbs, H. K., Helkowski, J. H., Holloway, T., Howard, E. A., Kucharik, C.
J., Monfreda, C., Patz, J. A., Prentice, I. C., Ramankutty, N., and Snyder, P. K.: Global consequences of land use, Science, 309, 570–574, 2005.
Fontaine, T. A., Cruickshank, T. S., and Arnold, J. G.: Develop-ment of a snowfall – snowmelt routine for mountainous terrain for the soil water assessment tool (SWAT), J. Hydrol, 262, 209– 223, 2002.
Hejazi, M. I. and Moglen, G. E.: The effect of climate and land use change on flow duration in the Maryland Piedmont region, Hydrol. Processes, 22, 4710–4722, 2008.
Holvoet, K., van Griensven, A., Seuntjens, P., and Vanrolleghem, P. A.: Sensitivity analysis for hydrology and pesticide supply to-wards the river in SWAT, Phys. Chem. Earth, 30, 518–526, 2005. Iroum´e, A., Huber, A., Salazar, C., and Arriagada, A.: Monitoring and quantification of the hydric processes in an Andean water-shed, IX Region, Chile, VI Jornadas del CONAPHI-Chile, San-tiago, Chile, 1999 (in Spanish).
Jenerette, G. D. and Larsen, L.: A global perspective on chang-ing sustainable urban water supplies, Global Planet. Change, 50, 202–211, 2006.
Jensen, M. E., Burman, R. D., and Allen, R. G.: Evapotranspiration and irrigation w´ater requirements, ASCE Manuals and Reports on Engineering Practice, No. 70, ASCE, New York, USA, 332 pp, 1990.
Kannan, N., White, S., Worrall, F., and Whelan, M.: Modelling pollutants in runoff from the Colworth experimental Catchment, Proceedings of the 2nd International SWAT Conference, Bari, Italy, 149–154, 2003.
Kannan, N., White, S. M., Worrall, F., and Whelan, M. J.: Sen-sitivity analysis and identification of the best evapotranspiration and runoff options for hydrological modelling in SWAT-2000, J. Hydrol., 332, 456–466, 2007.
Klocking, B. and Haberlandt, U.: Impact of land use changes on water dynamics-a case study in temperate meso and macroscale river basins, Physics Chem. Earth: B: Hydrol., Oceans Atmo-sphere, 27, 619–629, 2002.
Klocking, B., Strobl, B., Knoblauch, S., Maier, U., Pfutzner, B., and Gericke, A.: Development and allocation of land-use scenar-ios in agriculture for hydrological impact studies, Physics Chem. Earth: B: Hydrol., Oceans Atmosphere, 28, 1311–1321, 2003. Lahmer, W., Pfutzner, B., and Becker, A.: Assessment of land use
and climate change impacts on the mesoscale, Physics Chem. Earth: B: Hydrol., Oceans Atmosphere, 26, 565–575, 2001. Liu, Y. B., Gebremeskel, S., De Smedt, F., and Pfister, L.: Flood
prediction with the WetSpa model on catchment scale, Flood De-fence 2002, Wu, B. S., Wang, Z. Y., Huang, G. H., Fang, H. W., and Huang, J. C., Science Press, New York Ltd., ISBN 1-880132-54-0, 2002.
Mark, A. F. and Dickinson, K. J. M.: Maximizing water yield with indigenous non-forest vegetation: a New Zealand perspective, Front. Ecol. Environ., 6, 25–34, 2008.
Montgomery, D. R. and Buffington, J. M.: Channel-reach morphol-ogy in mountain drainage basins, Geol. Soc. Am. Bull., 109, 596–611, 1997.
Morris, M. D.: Factorial sampling plans for preliminary computa-tional experiments, Technometrics, 33, 161–174, 1991. Naef, F., Scherrer, S., and Weiler, M.: A process based assessment
Neitsch, S. L., Arnold, J. G., Kiniry, J. R., Srinivasan, R., and Williams, J. R.: Soil and Water Assessment Tool User’s Manual Version 2000, Texas Water Resources Institute TR-192, College Station, TX., 2002.
Ott, B. and Uhlenbrook, S.: Quantifying the impact of land-use changes at the event and seasonal time scale using a process-oriented catchment model, Hydrol. Earth Syst. Sci., 8, 62–78, doi:10.5194/hess-8-62-2004, 2004.
Pe˜na, H., Vidal, F., Escobar, F., and Stowhas, L.: Snowmelt rates estimation, VII Congreso de Ingenier´ıa Hidr´aulica, Concepci´on, Chile, 1985 (in Spanish).
Pizarro, R., Tapia, M., Rom´an, L., Jord´an, C., and Far´ıas, C.: Chile. Instantaneous runoff coefficients for Tutuv´en river basin, Maule Region, Chile, Bosque, 27, 83–91, 2006 (in Spanish).
Postel, S. L., Daily, G. C., and Ehrlich, P. R.: Human appropriation of renewable fresh water, Science, 271, 785–788, 1996. Saavedra, C. and Stowhas, L.: Calculation and critical analysis of
the curve number method for watershed of the country, XVI Con-greso de Ingenier´ıa Hidr´aulica, Santiago, Chile, 2003 (in Span-ish).
Saghravani, S., Mustapha, S., Ibrahim, S., and Randjbaran, E.: Comparison of Daily and Monthly Results of Three Evapotran-spiration Models in Tropical Zone: A Case Study, Am. J. Envi-ron. Sci., 5, 698–705, 2009.
Sahin, V. and Hall, M. J.: The effects of afforestation and deforesta-tion on water yields, J. Hydrol., 178, 293–309, 1996.
Spruill, C. A., Workman, S. R., and Taraba, J. L.: Simulation of daily and monthly stream discharge from small watersheds using the SWAT model, Trans. ASAE, 43, 1431–1439, 2000.
Stednick, J. D.: Monitoring the effects of timber harvest on annual water yield, J. Hydrol., 176, 79–95, 1996.
Stehr, A., Debels, P., Romero, F., and Alcayaga, H.: Hydrological modelling with SWAT under limited conditions of data availabil-ity: evaluation of results from a Chilean case study, J. Hydrol. Sci., 53, 588–601, 2008.
Stehr, A., Debels, P., Arum´ı, J. L., Romero, F., and Alcayaga, H.: Combining discharge data and MODIS imagery for evaluating the performance of SWAT and its snowmelt routine in a small Andean basin, Chile, J. Hydrol. Sci., 54, 1053–1067, 2009.
Stowhas, L.: Use of the curve number method in heterogenous watersheds, XVI Congreso de Ingenier´ıa Hidr´aulica, Santiago, Chile, 2003 (in Spanish).
Thanapakpawin, P., Richey, J., Thomas, D., Rodda, S., Campbell, B., and Logsdon, M.: Effects of landuse change on the hydro-logic regime of the Mae Chaem river basin, NW Thailand, J. Hydrol., 334, 215–230, 2007.
Uhlenbrook, S., Roser, S., and Tilch, N.: Development of a dis-tributed, but conceptual catchment model to represent hydrologi-cal processes adequately at the meso shydrologi-cale, J. Hydrol., 291, 278– 296, 2004.
Veldkamp, A. and Lambin, E. F.: Predicting land-use change, Agric. Ecosyst. Environ., 85, 1–6, 2001.
Verburg, P. H., Soepboer, W., Veldkamp, A., Limpiada, R., Espal-don, V., and Mastura, S. S. A.: Modeling the spatial dynamics of regional land use: The CLUE-S model, Environ. Manage., 30, 391–405, 2002.
Van Griensven, A. and Bauwens, W.: Multiobjective autocalibra-tion for semidistributed water quality models, Water Resour. Res., 39, 1348, doi:10.1029/2003WR002284, 2003.
Van Griensven, A., Meixner, T., Grunwald, S., Bishop, T., and Sirinivasan, R.: A global sensitivity analysis tool for the parame-ters of multi-variable catchment models, J. Hydrol., 324, 10–23, 2006.
Van Liew, M. W., Arnold, J. G., and Bosch, D. D.: Problems and potential of autocalibrating a hydrologic model, Trans. ASAE, 48, 1025–1040, 2005.
Van Roosmalen, L., Sonnenborg, T. O., and Jensen, K. H.: Im-pact of climate and land use change on the hydrology of a large-scale agricultural catchment, Water Resour. Res., 45, W00A15, doi:10.1029/2007WR006760, 2009.
Vitousek, P. M., Mooney, H. A., Lubchenco, J., and Melillo, J. M.: Human domination of Earth’s ecosystems, Science, 277, 494– 499, 1997.
![Table 3. Land use transition matrix for the years 1979 and 1994. Values in [ha].](https://thumb-us.123doks.com/thumbv2/123dok_us/9264442.995688/4.595.59.541.273.418/table-land-use-transition-matrix-for-years-values.webp)