Application of Gravitational Search Algorithm
for Planning Distribution Networks with
Multiple Dg Units Based On Their Real and
Reactive Power Delivering Capability
K. Siva Sankari1, S. Nagalakshmi2
1
PG Scholar, 2Associate Professor, Department of Electrical and Electronics Engineering,
Kamaraj College of Engineering and Technology
Abstract— One of the major developments in the Current Distribution Network is the integration of Distributed Generation (DG). Planning the distribution systems without considering the site and size of multiple DG units could result in constraining the network, unpredictable network flows and greater variations in voltage. This paper focuses on planning the distribution network by determining the optimal placements and estimation of multiple DG capacities based on their real and reactive power delivering capability for grid support. For this study, Gravitational Search (GSA) algorithm is applied for optimization. To validate the proposed approach, simulations are performed on IEEE 34 bus radial distribution system. Comparisons are made in terms of Active Power loss deviations, Reactive Power loss deviations and the voltage deviations for all considered four types of DGs. The simulation result obtained indicates that by optimal location and size of Type C DG (delivering both real and reactive power) using GSA minimizes the network losses and voltage deviations than the other three types of DG. To conclude, for enhancing the grid support for the given radial distribution network, Optimal placement of DG with the capability of delivering real and reactive power by using GSA will be more effective.
Keywords— Distributed Generation (DG), Gravitational Search Algorithm (GSA)
I. INTRODUCTION
energy resource and readily available with low environmental impact. In this paper, three Wind turbines are considered which is characterized by its active and reactive power. Reviewing the previous references, optimal location and sizing of DG using various methods, studies have done in minimizing the network losses, maximizing the profit, and minimizing the cost. But there are fewer studies regarding the Voltage improvement and minimizing the voltage deviations in the networks. In addition, there were a few works considering the multiple DG units and categories of DG units based on their real and reactive power delivering capability for the distribution planning. Hence, a method which provides the quality solutions for distribution planning with the consideration of various categories of multiple DG units is required. In this study, Optimal location and sizing of multiple DG units is determined by using Gravitational Search Algorithm (GSA) with the objective of minimizing the Network losses (Active and Reactive) and the Voltage deviations, improving the voltage profile of the radial distribution network. The four categories of the DG units are also modelled and the results are compared in terms of Active Power loss deviations, Reactive Power loss deviations and the voltage deviations for all four types of DGs. The effectiveness of the proposed methodology is tested on Standard IEEE 34 bus radial distribution system.
II. PROBLEMFORMULATION
A. Objective Function
In this paper, location and size of three DG units are determined in such way to minimize the Network losses and Voltage deviations in the given radial distribution network. Thus the objective function consists of two terms namely, Network loss deviations and Voltage deviations. The objective function can be formulated as follows:
) ( )
( i ref
i i loss loss k
k P Q D V V
L
Obj
(1)Where,
k
L - Weighting Factor for the Network losses in branch k
loss
P - Active Power losses in the network
loss
Q - Reactive Power losses in the network
i
D - Weighting Factor for the Voltage deviations in the bus i
i
V - Voltage magnitude at the bus i
ref
V - Voltage reference
i
- Index for busk - Index for the branch
The values of the weighting factors for the Network losses and Voltage deviations are 0.5 each, so as to provide equal importance for the both the network losses and voltage deviations in the objective function.
B. Constraints
The constraints in the optimization process in the proposed work are: Active power losses constraints
Reactive power losses constraints Voltage Constraints
1) Active Power Losses Constraint: The active power losses after installing DG in power grid should be less than or equal to the losses before installing DGs.
P
Ploss with DG loss without DG (2) 2) Reactive Power Losses Constraint: The Reactive Power losses after installing DG in power grid should be less than or
equal to the losses before installing DGs.
Qloss with DG Qloss without DG (3)
3) Voltage Constraint: To ensure the voltage at any bus should be within predefined limits the following constraint is considered:
max min
i i
i V V
V (4) Where,
i
V - bus voltage magnitude
max
i
V - maximum bus voltage magnitude
min
i
DGs can be categorized into four types based on their terminal characteristics in terms of real and reactive power delivering capability as follows [10]:
Type A: DG capable of injecting P only. Type B: DG capable of injecting Q only. Type C: DG capable of injecting both P and Q. Type D: DG capable of injecting P but consuming Q.
Photovoltaic, micro turbines, fuel cells, which are integrated to the main grid with the help of converters/ inverters, are good examples of Type A. Type B could be synchronous compensators such as gas turbines. DG units that are based on synchronous machine (cogeneration, gas turbine, etc.) fall in Type C. Type D is mainly induction generators that are used in wind farms [10].
III.GRAVITATIONALSEARCHALGORITHM
[image:4.612.242.403.294.495.2]Gravitational search algorithm is based on Newton’s law of gravity. In this algorithm, possible solutions of the problem in hand are considered as objects whose performance (quality) is determined by their masses. All these objects attract each other by the gravity force that causes a global movement of the objects towards the objects with heavier masses representing possible solutions to a problem. The heavy masses, which represent best solutions, move more slowly than lighter ones and this represents the exploitation of the algorithm. The problem iterates by changing the positions based on its velocity and acceleration that gets updated in every iteration which depends on fitness function [12]. The flowchart of Gravitational search algorithm is given Fig. 1.
Fig. 1 Flowchart of GSA [11]
IV.CASESTUDY
A. Test System
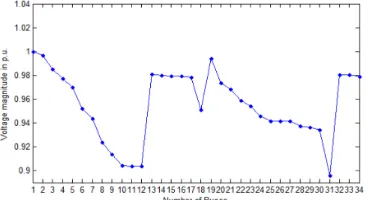
The proposed work is tested on IEEE 34 bus radial distribution system as shown in the Fig. 2. The data for the system are on 100 MVA base. The network has the system voltage of 11 kV and the total real and reactive power demand of 4.636 MW and 2.873 MVAr respectively. Initially, base case load flow (without DG) analysis is done to calculate the bus voltage magnitudes and total network real power loss, reactive power loss. The bus voltage magnitude is shown in the Fig. 3 andthe real power loss and reactive power loss are 223.77 kW, 170.6989 kVAr respectively.
[image:4.612.219.398.608.708.2]Fig. 3 Voltage Magnitude in all buses of IEEE 34 bus Radial Distribution System
The minimum and maximum limits of voltage magnitude at all buses are 1.1 p.u. and 0.9 p.u. respectively. The values of the Scaling Factor (F), Crossover Ratio (CR) for the optimization process are in the range 0.5 to 2 and 0.8 to 0.9 respectively.
B. Test Cases
In this work, to emphasis the importance of types of DG units in planning the distribution network, four cases representing the four types of DG are considered and are listed below.
Case I: With Type A DG
Case II: With Type B DG
Case III: With Type C DG
Case IV: With Type D DG
V. RESULTSANDDISCUSSION
The results of each type of DG are simulated individually and compared in terms of Active Power loss, Reactive Power loss, Voltage Deviations and the Value of Objective function. The location and size of three DG units of each type are also determined.
A. Case I: With Type A DG
[image:5.612.179.435.460.549.2]TABLE I shows the optimization result for the IEEE 34 bus radial distribution system with the integration of Type A DG alone. The optimal location and sizing of three DGs attained are at buses 26, 8, 29 and 155.18 kW, 50 kW, 250 kW respectively. In this case, the Active Power loss is about 83.0856 kW and the reactive power loss is about 71.3678 kVAr. The voltage deviation in all the buses of the test system is confined to 0.00105 p.u. The fitness function value which includes the Network losses, Voltage Deviations and the Voltage constraints with corresponding weighting factors is 74.3696.
TABLE I. SIMULATION RESULT FOR CASE I
DG Parameters Ploss
(kW)
Qloss (kVAr)
Voltage Deviation (p.u.)
Value of Objective Function Location Size
(kW)
26 155.18 83.0856 71.3678 0.00105 74.3696
8 50
[image:5.612.204.420.613.714.2]29 250
Fig. 4. shows the convergence characteristics of implementing DE under Case I. The result converges at 58th Generation. There is no further improvement in the value of the objective function.
Fig. 5 gives the voltage magnitude in all the buses of the networks. The value of Active Power losses and Reactive Power losses in all the 33 branches of IEEE 34 Radial Distribution System for this Case I is shown in Fig. 6-7.
Fig. 5 Voltage Magnitude in all buses for Case I with Type A DG
Fig. 6 Active Power losses in all branches for Case I with Type A DG
Fig. 7 Reactive Power losses in all branches for Case I with Type A DG
B. Case II: With Type B DG
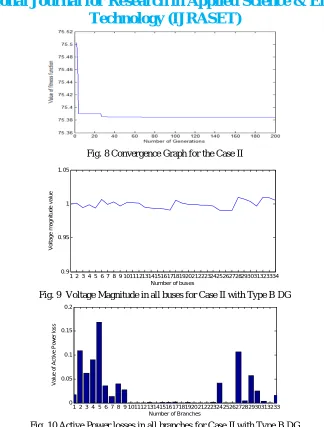
In this case, Type B DG alone is considered and the results are tabulated in TABLE II. The candidate locations of three DG units are 14, 32 and 29 respectively. Their optimal sizing is 237.14 kW, 50 kW and 250 kW respectively. The Active Power loss and the Reactive Power loss for this case are 83.0412 kW and 72.1268 kVAr. The value of voltage deviations in all the buses when integrating this Type B DG is about 0.001224 p.u. The fitness function calculated by considering the network losses and the voltage deviations is 75.3846.
TABLE II. SIMULATION RESULT FOR CASE II
DG Parameters Ploss
(kW)
Qloss (kVAr)
Voltage Deviation (p.u.)
Value of Objective Function
Location Size
(kW)
14 237.14 83.0412 72.1268 0.001224 75.3846
32 50
29 250
Fig. 8 Convergence Graph for the Case II
1 2 3 4 5 6 7 8 9 10111213141516171819202122232425262728293031323334 0.9
0.95 1 1.05
Number of buses
V o lt a g e m a g n it u d e v a lu e
Fig. 9 Voltage Magnitude in all buses for Case II with Type B DG
1 2 3 4 5 6 7 8 9 101112131415161718192021222324252627282930313233 0
0.05 0.1 0.15 0.2
Number of Branches
V a lu e o f A c ti v e P o w e r lo s s
Fig. 10 Active Power losses in all branches for Case II with Type B DG
1 2 3 4 5 6 7 8 9 101112131415161718192021222324252627282930313233 0 0.02 0.04 0.06 0.08 0.1 0.12 0.14 0.16
Number of Branches
V a lu e o f R e a c ti v e P o w e r lo s s
Fig. 11 Reactive Power losses in all branches for Case II with Type B DG
C. Case III: With Type C DG
[image:7.612.190.413.485.613.2]TABLE III. SIMULATION RESULT FOR CASE III
DG Parameters Ploss
(kW) Qloss (kVAr) Voltage Deviation (p.u.) Value of Objective Function Location Size
(kW)
28 132.42 99.3016 86.4478 0.001287 72.5351
5 50
26 250
For this Case III, the Convergence Characteristics is given in Fig. 12. The maximum value of fitness function is 72.5351 and is reached at the 60th Generation. Fig. 13 gives the voltage magnitude in all the buses of the networks. The value of Active Power losses and Reactive Power losses in all the 33 branches of IEEE 34 Radial Distribution System for this Case III are given in Fig. 14-15.
0 20 40 60 80 100 120 140 160 180 200 72.52 72.54 72.56 72.58 72.6 72.62 72.64 72.66 72.68
Number of Generations
[image:8.612.214.389.230.455.2]V a lu e o f F it n e s s f u n c ti o n
Fig. 12 Convergence Graph for the Case III
1 2 3 4 5 6 7 8 9 10111213141516171819202122232425262728293031323334 0.9
0.95 1 1.05
Number of Buses
V o lt a g e m a g n it u d e
Fig. 13 Voltage Magnitude in all buses for Case III with Type C DG
1 2 3 4 5 6 7 8 9 10111213141516 171819202122232425262728 2930313233 0
0.05 0.1 0.15 0.2
Number of Branches
V a lu e o f A ct ive P o w e r lo ss
Fig. 14 Active Power losses in all branches for Case III with Type C DG
1 2 3 4 5 6 7 8 9 101112131415161718192021222324252627282930313233 0 0.02 0.04 0.06 0.08 0.1 0.12 0.14 0.16
Number of Branches
[image:8.612.210.394.597.691.2]V a lu e o f R e a c ti v e P o w e r lo s s
D. Case IV: With Type D DG
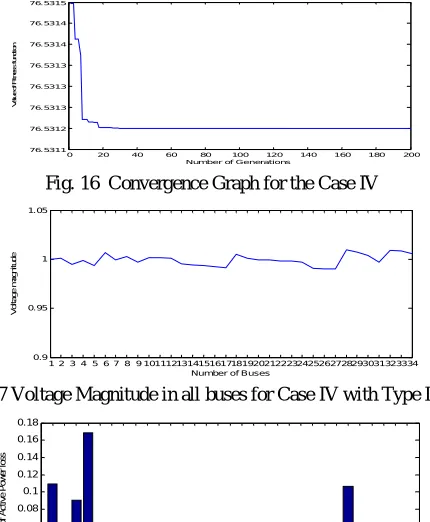
In this case, Type D DG alone is integrated and the results are tabulated in TABLE IV. The candidate locations of three DG units are 19, 32 and 13 respectively. Their optimal sizing are 207.89 kW, 105.07 kW and 224.21 kW respectively. The Active Power loss and the Reactive Power loss for this case are 102.8696 kW and 86.3817 kVAr. The value of voltage deviations in all the buses when integrating this Type D DG is about 0.001086p.u. The fitness function calculated by considering the network losses and the voltage deviations is 76.5312.
TABLE IV. SIMULATION RESULT FOR CASE IV
DG Parameters Ploss
(kW) Qloss (kVAr) Voltage Deviation (p.u.) Value of Objective Function Location Size
(kW)
19 207.89 102.8696 86.3817 0.001086 76.5312
32 105.07
13 224.21
For this Case IV, the Convergence Characteristics is given in Fig. 16. The maximum value of fitness function is 76.5312 and is reached at the 30th Generation. Fig. 17 gives the voltage magnitude in all the buses of the networks. The value of Active Power losses and Reactive Power losses in all the 33 branches of IEEE 34 Radial Distribution System for this Case III are given in Fig. 18-19.
0 20 40 60 80 100 120 140 160 180 200
76.5311 76.5312 76.5313 76.5313 76.5313 76.5314 76.5314 76.5315
Number of Generations
[image:9.612.200.415.302.563.2]V a lu e o f F it n e s s f u n c ti o n
Fig. 16 Convergence Graph for the Case IV
1 2 3 4 5 6 7 8 9 10111213141516171819202122232425262728293031323334 0.9
0.95 1 1.05
Number of Buses
V o lt a g e m a g n it u d e
Fig. 17 Voltage Magnitude in all buses for Case IV with Type D DG
1 2 3 4 5 6 7 8 9 101112131415161718192021222324252627282930313233 0 0.02 0.04 0.06 0.08 0.1 0.12 0.14 0.16 0.18
Number of Branches
V a lu e o f A c ti v e P o w e r lo s s
Fig. 18 Active Power losses in all branches for Case IV with Type D DG
1 2 3 4 5 6 7 8 9 1011121314151617181920 21222324 252627282930313233 0 0.02 0.04 0.06 0.08 0.1 0.12 0.14 0.16
Number of Branches
V a lu e o f R e a c ti v e P o w e r lo s s
E. Comparison of All Test Cases:
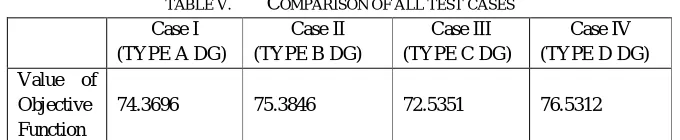
[image:10.612.136.476.113.183.2]The TABLE V shows the Value of objective function for all the four cases considered for the given Radial Distribution Network with three Wind units.
TABLE V. COMPARISON OF ALL TEST CASES
Case I (TYPE A DG)
Case II (TYPE B DG)
Case III (TYPE C DG)
Case IV (TYPE D DG) Value of
Objective Function
74.3696 75.3846 72.5351 76.5312
When compared to others, Case III result is minimum which states that the Network losses including the Active and Reactive Power loss and the Voltage deviations are reduced when the three DG units are injecting both the real and reactive power to the system. To ensure a near optimal solution, for any random trial, the standard deviation should be low. From TABLE VI, the standard deviation of GSA is very low and hence GSA is robust.
TABLE VI. STATISTICAL ANALYSIS OF PERFORMANCE OF GSA WITH TYPE CDG
Compared Terms GSA
Objmin- best 72.5350645027198
Objmin- worst 72.5350645019168
Average value 72.5350645020574
Standard Deviation 1.7961719642151e-10
VI.CONCLUSION
Increasing the number of DG units in power system, Type of DG units and Place and size of DG units are all the important factors in planning the distribution networks and in reducing system Network loss and improve voltage profile. In this paper, Gravitational Search Algorithm is used to determine the optimal location and sizing of three DG units which efficiently minimizes the active power loss, reactive power losses, improve the voltage profile and satisfying all constraints. The proposed algorithm is so fast and efficient and at the same time so accurate in determining the size and location of DG unit(s). Results prove that among the four types of DGs, Type C DG units have better impact on system power loss reduction and system voltage profile improvement.
REFERENCES
[1] Attia El-Fergany, “Optimal Allocation of Multi-type Distributed Generators using backtracking search optimization algorithm”, Electrical Power and Energy Systems, Vol. 64, pp. 1197–1205, 2015.
[2] Pavlos S. Georgilakis, Nikos D. Hatziargyriou, “Optimal Distributed Generation Placement in Power Distribution Networks: Models, Methods, and Future Research”, IEEE Transactions on Power Systems, Vol. 28, No. 3, pp. 3420-3428, 2013.
[3] Mohab M. Elnashar, Ramadan El Shasta, Magdy M.A. Salama, “Optimum sitting and sizing of a large distributed generator in a mesh connected system”, Electric Power Systems Research, Vol. 37, No. 2, pp. 127–145 12, April 2008.
[4] Rashmi Priya, Surya Prakash, “Optimal Location and Sizing of Generator in Distributed Generation System”, International Journal of Innovative Research in Electrical, Electronics, Instrumentation and Control Engineering, Vol. 2, Issue 3, March 2014.
[5] Ruhaizad Ishak, Azah Mohamed, Ahmed N. Abdalla, Mohd Zamri Che Wanik “Optimal placement and sizing of distributed generators based on a novel MPSI index”, Electric Power Systems Research, Vol. 22, pp. 389-398, 21 March 2014.
[6] Sandeep Kaur, Ganesh Kumbhar, Jaydev Sharma, “A MINLP technique for optimal placement of multiple DG units in distribution systems”, Electrical Power and Energy Systems, Vol. 63, pp. 609-617, 13 June 2014.
[7] Faruk Ugranlı, Engin Karate, “Multiple-distributed generation planning under load uncertainty and different penetration levels”, Electrical Power and Energy Systems, Vol. 46, pp. 132-144, 22 November 2012.
[8] Mohamed Imran A, Kowsalya M, “Optimal size and sitting of multiple distributed generators in distribution system using bacterial foraging optimization”, Electrical Power and Energy Systems, Vol. 15, pp. 58-65, 17, December 2013.
[9] Duong Quoc Hung, Nadarajah Mithulananthan, R. C. Bansal, “Analytical Expressions for DG Allocation in Primary Distribution Networks”, IEEE Transactions on Energy Conversion, Vol. 25, No. 3, pp. 814 -820, 2010.
[10] Claudio A. Canizares, “Applications of Optimization to Voltage Collapse Analysis” IEEE/PES Summer Meeting San Diego, Vol. 27, No. 6 July 14, 1998.
[11] S. Nagalakshmi, S. Balakiruthiha, “Application of Gravitational Search Algorithm for Optimal Siting and Sizing of FACTS Devices in Deregulated Electricity Market”, International Journal of Applied Engineering Research, Vol. 10, No. 9, pp. 8975-8981, 2015.
![Fig. 1 Flowchart of GSA [11]](https://thumb-us.123doks.com/thumbv2/123dok_us/8584322.861890/4.612.219.398.608.708/fig-flowchart-of-gsa.webp)