340
©IJRASET (UGC Approved Journal): All Rights are Reserved
Analysis of Surface Roughness in Turning Using
Nano Fluids: Prediction Model and Cutting
Parameters Optimization
A. Venkata Vishnu
1, G. Kiran Kumar
21,2
Asst .Professor, Department of Mechanical Engineering, NNRG, Ghatkesar, Hyderabad, Telangana.
Abstract: Almost all machining process generates heat and friction which leads to damage of the cutting tools as well as the machined work piece. To reduce the friction, heat transfer and to remove metal particles away from the cutting zone normally cutting fluids are used in any machining operation. The present paper outlines an experimental study to optimize the effects of selected cutting parameters i.e. Cutting Speed, Feed rate, Depth of cut and type of tool for Surface Roughness of EN-19 steel alloy using Al2O3 Nano fluid by employing Taguchi robust design methodology. Taguchi orthogonal array is designed with three
levels of turning parameters and the experiments are carried out using L9 (34) orthogonal array. Taguchi method stresses the
importance of studying the response variation using the Analysis of Variance (ANOVA), resulting the minimization of quality characteristic variation due to uncontrollable parameter. The surface roughness is considered as the quality characteristic parameter in the concept of “the smaller the better”. The surface roughness values measured from experiment and their optimum value are calculated. Results obtained by Taguchi Method, shows that the factors affecting the surface roughness are Significant and feed rate is the most influence significant parameter. Multiple Regression equation is formulated for estimating the predicted values for surface roughness.
Keywords: Taguchi Method, EN-19 Alloy, Turning, Surface Roughness, Nano Fluid, Analysis of Variance (ANOVA) etc.
I. INTRODUCTION
The growing demand for higher productivity, product quality and overall economy in manufacturing by machining, insists high surface finish and long life for the cutting tools. But machining with high cutting velocity, feed rate and depth of cut is inherently associated with generation of large amount of heat and high cutting temperatures. Such high cutting temperatures not only reduces dimensional accuracy and tool life but also impairs the surface integrity of the product by inducing tensile residual stresses, surface and subsurface micro-cracks in addition to rapid oxidation and corrosion. Machining temperatures can be controlled by reducing the friction between tool–work-piece and tool–chip interface with the help of effective lubrication. Cutting fluids are the conventional choice to act as both lubricants and coolants [1-4]. Further, the cutting fluids also incur a major portion of the total manufacturing cost.Now a day, the qualitative and quantitative requirement of customer is frequently change. Maintaining the economic production with optimal use of resources is of prime concern for the engineers. Metal machining with various process parameters is one of them. Some challenges that the engineers come across are to find out the optimal parameters for the desired product quality and to maximize the performance of manufacturing using the available resources.
Turning is a very important machining process in which a single-point cutting tool removes material from the surface of a rotating cylindrical work-piece. The cutting tool is fed linearly in a direction parallel to the axis of rotation. The turning is carried out on a lathe that provides the power to turn the work-piece at a given rotational speed and to feed the cutting tool at a specified rate and depth of cut [1, 3].
Application of Nano fluid lubrication in cutting has proved to be feasible alternative to cutting fluids, if it can be applied properly. If the friction at the machining zone can be minimized by providing effective lubrication, the heat generated can be reduced to some extent. If a suitable lubricant can be successfully applied in the machining zone, it leads to process improvement. Several studies related to the lubrication properties of Nano fluids are carried out over the past several decades. It has been found, that Nanofluids have much higher and strongly temperature dependent thermal conductivity at very low particle concentration, which is considered to be a key parameter for enhanced performance for many of the applications [6, 7]
II. MATERIALSANDMETHOD
341
©IJRASET (UGC Approved Journal): All Rights are Reserved
Variance are employed to study the performance characteristics for the selected process parameters. The turning operations (facing) are carried out on CNC machine and the machine used is WASINO LJ-63m CNC Turning Machine shown in fig.no.1.
The work piece material used is EN19 steel in the form of round bars of 30 mm diameter and length of 120 mm as shown in fig.no.2. EN19 is widely used for Machining components in various industries. This material has significant application in automotive industry. Typical applications of this material are crown wheel, crown pinion, bevel pinion, bevel wheel, timing gears, king pin, pinion shaft, differential turning etc. The cutting inserts used for machining are CNMG carbide tools of KORLEY Company, which are Gold coated, silver coated and uncoated Carbide tools as shown in the fig.no.3.
Selection of cutting fluid is important in order to maintain better tool life, less cutting forces, lower power consumption, high
[image:3.612.190.392.198.349.2]machining accuracy and better surface integrity etc. In the present ork alumina (Al2O3) Nano particles are mixed with water,
Fig. No. 1: CNC Lathe
as a base fluid used is water, to make Al2O3 Nanofluid. Five grams of Al2O3 Nano particles are directly mixed with 100 ml of water
[image:3.612.224.389.394.621.2]as a base fluid with a mixture of triethanol amine.
Fig. No. 2: EN19 Alloy Steel
Fig. No.3. Cutting tool Inserts
The four control factors Cutting speed (A), feed rate (B), Depth of Cut(C) and type of tool (D) are selected with three levels and the
corresponding orthogonal array L9 (34) is chosen with respect to its degrees of freedom[1-5] and are tabulated in Table No.1. Steel
342
©IJRASET (UGC Approved Journal): All Rights are Reserved
Fig. No. 4 Machining of EN 19 alloy steel
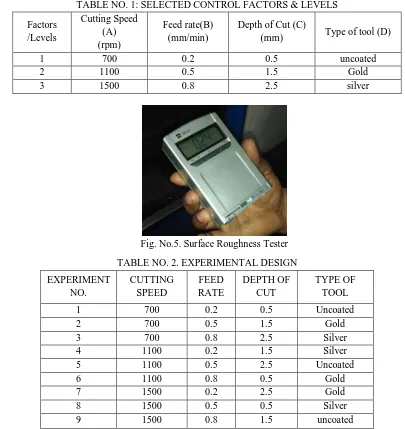
[image:4.612.231.393.77.183.2]The measurement of surface texture is done by Pick up Type Piezoelectric method. The parameter evaluations are microprocessor based. The measurement results are displayed on an LCD screen. The Tester is placed on the surface of the specimen and switched on. When the pickup is driven by a driver is making a linear motion along the testing surface, the stylus which touches with the work surface moves up and down along the work surface perpendicularly. Its motion is converted into electric signal, which are amplified, filtered and transformed into digital signals through an Analogue to Digital. The signals are then processed by CPU and Ra values displayed on the screen
TABLE NO. 1: SELECTED CONTROL FACTORS & LEVELS
Factors /Levels
Cutting Speed (A) (rpm)
Feed rate(B) (mm/min)
Depth of Cut (C)
(mm) Type of tool (D)
1 700 0.2 0.5 uncoated
2 1100 0.5 1.5 Gold
3 1500 0.8 2.5 silver
Fig. No.5. Surface Roughness Tester
TABLE NO. 2. EXPERIMENTAL DESIGN
EXPERIMENT NO.
CUTTING SPEED
FEED RATE
DEPTH OF CUT
TYPE OF TOOL
1 700 0.2 0.5 Uncoated
2 700 0.5 1.5 Gold
3 700 0.8 2.5 Silver
4 1100 0.2 1.5 Silver
5 1100 0.5 2.5 Uncoated
6 1100 0.8 0.5 Gold
7 1500 0.2 2.5 Gold
8 1500 0.5 0.5 Silver
[image:4.612.99.504.304.733.2]343
©IJRASET (UGC Approved Journal): All Rights are Reserved
III. RESULTS&DISCUSSIONS
A. Selection of Optimum Set of Conditions for Surface Roughness
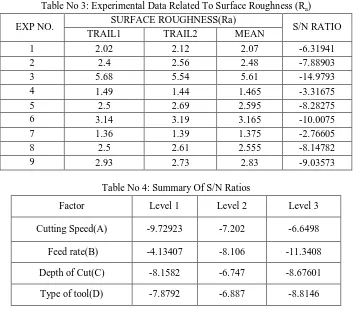
[image:5.612.130.483.155.464.2]The surface roughness is measured precisely with the help of a portable surface roughness tester TR110 and the results are tabulated in table no 3 for two trails. For each experiment the corresponding S/N values are also tabulated. Optimization of surface roughness is carried out using Taguchi method. Confirmatory test have also been conducted to validate optimal results.
Table No 3: Experimental Data Related To Surface Roughness (Ra)
EXP NO. SURFACE ROUGHNESS(Ra) S/N RATIO
TRAIL1 TRAIL2 MEAN
1 2.02 2.12 2.07 -6.31941
2 2.4 2.56 2.48 -7.88903
3 5.68 5.54 5.61 -14.9793
4 1.49 1.44 1.465 -3.31675
5 2.5 2.69 2.595 -8.28275
6 3.14 3.19 3.165 -10.0075
7 1.36 1.39 1.375 -2.76605
8 2.5 2.61 2.555 -8.14782
9 2.93 2.73 2.83 -9.03573
Table No 4: Summary Of S/N Ratios
Factor Level 1 Level 2 Level 3
Cutting Speed(A) -9.72923 -7.202 -6.6498
Feed rate(B) -4.13407 -8.106 -11.3408
Depth of Cut(C) -8.1582 -6.747 -8.67601
Type of tool(D) -7.8792 -6.887 -8.8146
[image:5.612.98.511.547.615.2]The best condition for cutting speed is level 3 (-6.6498), for feed rate is level 1 (-4.13407), for depth of cut is level 2 (-6.747) and type of tool is level 2 (-6.887). Thus, the optimum conditions chosen were: A3-B1-C2-D2. A confirmation test is performed with the obtained optimum cutting parameters, the surface roughness is measured and the S/N ratio is calculated for this condition. The conformation test results are tabulated in the table no 6.
Table No 5: Optimum Set Of Control Factors For Flooded
Factors /Levels Speed (A)
(rpm)
Feed (B) (mm/min)
Depth Of Cut (C) (mm)
Type of tool (D)
Optimum Value 1500 0.2 1.5
Gold coated carbide tip
B. Prediction of Process Average for Optimum Condition and performing conformation test for Surface Roughness:
From table no.4 the following the predicted value, calculations are done,
η predicted=[ A3+B1+C2+D2]-3Y
= [-6.6498-4.13407-6.747-6.887] – [3X (-7.8604)] η predicted= -0.8372
344
©IJRASET (UGC Approved Journal): All Rights are Reserved
Table no 6. Conformation results
Surface Roughness
S/N RATIO
1 2 Average
[image:6.612.187.425.80.193.2]1.11 1.21 1.16 -1.28916
Table no 7. Comparison of s/n ratios
η predicted -0.8372
η conformation -1.28916
C. Effect of Cutting Parameters on Surface Roughness
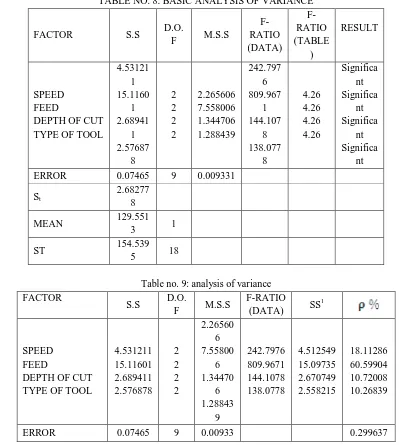
[image:6.612.100.499.287.732.2]The ANOVA calculation is performed for the results obtained i.e. surface roughness values using nano fluids. The calculations are done manually and compared with the Minitab Statistical Software version 18 and it is verified. The model was checked at 95% confidence level for the adequacy. From the ANOVA it is observed that all the factors selected (Cutting speed, Feed rate, Depth of cut and type of tool conditions) are significant shown in Table No.8.
TABLE NO. 8: BASIC ANALYSIS OF VARIANCE
FACTOR S.S D.O.
F M.S.S
F-RATIO (DATA) F-RATIO (TABLE ) RESULT SPEED FEED
DEPTH OF CUT TYPE OF TOOL
4.53121 1 15.1160 1 2.68941 1 2.57687 8 2 2 2 2 2.265606 7.558006 1.344706 1.288439 242.797 6 809.967 1 144.107 8 138.077 8 4.26 4.26 4.26 4.26 Significa nt Significa nt Significa nt Significa nt
ERROR 0.07465 9 0.009331
St
2.68277 8
MEAN 129.551
3 1
ST 154.539
5 18
Table no. 9: analysis of variance FACTOR
S.S D.O.
F M.S.S
F-RATIO
(DATA) SS
1
SPEED FEED
DEPTH OF CUT TYPE OF TOOL
4.531211 15.11601 2.689411 2.576878 2 2 2 2 2.26560 6 7.55800 6 1.34470 6 1.28843 9 242.7976 809.9671 144.1078 138.0778 4.512549 15.09735 2.670749 2.558215 18.11286 60.59904 10.72008 10.26839
345
©IJRASET (UGC Approved Journal): All Rights are Reserved
1
St 2.682778
MEAN 129.5513 1
ST 154.5395 18 100%
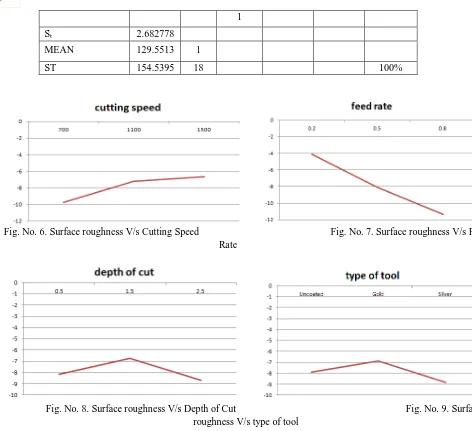
Fig. No. 6. Surface roughness V/s Cutting Speed Fig. No. 7. Surface roughness V/s Feed
Rate
Fig. No. 8. Surface roughness V/s Depth of Cut Fig. No. 9. Surface
roughness V/s type of tool
The S/N ratios effect plots for surface roughness are shown. The level of parameter with the highest S/N ratio is the optimal level. From Figure No 6, it is observed that, the surface roughness is high at high cutting speed and certainly decreasing from high cutting speed to moderate speed conditions and from moderate to low cutting speeds, the surface roughness decreases.
From Figure No 7, it is observed that, the surface roughness is high at low Feed Rate conditions and certainly decreasing from low feed rate to moderate condition and from moderate to high feed rate, the surface roughness decreases.
From Figure No 8, it is observed that, the surface roughness is low at small depth of cut and certainly increasing from small depth of cut to moderate depth of cut conditions, and from moderate to high depth of cut, the surface roughness decreases.
From Figure No 9, it is observed that, the surface roughness is high when Gold coated tool is used and roughness decreased when uncoated tool is used than to silver coated tool, compared to Silver and uncoated tool Gold coated tool has high surface roughness.
D. Multiple Regression Model
[image:7.612.78.550.67.498.2]346
©IJRASET (UGC Approved Journal): All Rights are Reserved
[image:8.612.212.398.207.292.2]The first three variables are Quantitative and the left fourth parameter is Qualitative. So in order to include the effect of type of tool material on Surface roughness, it must assign a set of levels to the Qualitative variable. This is done with the help of Indicator variables (also known as Dummy variables). As there are three levels for Qualitative tool material (type of tool material=3), two indicator variables are to be considered, each taking 0 and 1. Its a particular combination of the two indicator variables X1 and X2 represents type of carbide tool material. In general, a Qualitative variable with “n” levels is represented by “n-1” indicator variables, each taking on the values 0 and 1. Table 10 shows levels of the Qualitative variables and type of tool material by the set of indicator variables. Now apart from the three quantitative variables, two indicator variables with each combination 0 or 1 represent the tool type [1].
Table no. 10: specification of qualitative variables
Tool material Indicator variables
X1 X2
Uncoated 0 1
Gold 1 0
[image:8.612.128.486.314.636.2]Silver 0 0
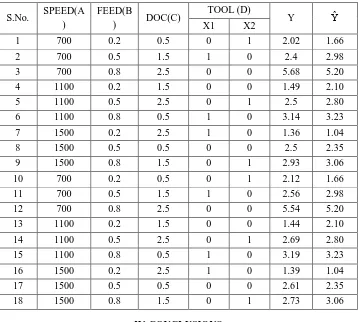
Table no. 11: regression analysis for surface roughness
S.No. SPEED(A
)
FEED(B
) DOC(C)
TOOL (D)
Y Ŷ
X1 X2
1 700 0.2 0.5 0 1 2.02 1.66
2 700 0.5 1.5 1 0 2.4 2.98
3 700 0.8 2.5 0 0 5.68 5.20
4 1100 0.2 1.5 0 0 1.49 2.10
5 1100 0.5 2.5 0 1 2.5 2.80
6 1100 0.8 0.5 1 0 3.14 3.23
7 1500 0.2 2.5 1 0 1.36 1.04
8 1500 0.5 0.5 0 0 2.5 2.35
9 1500 0.8 1.5 0 1 2.93 3.06
10 700 0.2 0.5 0 1 2.12 1.66
11 700 0.5 1.5 1 0 2.56 2.98
12 700 0.8 2.5 0 0 5.54 5.20
13 1100 0.2 1.5 0 0 1.44 2.10
14 1100 0.5 2.5 0 1 2.69 2.80
15 1100 0.8 0.5 1 0 3.19 3.23
16 1500 0.2 2.5 1 0 1.39 1.04
17 1500 0.5 0.5 0 0 2.61 2.35
18 1500 0.8 1.5 0 1 2.73 3.06
IV. CONCLUSIONS
The objective of the present work is to find out the set of optimum control parameters in order to reduce
surface roughness, using Taguchi’s techniques for the EN 19 Steel Alloy material and to develop prediction
models for the factors by using multiple regression analysis. Based on the results of the present investigations
the following conclusions can be drawn:
1)In the present experimentation the optimum cutting speed obtained using Taguchi Robust Design Methodology is 1500rpm.
347
©IJRASET (UGC Approved Journal): All Rights are Reserved
that the parameters obtained are valid and within the range of EN 19 machining standards. The corresponding Type of tool is Gold coated.
2)Analysis of Variance suggests that the selected process parameters are significant in which the Feed rate has most significant
[image:9.612.168.470.166.336.2]factor for the surface roughness. Whereas, Cutting Speed, Depth of Cut and Type of tool appears to have very little effect over roughness value. An increment of Feed rate will result in better surface quality in terms of Surface roughness.
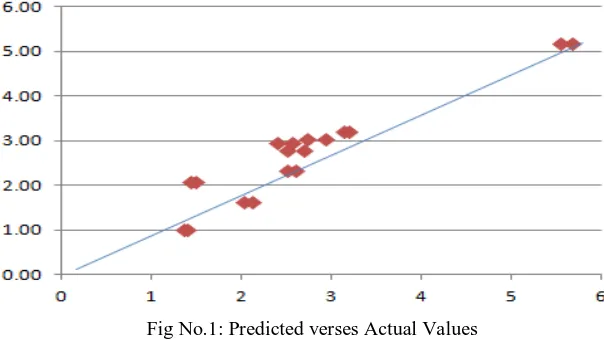
Fig No.1: Predicted verses Actual Values
3)The S/N ratio of predicted value and verification test values are valid when compared with the optimum values. It is found that
S/N ratio value of verification test is within the limits of the predicted value and the objective of the work is full filled.
4)Multiple Regression analysis has been successfully implemented to develop multiple regression prediction models using the
predictors cutting speed (A), feed rate (B), depth of cut (C) and type of tool (X1 & X2) conditions, the regression equation is Ŷ
=2.46111-0.00141A+3.71944B+0.29833C-0.87X1-0.711X2.
5)The scatter plot from Fig No.10 shows the relation between the predicted values at Y axis and the observed values at X axis. From
the graph it is observed that the prediction values obtained from final model and actual experiment data are efficiently in good agreement, this concludes the results were within acceptable limits
REFERENCES
[1] M. Venkata Ramana, A. Venkata Vishnu, G. Krishna Mohan Rao, D. Hanumantha Rao, “Experimental Investigations, Optimization Of Process Parameters And Mathematical Modeling In Turning Of Titanium Alloy Under Different Lubricant Conditions”, IOSR Journal of Engineering (IOSRJEN) www.iosrjen.org ISSN : 2250-3021 Vol. 2 Issue 1, Jan.2012, pp. 086-101.
[2] M. Venkata Ramana, A. Venkata Vishnu, G. V. Surekha G. Krishna Mohan Rao, D. Hanumantha Rao, “Optimization and Effect of Process Parameters on Tool Wear In Turning of Titanium Alloy under Different Lubricant Conditions”, International Conference on Materials Processing and Characterization, Gokaraju Rangaraju Institute of Engineering and Technology, Hyderabad, March 8-10, 2012, pp 154-167.
[3] A.Venkata Vishnu, K B G Tilak, G. Guruvaiah Naidu, Dr.G.Janardhana Raju “Optimization of Different Process Parameters of Aluminium Alloy 6351 in CNC Milling Using Taguchi Method”, International Journal of Engineering Research and General Science, ISSN: 2091-2730,Nepal, Vol.3 Issue 2, March-April-2015.
[4] A .Venkata Vishnu, G. Guruvaiah Naidu, K B G Tilak, J.Ramakrishna, “Application of Taguchi Method in the Optimization of Turning Parameters for Material Removal Rate of En-36 Material”, International Journal of Advance Engineering and Research Development E-ISSN (O): 2348-4470 P-ISSN (P): 2348-6406, Volume 2, Issue 8, August-2015.
[5] A.Venkata Vishnu, K B G Tilak, Ch.Pranav Srivatsav, “Optimization and Regression Analysis for Surface Roughness in Milling of EN-31 Steel Alloy Material”, International Conference on Challenges and Emerging Trends in Management & Technology (ICCEMT), Nalla Narasimha Reddy Educational Society Group of Institutions, Hyderabad, December-2015.
[6] Das, S.K., Choi, S.U., Yu, W., Pradeep, T., 2008. Nanofluids – Science and Technology; Wiley – Interscience: Hoboken, NJ.
[7] Vasu, V., Reddy, P.K.G., 2011. Effect of minimum quantity lubrication with Al2O3 nanoparticles on surface roughness, tool wear and temperature dissipation in machining Inconel 600 alloy. Proc Inst Mech Eng Part N J. Nanoengineering and Nanosystems. 225, 3-16.
[8] Joseph Emmanuel and Rahul Davis “An Experimental Study and Analysis of Surface Roughness in Wet Turning Operation of EN 353 Steel”, International Journal of Current Engineering and Technology ISSN 2277-4106-INPRESSCO, Vol.3, No.3 (August 2013).
[9] Minitab Statistical Software Features - Minitab. (2011),"Software for Statistics, Process Improvement, Six Sigma, Quality –Minitab [10] HMT "Production Technology", Tata McGraw Hill, 2004.