Land Cover Classification Using Sentinel-1 SAR
Data
K. V. Ramana Rao1, Prof. P. Rajesh Kumar2 1
Department of ECE, VIEW, Visakhapatnam, Andhra Pradesh, India – 530046 2
Department of ECE, A.U.C.E, Visakhapatnam, Andhra Pradesh, India– 530003
Abstract: The role of polarimetric Synthetic Aperture Radar (SAR) data available from various airborne and space borne sensors is increasing in various remote sensing applications which include land use/land cover classification and also change detection of an area over a period of time. The dual polarization (VV & VH) polSAR data of Sentinel-1, a space borne sensor is used in the present study of land use/land cover classification of Visakhapatnam, a fastest developing city in the state of Andhra Pradesh, India. This polSAR data has been collected on October 19th 2014 along the descending orbit over Visakhapatnam area. This data has been pre-processed using the techniques such as calibration, terrain correction and also filtered with a 5x5 kernel with gamma map approach. During the process of terrain correction this polarimetric SAR data has been resampled with a pixel spacing of 20m. Various classification algorithms such as Iso data, K-means (Unsupervised) and Parallelepiped, Mahalanobis, Maximum Likelihood, Minimum Distance, Artificial Neural Net and Support Vector Machine (Supervised) have been implemented for the land use/land cover classification of the study area. The land use/land cover classification has been analyzed with the available individual polarization data VV, VH and also the combination of VV and VH. Post processing of the classification results has been done using the confusion matrix (also known as error matrix) and corresponding overall accuracy and Kappa coefficients of all the classification methods have been calculated. It is observed from the results that the overall accuracy obtained from the combination of VV&VH polarizations increases up to 100% against 80.09% and 96.86% of using individual polarization VV and VH, respectively. It is also observed that overall accuracy and Kappa coefficient of Support Vector Machine classifier are high compared to other classification methods. This analysis makes it clear that dual polar metric Sentinel-1SAR data can be effectively used for accurate land cover classification, along with other advantages of urban planning and management of developing areas.
Keywords: Sentinel-1A, SAR, Support Vector Machines, Land-use/land-cover classification, Accuracy
I. INTRODUCTION
Land-use/land-cover (LULC) classification has got lot of importance for preparing the maps of developing cities since this information is very useful for many applications such as agriculture (Bargiel 2011), biodiversity(Falcucci 2017), urbanization(Geymen 2008),(Liu H. and weng Q. 2013), natural environment analysis(Ullmann 2014)and hazard assessment(Van der Sande 2003).Today many earth observation satellites are available because of the recent advancement in remote sensing technology enabling the close monitoring of the earth surface. Due to various reasons like population growth, natural calamities, and climatic changes, lot of research is going on for the protection and management of natural resources in many countries. The land cover classification can be done more effectively by efficient utilization of remote sensing data(Friedl 2010).The land-use/land-cover information of any area can be monitored continuously and consistently using the data sets available from Synthetic Aperture Radars (SAR)(Balzter 2015). Moreover, when meteorological conditions are not favorable to acquire optical data, SAR data can be used for land cover classification. In addition to this, cloud-free images will be provided by SAR satellites(Longepe 2011)(Niu 2013), (Balzter 2015). Various Image classification techniques are available to extract the information from the available SAR data sets to identify different types of the land cover with respect to the pixel values of the SAR image. The dual orbit, multi-temporal and fully polarimetric RADARSAT-2 data has been used for obtaining the land cover mapping(Niu 2013)using the intensity information with polarimetric parameters to increase the accuracy of land cover classification.
agriculture and forest were transformed into urban class(Geymen 2008). The previous studies reported that Visakhapatnam suffers from natural disaster and other phenomena due to its geological structure and human activities. In fact, high accuracy is preferred by the planning and development of any urban area to obtain the land cover mapping. In order to support the mapping of land- cover/land-use, up-to-date information is crucial. The main aim of this paper is to analyze the Sentinel-1A SAR data sets for the land cover classification and mapping using amplitude information of dual polarimetric SAR imagery(Abdikan 2015).
A. Study Area
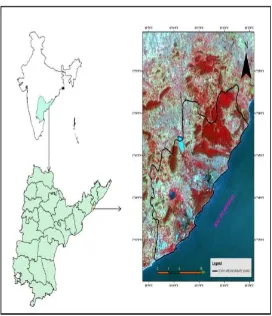
[image:3.612.170.442.219.535.2]The study area is Visakhapatnam, a smart city in the State of Andhra Pradesh, India. The investigation has been carried out in an area of 621.52 sqkm. The city is head quarters of Visakhapatnam District. The city is located between 170 10' and 170 56' N latitude and 830 08' and 830 40' E longitude (Fig: 1). It is bounded by Orissa state and Vizianagaram district on North side , East Godavari district towards South, Orissa state towards West and Bay of Bengal towards East .
Figure-1 Location Map of the Study Area
B. Data Used
Specifications Sentinel-1A data Acquisition time October 19th 2014 Acquisition orbit Descending
Imaging Mode IW
Imaging frequency C-band (5.4GHz)
Polarization VV-VH
Data product Level-1 GRD Resolution mode 20 m (Full resolution)
Table-1. Specifications of Sentinel-1A data
Figure-2 Backscattered Image (R: VH, G: VV, B: VH+VV)
C. Pre-Processing
The Level-1 product of Sentinel-1 GRD data is calibrated, filtered by a 5X5 kernel using gamma map approach and terrain corrected before application. During terrain correction a 25m SRTM-DEM data has been used and the data was re-sampled to a pixel size of 20m ground resolution. The SAR data is converted into backscattering values in terms of decibels (db). Pre-processing was conducted using ESA Sentinel-1 toolbox (S1TBX) in the Sentinel’s Application Platform provided by ESA.
II. RESULTS AND DISCUSSIONS
Various classification methods have been implemented for the land use/land cover classification of the study area which include both unsupervised(Isodata, K-means) and supervised(Parallelepiped, Mahalanobis, Maximum Likelihood, Minimum Distance, Artificial Neural Net and Support Vector Machine) for mapping different land cover types.Since the supervised classification algorithm Support VectorMachine (SVM) is a machine learning algorithm it has been widely used and tested many times in remote sensing in both optical and radar data for image classification Error! Reference source not found., Error! Reference source
not found.. The principle of SVM is to define an optimal hyperplane to maximize margin width by using training subsetError!
Reference source not found.. In the present study, the Radial Basis Function (RBF) is used Error! Reference source not
found. and optimum parameters were determined as 0.333 and 100 for kernel width and penalty parameter, respectively. Further
details of this method could be found in Error! Reference source not found.. Confusion matrix assessment was applied to compare the accuracy of classified images.For the optimum utilization of available dual polarimetric SAR data of Sentinel-1 individual polarization data sets of VV , VH along with combination of both VV & VH cases were considered and various classification methods have been implemented to obtain the better accuracy results.
S.no Data sets
3 (VV+VH)
Table-2.Datasets for land cover classification
In the present study three data sets of different polarizations were defined for image classification, and impact of variables was evaluated. First, each polarimetric data was classified as single variable and the results show that VHpolarimetry has slightly higher accuracy than VVpolarimetry. The accuracy for VH, VV and (VH&VV) images were found 96.86%, 80.09% and 100% respectively. When the combined dual polarization SAR data (VV&VH) is used for classification of the study area the resulting overall accuracy has been increased compared to the accuracy obtained with the individual polarization data sets of VV and VH. The images obtained after the classification is done corresponding to different polarization data sets VV,VH and combination of VV&VH are shown in Figure 3, Figure 4 and Figure 5 respectively. The water class is extracted clearly even when the single polarization data set(VV) is used as shown in the figure 1where as the urban class could not be extracted in this case. It is also observed that some misclassification can be seen near the hilly parts of the study area.
Figure-3Support Vector Machine Classified Image only VH (Blue: Water, White:Urban, Red:Vegetation and Yellow:Baresoil)
Figure-4 Support Vector Machine Classified Image (VH+VV) (Blue: Water, White:Urban, Red:Vegetation and Yellow:Baresoil)
Figure-5 Parallelepiped Classified Image
(Blue: Water, White: Urban, Red: Vegetation and Yellow: Bare soil)
Figure-5 Minimum Distance Classified Image
Figure-6Mahalanobis Distance Classified Image
(Blue: Water, White: Urban, Red: Vegetation and Yellow: Bare soil)
Figure-7 Maximum Likelihood Classified Image
(Blue: Water, White: Urban, Red: Vegetation and Yellow: Bare soil)
Figure-7 Artificial Neural Net Classified Image
(Blue: Water, White: Urban, Red: Vegetation and Yellow: Bare soil)
A. Accuracy Assessment
Classification Overall Accuracy Kappa Coefficient
Unsupervised Classification
Isodata 71.645 0.622
K-Mean 73.160 0.642
Supervised Classification
Parallelepiped 90.045 0.858
Minimum Distance 90.087 0.861
Mahalanobis 91.388 0.879
Maximum Likelihood 98.950 0.985
Artificial Neural Net 99.257 0.990
Support Vector Machine VH 96.862 0.958
Support Vector Machine (VH+VV) 100.000 1.000 Table-3. Accuracy Assessment for various classifications
III. CONCLUSIONS
In this study, the performance of Sentinel-1 SAR data sets was evaluated. It is aimed to figure out the potential of using only SAR data sets over a complex megacity for land cover classification. In order to increase the accuracy of image classification results, different variables are created by dual polarimetric data and different scenarios were also tested. The experimental results indicate that different scenarios provide different results depending upon the corresponding variables. Using combined imagery (VV+VH) as a third variable into the classification resulted in higher accuracy than individual polarization data imagery. The revisit time of Sentinel-1B is 6 days of systematic image acquisition. Hence it provides the data sets frequently for the analysis of land cover classification. The results indicate that dual polarized IW Sentinel-1A is best suited for rapid land cover classification using SAR data sets. The results obtained in this study may be useful as a reference for further analysis of Sentinel-1 data of other cities.
BIBLIOGRAPHY
[1] S.Abdikan, F.B.Sanli, M.Ustuner,F.Calo. ""Land cover mappping using Sentinel-1 SAR data"." The Inn Sciencesternational Archives of the Photogrammetry, Remote Sensing and Spatial Informati XLI-B7 (2016).
[2] bdikan, S., Bilgin, G., Sanli, F.B., Uslu, E., Ustuner, M.,. “Enhancing land use classification with fusing dual-polarized TerraSAR-X and multispectral Rapid Eye data.” Journal of Applied Remote Sensing 9(1), 096054 (2015).
[3] bdikan, S., Bilgin, G., Sanli, F.B., Uslu, E., Ustuner, M.,. “Enhancing land use classification with fusing dual-polarized TerraSAR-X and multispectral Rapid Eye data.” Journal of Applied Remote Sensing 9(1), 096054 (2015).
[4] Balzter, H., Cole, B., Thiel, C., Schumullius, C.,. “Mapping CORINE Land Cover from Sentinel-1A SAR and SRTM Digital Elevation Model using Random Forests.” Remote Sensing, no. 7 (2015): pp.14876-14898.
[5] Bargiel, D., Herrmann, S.,. “Multi-Temporal Land-Cover Classificationof Agricultural Areas in Two European Regions with High Resolution Spotlight TerraSAR-X Data.” Remote Sensing, no. 3 (2011): pp. 859-877.
[6] Congalton, R.G., Gu, J., Yadav, K., Thenkabail, P., and Ozdogan M.,. “Land Cover Mapping: A Review of Uncertainity Analysis.” Remote Sensing 6 (2014): 12070-12093
[7] Falcucci, A., Maiorano, L., Boitani L.,. “Changes in land-use/land-cover patterns in Italy and their implications for biodiversity conservation.” Landscape Ecology 22, no. 4 (April 2017): 617-631.
[8] Friedl, M.A., Sulla-Menashe, D., Tan, B., Schneider, A., Ramankutty, N., Sibley, A., Huang, X.,. “MODIS Collection 5 global land cover: Alogorithm refinements and characterization of new datasets.” Remote Sensing of Environment, no. 114 (2010): 168-182
[9] Geymen, A. and Baz, I.,. “Monitoring urban growth and detecting land-cover changes on the Istanbul metropolitan area.” Environ Monit Assess, no. 136 (2008): 449-459
[10] Kavzoglu, T., and Colkesen, I.,. “A kernel functions analysis for support vector machines for land cover classification.” International Journal of Applied Earth Observation and Geoinformation, no. 11 (2009): 352-359
[11] Liu H. and weng Q. “Land scape metrics for analysing urbanization-induced land use and land cover changes.” Geocarto International 28, no. 7 (2013): 582-593
[12] Longepe, N., Rakwatin, P., Isoguchi, O., Shimada, M., Uryu, Y., Yulianto, K.,. “Assessment of ALOS-PALSAR 50m Orthorectified FBD data for Regional Land cover Classification by Support Vector Machines.” IEEE Transactions on Geoscience and Remote Sensing 49, no. 6 (2011): 2135-2150
[13] Melgani, F., and Bruzzone, L.,. “Classification of hyperspectral remote sensing images with support vector machines.” IEEE Transactions on Geoscience and RFemote Sensing, no. 42 (2004): 1778-1790
[14] Mountrakis, G., Im, L., Ogole, C.,. “Support Vector Machines in Remote Sensing- A review.” ISPRS J. of Photogramm. and Remote Sen., no. 66 (2011): 247-259
[15] Nagler, T., Rott, H., Hetzene cker, M., Wuite, J., Potin, P.,. “The Sentinel-1 Mission; New oppurtunities for Icesheet observations.” Remote Sensing 7 (2015): 9371-9389.
[16] Niu, X., and Ban, Y.,. “Multi Temporal RADARSAT-2 polarimetric SAR data for Urban Land cover Classification using an Object-based Support Vector Machine and a rule-based approach.” International Journal of Remote Sensing, no. 34 (2013): 1-26.
[17] S.Abdikan, F.B.Sanli, M.Ustuner,F.Calo. “"Land cover mappping using Sentinel-1 SAR data".” The Inn Sciencesternational Archives of the Photogrammetry, Remote Sensing and Spatial Informati XLI-B7 (2016)
[18] Sertel E., Robock A., Ormeci C.,. “Impacts of land cover data quality on regional climate simulations.” International Journal of Climatology, no. 30 (2010): 1942-1953.
[19] Ullmann, T., Schmitt, A., Roth, A., Duffe, J., Dech, S., Hubberten, H.W., Baumhauer, R.,. “Land Cover Characterization and Classification of Architect Tundra Environments by means of polarized Synthetic Apertu