Technology (IJRASET)
©IJRASET 2013: All Rights are Reserved
217
Performance Evaluation of Image Encryption
Using Separable Reversible Data Hiding Scheme
Smitha.M1, Karthik.V.J 2
1Assistant Professor, Department of Biomedical Engineering, PSNA College of Engineering and Technology, Dindigul, India
2Senior Engineer – Connected Car, Harman International India Private Limited, Bengaluru, India
Abstract— Image Encryption has a significant role in the field of cryptography. In the proposed scheme compression technique is introduced after the encryption and data hiding process to reduce the image size for faster transmission. Encryption scheme, two separate keys are used for image encryption and data hiding with high degree of security to protect an image from unauthorized access. The content owner encrypts the original uncompressed image using an encryption key. The least significant bits (LSBs) of the encrypted image are compressed using a data hiding key to create a space to embed an additional data. Run - Length Coding (RLC) and Haar Wavelet compression technique is employed. At the receiver end, quality of image retrieval and data extraction are achieved only from RLC with their respective keys. Extracted image quality is analyzed by conventional and subjective metrics index are measured. Image Quality Assessment (IQA) technique shows the quality of retrieved image is same as that of the original image.
Keywords— Cryptography, Encryption, Haar Wavelet, Run Length Coding.
I. INTRODUCTION
Recently, secured transmission of images plays an important role in the field of cryptography. Cryptography is the process of transforming the information into an unreadable format for protecting the information. RLC is a lossless compression technique used for reducing the spatial redundancy in an image. Comparative results of lossless data compression algorithm results are presented [1]. Haar wavelet lossy compression technique is used for compressing an image with sudden transitions. Haar wavelet is used to model the space – frequency localization to analyze and model the property of Human Visual Systems (HVS) is explained [2]. Encryption allows only the content owner to retrieve the image. Data hiding is the message in an image file [3]. Without the usage of key, authors had hidden a data in a binary image based on the number of occurrence of 0’s and 1’s in last bit of all the pixel of binary image file [4]. The local standard deviation of marked encrypted images for removing embedded data in the decryption is analyzed [5].
In [6] encryption key is used for image encryption and the data embedding is performed in an image using data hiding key, drawback at the decryption stage is only if data – hiding key and encryption key is known, then with the aid of spatial correlation in natural image embedded data is extracted correctly and original image is recovered perfectly. Medical images are encrypted using stream cipher algorithm and data hiding key is used to embed the encrypted image with patient information in the non – Region of Interest (ROI) area of an image is presented [7]. A new encryption algorithm to maintain the quality of image based on random pixel permutation is proposed [8]. In digital images several lossless data hiding methods such as digital, multimedia watermarking techniques and lossless encoding techniques is used [9]. The encoder compresses the source and encrypts a bit stream using a secret key before transmitting over a public channel, the decoder decrypts the received bit stream and then decompresses the result [10]. A lossless data hiding scheme which uses an edge detector to locate plain areas for data embedding in digital images is discussed [11]. A new image encryption method is presented by the authors by selecting specific higher frequencies of DCT coefficients as characteristic values for encryption and then the encrypted blocks are shuffled according to pseudorandom bit sequence [12]. The authors divided the original image into number of blocks are shuffled within an image and then fed to the Blowfish encryption algorithm [13]. A new permutation technique is developed by the authors based on the combination of image permutation and a newly developed encryption algorithm called hyper image encryption algorithm is explained [14].
Technology (IJRASET)
©IJRASET 2013: All Rights are Reserved
218
presented in [18], to enable the exact recovery of the original host signal upon extraction of the embedded information by generalizing the well-known least significant bit (LSB) modification and introduces additional operating points on the capacity-distortion curve, so lossless recovery of the original is achieved by compressing portions of the signal that are susceptible to embedding distortion and transmitting these compressed descriptions as a part of the embedded payload. A novel method is proposed in [19], for hiding the data based on neighborhood pixels information to calculate the number of bits that can be used for substitution and modified Least Significant Bits technique for embedding the data. In [20], a novel high capacity data hiding method is framed for JPEG images by employing a capacity table to estimate the number of bits that can be hidden in each DCT component so that significant distortions in the stego-image can be avoided. A fair performance comparison is performed between the various cryptography symmetric and asymmetric techniques based algorithms such as the Advanced Encrypted Standard (AES), Rivest-Shamir-Adleman (RSA), Rivest Cipher (RC2), Data Encryption Standard (DES), 3DES, Digital Signature Algorithm (DSA) are discussed [21] and these encryption algorithms are not employed in our proposed scheme because of its disadvantages. In [22], a novel feature similarity (FSIM) index for full reference IQA is proposed based on the fact that human visual system (HVS) understands an image mainly according to its low-level features using Phase Congruency as the primary feature in FSIM. The performance of eleven selected full reference Image Quality Assessment (IQA) algorithms is tested on all the seven public IQA image datasets in [23].
This paper presents a novel separable reversible data hiding scheme combined with compression techniques. Compression technique is employed in addition with the existing separable reversible data hiding technique [24] for faster transmission. An analysis is made with both lossy Haar wavelet and lossless RLC compression techniques. From the analysis better image and data retrieval is achieved in lossless compression technique. Hardware implementation is done for image encryption and decryption process under Xilinx ISE simulator. An overview of the remaining sections of this article is as follows. Section 2 demonstrates the proposed scheme. Image encryption technique using image encryption key is described in section 2.1. Section 2.2 gives an overview of data embedding scheme with data hiding key. Section 2.3 deals with the lossy and lossless compression techniques using Haar wavelet and RLC. Section 2.4 describes the decryption phase recovers the content with their respective keys. Section 3 shows the simulation results of the proposed scheme. Data embedding and image encryption process: results, application and extension of this research are concluded in section 4.
II. PROPOSED SCHEME
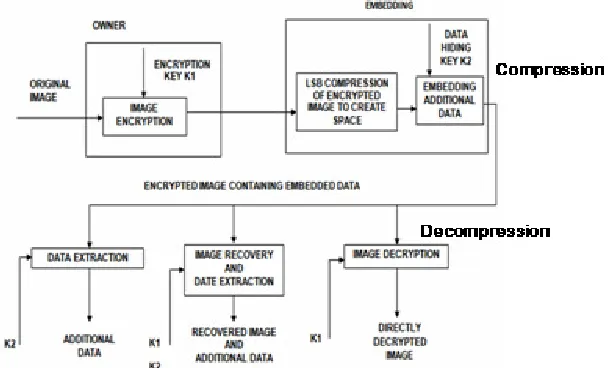
[image:3.612.158.462.521.705.2]Normally encryption is done after compression for better image retrieval. In this scheme, compression techniques are employed after the encryption to extract the content with high degree of accuracy and compression ratio. The owner of the original image uses an 8 - bit binary encryption key to encrypt the uncompressed image. Data is embedded into the encrypted image using a 28 – bit data hiding key. Compression process is carried out using lossy and lossless compression techniques. Decompression is performed and contents are retrieved based on their respective keys. Decryption phase, image encryption key is used to recover the image and data hiding key is used to extract the embedded data. Simultaneous extraction of image and data is also possible when both the keys are present. Steps need to process the proposed scheme is clearly shown in Figure 2.1.
Technology (IJRASET)
©IJRASET 2013: All Rights are Reserved
219
A. Image Encryption
Eight bit binary encryption key (k1) is employed in the original uncompressed gray scale image of size N1 x N2 and the gray values of each pixel are falling in [0,255]. In the encryption process for obtaining encrypted pixel Exclusive–OR operation is carried out among original bit and binary encryption key.
B i, j,u= b i, j,u⊕⊕⊕⊕ r i, j,u
(1) where b i ,j,u is the bit representation for a pixel, r i,j,u is the binary key for encryption. B i,j,u is concatenated in the same order as
that of encrypted data.
B. Data Embedding
In the data embedding, embed some parameters into the small number of encrypted pixels and then create some space for accommodating additional data by compressing the LSB of the encrypted pixels. The original data occupies the positions of parameters. Data embedding steps are summarized as follows:
Encrypted pixels NP are selected pseudo randomly to hide the data using data hiding key k2. M, L and S are the parameters selected by the user to calculate, number of pixels to be taken from least significant bit, number of groups and number of bits to be embedded in an uncompressed encrypted image.
For example:
User defined parameters are M=2, L=15, S=2 and randomly selected Encrypted pixel NP =16. No. of Groups = (N - NP)/L = (256-16)/15=16.
In each pixel group, M - LSB are collected out of L pixels and denoted as B ( k , 1 ), B ( k , 2 ),…., B ( k , M . L).
k is a group index. 30-bits are chosen from all sixteen groups. Out of 30 bits, the 28 bits are compressed by using G matrix and the remaining 2-bits are used for data hiding.
compressed by using G matrix and the remaining 2-bits are used for data hiding.
(2)
where the left part is an identity matrix sized ( ML – S)(ML – S). The right part is the Q matrix sized (ML – S)S is a pseudo – random binary matrix. Finally the G matrix size is obtained as 28 x 30.Compressed matrix B’ is obtained from
(3)
From equation (3) right part of the matrix [B (k, 1), B (k, 2),……, B (k, ML) are compressed as (ML – S) i.e. 28 bits in the space available for data accommodation.
In each group, the original LSB of selected encrypted pixels and the additional data to be embedded is denoted as [B’ (k, (ML) – S + 1), B’ (k, (ML) – S + 2),…….., B’( k, ML).
Replace [B(k, 1), B(k,2),….., B(k, ML)] with the new [B’(k,1), B’(k,2),……,B’(k, ML), and put it in the original position using inverse permutation.
Embedding Rate is given by
R=S / L (4)
C. Compression Technique
Compression Technique is mainly employed to compress an image for faster content transfer. Two types of compression techniques used to observe the efficient content recovery are
Haar Wavelet Lossy Compression Technique RLC Lossless Compression Technique
1) Lossy Compression Technique: Haar wavelet operation is performed on data by calculating the sums and differences of adjacent
element. Haar wavelet is performed first on adjacent horizontal elements and then adjacent vertical elements. The advantage of Haar wavelet is analysis of sudden transitions present in an image is possible. Haar wavelet technique is not continuous one so we cannot differentiate easily, based on this problem image retrieval and data extraction has not met the expected result and also the image size
G = [ I M . L - S Q ]
=
B ' ( k , 1 ) B ( k , 1 ) B ' ( k , 2 ) B ( k , 2 )
G . B ' ( k , M L - S ) B ( k , M L )
Technology (IJRASET)
©IJRASET 2013: All Rights are Reserved
220
is not reduced.
2)Lossless Compression Technique: In lossless compression technique, RLC is employed for the encrypted image with embedded
data. The value of gray level pixels along a row of sequence in a digital image is considered as integers. Length of the constant gray level pixel value along the row is represented by ni. The run length coding takes the advantage of spatial redundancy in the image. The added advantages are easy implementation and faster execution but it cannot be used for short run length of gray level pixel values. The image size is compressed up to 20 KB using run length coding. By using this lossless compression technique before transmission, image retrieval and data extraction is possible as that of the original content.
D. Data Extraction And Image Recovery
Reverse process of compression is the initial step at the receiver side. There are three cases in the receiver side after the decompression process.
Case 1: If the receiver has only the data – hiding key, parameters M, L and S are obtained from the LSB of NP selected encrypted pixels. Receiver finds the permutation of M, L and S values and then the remaining (N - NP) pixels are divided into (N - NP)/ L groups and S number of embedded bits are also extracted from the M LSB – planes of each group. Using data hiding key at the receiver end, received bits are (N - NP)(S/L) and further the bits are divided by NP to get selected encrypted (N - NP)(S/L) pixel and (N - NP)(S/L - NP) additional bits. Unauthorized person is impossible to obtain the parameter values and the pixel groups without the knowledge of NP value, calculation of the way of permutation and the data – hiding key, so the embedded data cannot be extracted. If the receiver has the data – hiding key, data embedded can be extracted, but the information about the original image content is unknown.
Case 2: If the receiver has only the image encryption key but not the data – hiding key, the original image can be recovered. Bits of pixels in the encrypted image containing embedded data is denoted as B׳ i,j,0, B׳ i,j,1, ……, B׳ i,j,7 (1≤ I ≤ N1 and 1≤ j ≤ N2), decrypting the received encrypted image containing embedded data is calculated using equation (5).
(5)
Here exclusive – OR is performed for encrypted image and binary encryption key to retrieve the original image. where b׳ i,j,u is the bit representation of the original image, r i,j,u is the binary encryption key, B׳ i,j,u is the encrypted image containing embedded data. Data – embedding operation will not alter any Most Significant Bit (MSB) of encrypted image. Hence, the content of decrypted image is similar to the original image. According to equation (3), if B (k, ML – S+1) = B (k, ML – S +2) = ………. = B (k, ML) = 0, there is
(6) The probability is 1/2s and there the original (ML – S) bits in the M LSB – planes can be correctly decrypted. The distortion at the
other S decrypted bits is ignored because S is less than ML. If B( k, ML – S + 1), B (k, ML – S + 2), B (k, ML) ≠ 0, the encrypted data in the M LSB – planes is altered in the data – embedding operation, so the decrypted data in the M LSB – planes is different from the original data. In this case the probability is (2s – 1)/2s and the average distortion is
(7)
Ignore the distortion in the NP encrypted pixels because their number is less than the image size N1 x N2 =N. Hence the value of PSNR is directly calculated in the decrypted image.
)
(
log
.
10
10A
EPSNR
=
(8)Case 3: Receiver receives both the data – hiding and the encryption key for embedded data extraction and original image recovery. The value of M, L, S, NP and addition bits are extracted from the encrypted image using data – hiding key for data extraction. After placing the NP-LSB in their original position, the encrypted data of the NP is selected and encrypted pixels are retrieved. Using encryption key, original gray values are decrypted. Original gray values are replaced in the remaining (N - NP) pixels. Transpose of equation (3) is equation (9) to get an original image.
(9)
b 'i , j , u = B 'i , j , u ⊕⊕⊕⊕ ri , j , u
B ' (k , v) = B (k , v), v = 1,2,. . . . ., M . L-S
2 1
2 )
−
∑
∑
S S -2 M A E = (2 - 1 ) / 2 . 2 .
M M
2 − 1 2 − 1 2 − 1 2 − 1
(α − β (α − β (α − β (α − β
α = 0 β = 0 α = 0 β = 0α = 0 β = 0 α = 0 β = 0
Technology (IJRASET)
©IJRASET 2013: All Rights are Reserved
221
where a sized 1x S is an arbitrary binary vector and H is an SxML made from transpose of Q and S x S is an identity matrix (10)
By considering (3) there are 2s possible solutions of [B ( k, 1), B ( k, 2),……., B(k, M . L)]T. In each vector v, the elements are put in the original positions to get an encrypted pixel group and using encryption key the pixel groups are decrypted. Decrypted pixel group is denoted as Gk and t i,j is the gray value, then the total difference is calculated between the decrypted pixel values and the estimated gray values in the groups. (11)
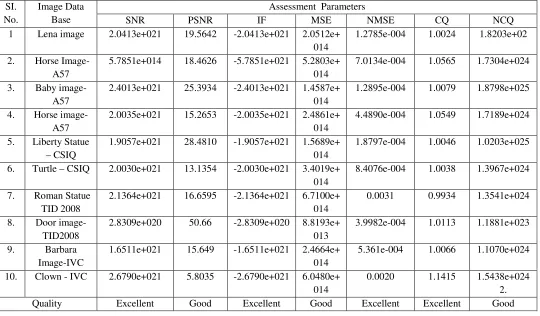
In the directly decrypted image gray values are estimated by
1 1, /2 1, /2 , 1/2 , 1/2 . ,
4
2 2
M M M M M M
pi j pi j pi j pi j
pi j
′− + +′ + ′ − + ′ + + −
=
(12)
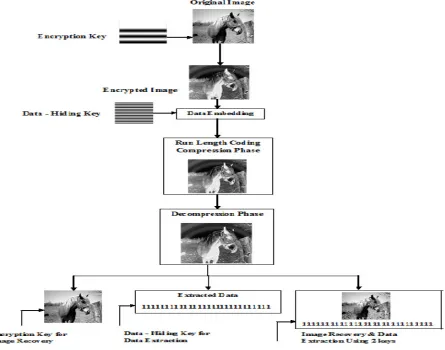
[image:6.612.87.532.345.695.2]In equation (12) the estimated gray values are dependent on the MSB of neighboring pixels. Thus there are 2s different D are obtained relating to the 2s decrypted pixel group Gk. In the 2s decrypted pixel group, there should be only one gray values and possesses a low D because of the spatial correlation in natural image. By finding the smallest D, actual vector v is denoted as [B (k, 1), B (k, 2),……., B(k, ML)] T and the decrypted t i,j is denoted as the recovered content. Since, the number of pixels in a group, original content is recovered by exploiting the spatial correlation. The computation complexity of the recovered content is O (N2s) because 2s different D must be calculated in each group. In order to achieve low computation complexity S should be less than ten and only four neighboring pixels are used to calculate the estimated gray values. Figure 2.2 shows the proposed scheme flow with their output results.
Figure 2.2 Image encryption and data embedding flow diagram
T H = [ Q IS ]
| |
∈
∑
Technology (IJRASET)
©IJRASET 2013: All Rights are Reserved
222
III. HARDWARE IMPLEMENTATION
The design of image encryption and decryption algorithm is implemented using FPGA XC3S100E. FPGA is an array of programmable logic cells interconnected by a matrix of wires and programmable switches. In the user instructions, simple logic function is defined for each cell. In FPGA large number of these cells can be used as building blocks in complex digital circuits. Custom hardware is difficult to develop. Efficient implementation of the desired function in the custom processor is performed by manipulating the logic at the gate level. FPGAs are mostly used in implementing high performance digital signal processing systems, digital communications, image and video processing applications. FPGAs have high memory bandwidth than that of microprocessors and DSP processors.
[image:7.612.173.378.256.325.2]FPGA implementation is done for encryption and decryption phase. The input image is given to the FPGA kit and then the encryption process is done by downloading the VHDL code for synthesizing to configure a device. The decryption is performed after the encryption process. In the decryption phase, the user should provide the correct key to retrieve the image. The text image used should be of the size 32 x 32 because the memory capacity is very low to store the pixel values of the image in the FPGA kit. The results obtained from the FPGA kit is shown in Figure 3.1(a) and Figure 3.1(b).
Figure 3.1 Hardware implementation of (a) Encrypted image and (b) Decryption image
IV. RESULTS AND DISCUSSION
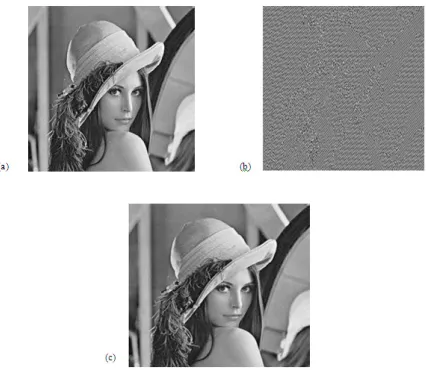
The Lena image sized 512 x 512 is used as the test image shown in Figure 4.1(a). At the image encryption phase the gray scale pixel values are encrypted using a standard 8-bit binary encryption key as shown in Figure 4.1(b). Then 34.95 x 10³ additional bits are embedded into the encrypted image by considering M=2, L=15, S=2. The embedding rate R is 0.1333 bit per pixel (bpp). The data – hiding key is used to extract the additional data embedded in the encrypted image. The encrypted image is decrypted using the encryption key as shown in Figure 4.1(c).
Figure 4.1 RLC Compression Technique Results, (a) Tested image, (b) Encrypted image and (c) Decrypted image
[image:7.612.191.404.438.623.2]Technology (IJRASET)
©IJRASET 2013: All Rights are Reserved
223
characteristics of the human visual system to measure the total perceptual error. The value of PSNR in the directly decrypted Lena image is obtained as 56.6292 dB. Higher PSNR value gives better quality. By using haar wavelet compression technique it is observed that the image quality is poor as shown in Figure 4.2(a) and also data extraction is not accurate, results are shown in simulated waveform in Figure 4.2(b). So, run length coding compression technique is used for compressing an encrypted image for better image recovery and data extraction. PSNR value obtained from the different tested images is shown in Figure 4.3.
Figure 4.2 (a) Image Retrieval from Haar Wavelet Compression (White grains are present inside the image)
Figure 4.2 (b) Simulation result showing data extractions using Haar wavelet
[image:8.612.216.375.145.286.2] [image:8.612.103.451.504.674.2]
Technology (IJRASET)
[image:9.612.86.528.88.711.2]©IJRASET 2013: All Rights are Reserved
224
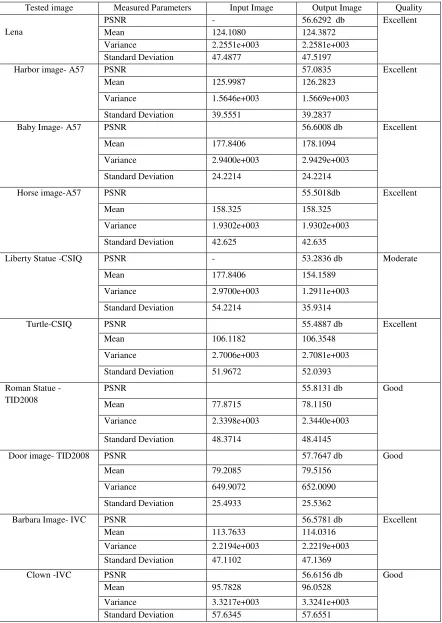
Table 4.1 Performance analysis results tested between input and output images
Tested image Measured Parameters Input Image Output Image Quality
PSNR - 56.6292 db
Mean 124.1080 124.3872
Variance 2.2551e+003 2.2581e+003
Lena
Standard Deviation 47.4877 47.5197
Excellent
PSNR 57.0835
Mean 125.9987 126.2823
Variance 1.5646e+003 1.5669e+003
Harbor image- A57
Standard Deviation 39.5551 39.2837
Excellent
PSNR 56.6008 db
Mean 177.8406 178.1094
Variance 2.9400e+003 2.9429e+003
Baby Image- A57
Standard Deviation 24.2214 24.2214
Excellent
PSNR 55.5018db
Mean 158.325 158.325
Variance 1.9302e+003 1.9302e+003
Horse image-A57
Standard Deviation 42.625 42.635
Excellent
PSNR - 53.2836 db
Mean 177.8406 154.1589
Variance 2.9700e+003 1.2911e+003
Liberty Statue -CSIQ
Standard Deviation 54.2214 35.9314
Moderate
PSNR 55.4887 db
Mean 106.1182 106.3548
Variance 2.7006e+003 2.7081e+003
Turtle-CSIQ
Standard Deviation 51.9672 52.0393
Excellent
PSNR 55.8131 db
Mean 77.8715 78.1150
Variance 2.3398e+003 2.3440e+003
Roman Statue -TID2008
Standard Deviation 48.3714 48.4145
Good
PSNR 57.7647 db
Mean 79.2085 79.5156
Variance 649.9072 652.0090
Door image- TID2008
Standard Deviation 25.4933 25.5362
Good
PSNR 56.5781 db
Mean 113.7633 114.0316
Variance 2.2194e+003 2.2219e+003
Barbara Image- IVC
Standard Deviation 47.1102 47.1369
Excellent
PSNR 56.6156 db
Mean 95.7828 96.0528
Variance 3.3217e+003 3.3241e+003
Clown -IVC
Standard Deviation 57.6345 57.6551
Technology (IJRASET)
©IJRASET 2013: All Rights are Reserved
225
From the Table 4.1, PSNR values are high, which shows image quality is good. Mean, variance and standard deviation values of input image (original image) are equal to values of an output image (decrypted image). This result shows statically decrypted image is equals to the original image (pixel values are unaltered).
V. MODEL SIM RESULTS FOR ENCRYPTION AND DECRYPTION
The input test image is obtained from various image databases, such as TID 2008, CSIQ, IVC and A57. The encryption and decryption processes are performed using Model Sim. The algorithm follows
Step 1: Input image pixel values are written into a text file using MATLab.
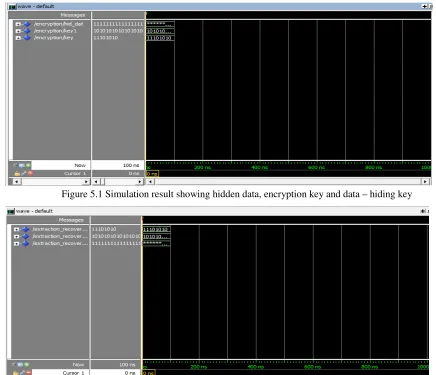
Step 2: Encryption Key is used to encrypt the image and data – hiding key is used to embed additional data using VHDL codes in Model Sim. Hidden data, data – hiding and encryption key key simulation result shown in Figure 5.1.
Step 3: Run length coding compression/ Haar Wavelet compression is performed using Xilinx ISE simulator.
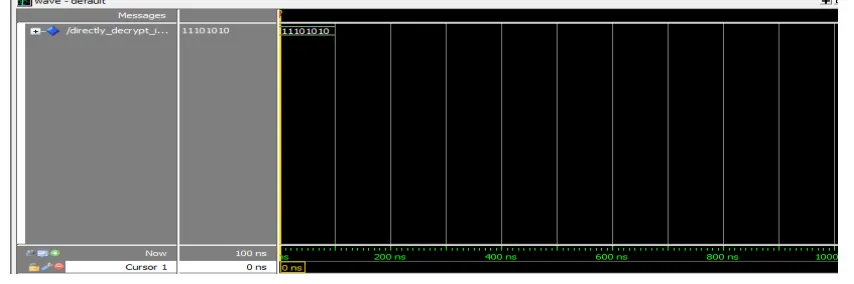
Step 4: Decompression is performed and then Decryption is done using respective keys in Xilinx ISE simulator. Simulation result of combined form of image and data extraction using their respective keys based on RLC Compression technique is shown in Figure 5.2.
[image:10.612.75.511.298.673.2]Step 5: Data Extraction and Image retrieval is performed in Xilinx ISE simulator. and the text file data is imported using MatLab to display the output image. Image retrieval and data recovery based on RLC is shown in Figure 5.3(a) and Figure 5.3(b).
Figure 5.1 Simulation result showing hidden data, encryption key and data – hiding key
Technology (IJRASET)
©IJRASET 2013: All Rights are Reserved
226
Figure 5.3 (a). Simulation result showing image retrieval
Figure 5.3 (b). Simulation result showing data recovery
VI. PERFORMANCE ANALYSIS
The efficiency of the system is analyzed from the quality of the system output image. Image assessments are carryout by subjective quality measure and objective quality measure. With the rapid advancement in digital imaging and communication technologies, Image Quality Assessment (IQA) has been an important issue in numerous applications like image acquisition, transmission, compression, restoration and enhancement. In real – time and automated systems subjective IQA methods cannot be readily and routinely used, so objective IQA metrics is developed to measure the image quality automatically with robustness. Objective measure metrics are divided into three categories, based on the amount of information retrieval from the original image. There are full reference, no reference and reduced reference. The most common reference quality metrics (Conventional metrics) are Signal-to- Noise Ratio (SNR), Peak Signal-Signal-to-Noise Ratio (PSNR), Image Fidelity (IF), Mean Square Error (MSE), Normalized Mean Square Error (NMSE), Correlation Quality (CQ) and Normalized Correlation Quality (NCQ). Commonly used reduced reference quality metrics (subjective metrics) are Feature Similarity Index Measure (FSIM), Feature Similarity Index Measure chrominance information (FSIMc), Visual signal – to – noise ratio (VSNR), Multi-Scale Structural Similarity (MS-SSIM) is overlaid on SSIM, Visual Information Fidelity (VIF) and Information Fidelity Criteria (IFC). IQA algorithms are tested on TID2008, CSIQ, IVC and A 57 database images.
A. Conventional Image Quality Metrics
In 1999, the conventional metrics method is used in analyzing the system performance. Various IQA methods are used to test the Image Quality (IQ) in the past decades. SNR is defined as the ratio of signal power to the noise power and compares the level of a desired signal to the level of background noise. SNR value is greater than 1, indicates more signal than the noise.
m,n
~
m,n I m,n I
m,n I m,n SNR
∑
− Σ =
2
[image:11.612.91.518.88.230.2] [image:11.612.93.506.254.378.2]Technology (IJRASET)
©IJRASET 2013: All Rights are Reserved
227
PSNR measures the ratio between the maximum possible power of a signal and the power of corrupting noise affecting the fidelity of its representation. Many signals have a very wide dynamic range expressed in terms of logarithmic decibel scale. PSNR also measures the quality of reconstruction of lossy compression code. In this case, Signal is the original data and noise is the error introduced while performing compression. Higher PSNR indicates that reconstructed image is of higher quality and not true in all cases. The quality of reconstruction compressed image is measured by PSNR value using equation No.14. PSNR is defined via IF and MSE.
m,n
~
m,n
I
m,n
I
m,n
I
m,n
Max
mn
PSNR
∑
−
×
=
2
2
(14)Image Fidelity (IF) is an accurate representation of an image without any loss of information. The difference between an original and a compressed image is less and then the compression process is considered to be visually lossless. The judgment is based on the human visual models.
∑ ∑ − − = m,n m,n I m,n ~ m,n I m,n I IF 2 2
1 (15)
MSE is defined for a noise – free m x n monochrome image I and its noisy approximation K.PSNR also measures the quality of reconstruction of lossy compression code. In this case,
2 1 ∑ − × = m,n ~ m,n I m,n I mn
MSE (16)
The NMSE (Normalized Mean Square Error) is used in estimating the overall deviations between predicted and measured values. Low NMSE value indicates that deviations of measured values when compared to predicted values in less and vice versa. Correlation Quality (CQ) measures the perceived image degradation compared to an ideal or perfect image. Quality assessment is an important problem because imaging systems may introduce certain amount of distortion in the signal. Normalized Correlation quality (NCQ) is used in pattern matching to recognize and locate specific objects in an image. Correlation is a direct measure of similarity between two images. Though sensitive to the scaling or rotation of objects, normalized correlation is robust to changes in lighting. Formula used to find the value of CQ and NCQ is
∑ ∑ − = m,n m,n I m,n ~ m,n I m,n I NMSE 2 2 (17)
∑
∑
×
=
m,n
m,n
I
m,n
m,n
~
I
m,n
I
Technology (IJRASET)
©IJRASET 2013: All Rights are Reserved
228
∑
∑
=
m,n
m,n
I
m,n
~
n
m
I
m,n
I
NCQ
2
,
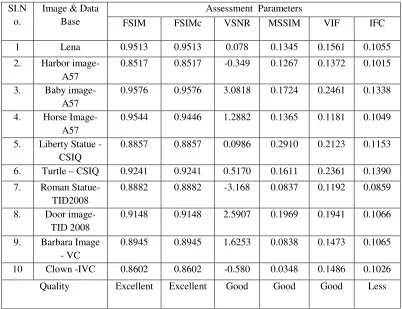
(19) [image:13.612.39.579.207.523.2]Conventional metrics method performance analysis reports are listed in Table 6.1. From Table 2 IQ assessment results obey the conventional metrics values.
Table 6.1 Performance analysis report under conventional metrics method
B. Subjective Image Quality Metrics
The conventional metrics like PSNR and MSE operates directly on intensity of image and does not correlate with the subjective fidelity ratings. Thus, many efforts have been put on designing Human Visual System (HVS) based IQA metrics. IQA uses computational models to measure the image quality consistently with subjective evaluations.
Feature Similarity Index Measure (FSIM) for full reference IQA is based on the fact that human visual system understands an image mainly based on its low level features. The primary feature in FSIM is Phase Congruency (PC), a dimensionless measure of the significance of a local structure. PC is contrast invariant while contrast information affects the HVS perception of image quality, so image Gradient Magnitude (GM) is considered as the secondary feature in FSIM. PC and GM characterize the local quality of an image. If local similarity map is obtained, then PC is used as a weighting function to derive a single quality score. FSIM is designed for grayscale images and chrominance information can be obtained by FSIMc. Multi-Scale Structural Similarity (MS-SSIM) is overlaid on SSIM. The algorithm is calculated for multiple SSIM values at multiple image resolutions. By using this algorithm at different image resolution, the quality of image is evaluated for different viewing distances. MS-SSIM has less impact on luminance component compared to the contrast and structure components. SSIM is calculated to increase the correlation between the MS-SSIM index and subjective quality tests. MS-MS-SSIM algorithm takes longer time to run than the straight MS-SSIM algorithm.
Visual signal – to – noise ratio (VSNR) quantifies the visual fidelity of natural images based on near – threshold and supra threshold Assessment Parameters
SI. No.
Image Data
Base SNR PSNR IF MSE NMSE CQ NCQ 1 Lena image 2.0413e+021 19.5642 -2.0413e+021 2.0512e+
014
1.2785e-004 1.0024 1.8203e+02
2. Horse Image- A57
5.7851e+014 18.4626 -5.7851e+021 5.2803e+ 014
7.0134e-004 1.0565 1.7304e+024
3. Baby image-A57
2.4013e+021 25.3934 -2.4013e+021 1.4587e+ 014
1.2895e-004 1.0079 1.8798e+025
4. Horse image-A57
2.0035e+021 15.2653 -2.0035e+021 2.4861e+ 014
4.4890e-004 1.0549 1.7189e+024
5. Liberty Statue – CSIQ
1.9057e+021 28.4810 -1.9057e+021 1.5689e+ 014
1.8797e-004 1.0046 1.0203e+025
6. Turtle – CSIQ 2.0030e+021 13.1354 -2.0030e+021 3.4019e+ 014
8.4076e-004 1.0038 1.3967e+024
7. Roman Statue TID 2008
2.1364e+021 16.6595 -2.1364e+021 6.7100e+ 014
0.0031 0.9934 1.3541e+024
8. Door image-TID2008
2.8309e+020 50.66 -2.8309e+020 8.8193e+ 013
3.9982e-004 1.0113 1.1881e+023
9. Barbara Image-IVC
1.6511e+021 15.649 -1.6511e+021 2.4664e+ 014
5.361e-004 1.0066 1.1070e+024
10. Clown - IVC 2.6790e+021 5.8035 -2.6790e+021 6.0480e+ 014
Technology (IJRASET)
©IJRASET 2013: All Rights are Reserved
229
properties of human vision. VSNR is a two – stage approach. In the first stage, wavelet – based models are used for visual masking and visual summation to determine the visible distortions in the distorted image. Second stage is applied based on low – level visual property of global precedence. VIF is measured in between distorted image and reference image information. VIF is bounded below by zero; the information is a non – negative quantity, indicating that all information about the reference image is lost in the distortion channel. In case, if image is not distorted then VIF is found to be unity. For all practical distortion, VIF lies in the interval [0 1]. VIF values are larger than unity, and then the retrieved image has a superior visual quality than the reference image.
The QA problem has an information fidelity (IFC) problem. A natural image source communicates with the receiver through a channel. The channel has a limit on how much information could flow from the source (reference image), through the channel (image distortion process) to the receiver (human observer). These problems are dealt by analyzing them in an information theoretic framework, to quantify the mutual information between the input and output of the channel using source model and distortion model. Subjective based image quality assessments are analysis using web code link as http://ssim.rivetsforbreakfast.com/.
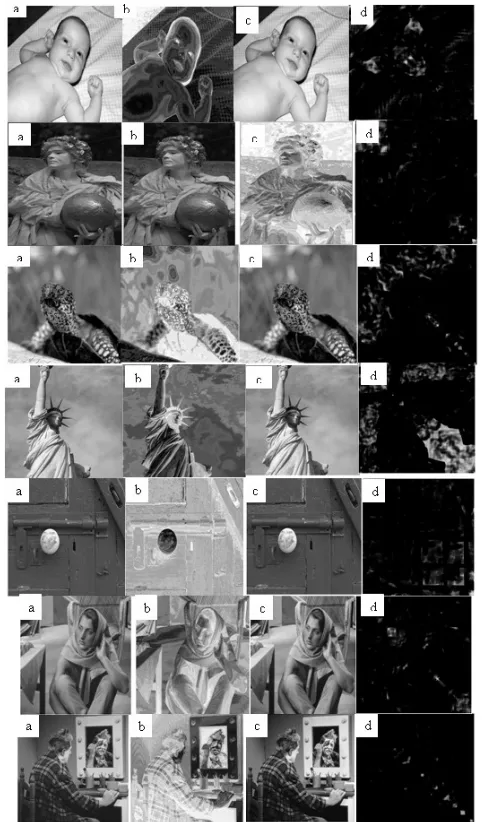
From Table 6.2 subjective image quality metric values are satisfied, so structural quality and visual quality of an image is not affected by encryption and decryption process in the proposed compression technique. Evaluations are carried out by using publicly available image data base, including TID 2008, CSIQ, IVC and A57, there a) Original image, b) Encrypted image, c) decrypted image and d) SSIM map images are shown in Figure 6.1.
C. Error Computation
The quality of image is assessed using an error image showing pixel – by – pixel errors. The difference between the corresponding pixels of the retrieved image and the original image creates the error image. It is hard to see error -free retrieved images because zero difference is black and most errors are represented as small numbers which are represented as black. The computation is performed using the following formula and their corresponding results are shown in Figure 6.2.
Error image = Original image – Retrieved image (20)
[image:14.612.105.507.404.713.2]If the error image is fully black, then the retrieved image is of minimum error. If the error image is fully white, then the retrieved image is of maximum error.
Table 6.2 Performance analysis report under subject based image quality assessment Assessment Parameters
SI.N o.
Image & Data
Base FSIM FSIMc VSNR MSSIM VIF IFC
1 Lena 0.9513 0.9513 0.078 0.1345 0.1561 0.1055 2. Harbor image-
A57
0.8517 0.8517 -0.349 0.1267 0.1372 0.1015
3. Baby image- A57
0.9576 0.9576 3.0818 0.1724 0.2461 0.1338
4. Horse Image- A57
0.9544 0.9446 1.2882 0.1365 0.1181 0.1049
5. Liberty Statue -CSIQ
0.8857 0.8857 0.0986 0.2910 0.2123 0.1153
6. Turtle – CSIQ 0.9241 0.9241 0.5170 0.1611 0.2361 0.1390 7. Roman
Statue-TID2008
0.8882 0.8882 -3.168 0.0837 0.1192 0.0859
8. Door image-TID 2008
0.9148 0.9148 2.5907 0.1969 0.1941 0.1066
9. Barbara Image - VC
0.8945 0.8945 1.6253 0.0838 0.1473 0.1065
Technology (IJRASET)
[image:15.612.185.426.79.490.2]©IJRASET 2013: All Rights are Reserved
230
Figure 6.1 Evaluation of TID 2008, CSIQ, IVC and A57 data base images are shown. a) Original image, b) Encrypted image, c) decrypted image and d)SSIM map images
Figure 6.2 Computation of an Error Image
VII. CONCLUSION AND FURTURE ENCHANCEMENT
Technology (IJRASET)
©IJRASET 2013: All Rights are Reserved
231
extraction. Image encryption and data hiding keys can be used for simultaneous extraction of the original content by exploiting the spatial correlation in natural image. Simulation results obtained is similar to the natural content (HVS) and it is proven from the conventional and subjective image quality reports. Hardware implementation of encryption and decryption process is carried out of an image size 32 x 32. In future, various other compression techniques can be employed for further studies. In the forthcoming works, we extend our proposals to implement hardware for the entire simulation work for the size of 256 x 256 image using CHAMP-FX3 (VPX6-472) 6U OpenVPX Virtex-6 FPGA processor.
REFERENCES
[1] Kodituwakku.S.R., Amarasinghe.U.S.: ‘Comparison of Lossless Data Compression Algorithms for Text Data’, Indian Journal of Computer Science and Engineering, 2010,1, (4), pp. 416 – 425.
[2] Yung – Kai Lai, Jay Kuo. C. C.: ‘A Haar Wavelet Approach to Compressed Image Quality Measurement’, Journal of Visual Communication and Image Representation, 1999,11, pp. 17 – 40.
[3] Fahim Irfan Alam, Fateha KhanamBappee, Farid Udeen Ahmed Khondker: ‘An Investigation Into Encrypted Message Hiding Through Images Using LSB’, International Journal of Engineering Science and Technology (IJEST), 2011, 3, (2), pp. 948 – 960.
[4] Debnath Bhattacharyya, Arpita Roy, Pranab Roy, Tai-hoon Kim: ‘Receiver Compatible Data Hiding in Color Image’, International Journal of Advanced Science and Technology, 2009, 6, pp.15 - 24.
[5] Puech.W., Chaumont.M.: Strauss.O.: ‘A Reversible Data Hiding Method for Encrypted Images’, SPIE, IS&T'08: SPIE Electronic Imaging, Security, Forensics, Steganography, and Watermarking of Multimedia Contents, San Jose, CA, USA. 2008.
[6] Xinpeng Zhang: ‘Reversible Data Hiding in Encrypted Image’, IEEE Signal Processing Letters, 2011,18, (4), pp. 255 – 258.
[7] Lavanya.A, Natarajan.V.: ‘Watermarking patient data in encrypted medical images’, Indian Academy of Sciences, 2012, 37, (6), pp. 723 –729.
[8] Sesha Pallavi Indrakanti, Avadhani.P.S.: ‘Permutation based Image Encryption Technique’, International Journal of Computer Applications (0975 – 8887), 2011, 28, (8), pp.45 – 47.
[9] Dhananjay Yadav , Vipul Singhal, Devesh Kumar Bandil: ‘Reversible Data Hiding Techniques’, International Journal of Electronics and Computer Science Engineering, Available Online at www.ijecse.org, 1, (2), pp.380 - 383.
[10] Mark Johnson, Prakash Ishwar, Vinod Prabhakaran, Daniel Schonberg, Kannan Ramchandran: ‘On Compressing Encrypted Data’, IEEE Transactions On Signal Processing, 2004, 52, (10), pp. 2992 – 3006.
[11] Mehdi Fallahpour, David Megias,Yun Q. Shi: ‘Lossless Image Data Embedding in Plain Areas’, SPIE - IS&T 7880, 2011.
[12] Lala Krikor, Sami Baba, Thawar Arif: ‘Image Encryption Using DCT and Stream Cipher’, European Journal of Scientific Research, 2009, 32, (1), pp. 48-58. [13] Aditee Gautam, Meenakshi Panwar, Dr. Gupta.P.R.: ‘A New Image Encryption Approach Using Block Based Transformation Algorithm’, International
Journal of Advanced Engineering Sciences andTechnologies, 2011, 8, (1), pp. 90 – 96.
[14] Hiral Rathod, Mahendra Singh Sisodia, Sanjay Kumar Sharma: ‘Design and Implementation of Image Encryption Algorithm by using Block Based Symmetric Transformation Algorithm (Hyper Image Encryption Algorithm)’, International Journal of Computer Technology and Electronics Engineering (IJCTEE), 1, (3), pp. 7 - 13.
[15] Xinpeng Zhang: ‘Reversible Data Hiding With Optimal Value Transfer’, IEEE Transactions On Multimedia, 2013, 15, (2), pp. 316 – 325.
[16] Wien Hong, Tung-Shou Chen, Han-Yan Wu: ‘An Improved Reversible Data Hiding in Encrypted Images Using Side Match’, IEEE Signal Processing Letters, 2012, 19, (4), pp.199 – 202.
[17] Mehdi Fallahpour, ‘Reversible Image Data Hiding Based on Gradient Adjusted Prediction”, IEICE Electronics Express, 2008, 5, (20), pp. 870 – 876. [18] Mehmet Utku Celik, Gaurav Sharma, Ahmet Murat Tekalp, and Eli Saber: ‘Lossless Generalized-LSB Data Embedding’ , IEEE Transactions on Image
Processing, 2005, 14, (2), pp. 253 – 266.
[19] Ali Shariq Imran, M. Younus Javed, and Naveed Sarfraz Khattak: ‘A Robust Method for Encrypted Data Hiding Technique Based on Neighborhood Pixels Information’, International Journal of Computer Science and Engineering, 2007, 1, (3), pp. 159 – 164.
[20] Hsien-wen Tseng , Chin-chen Chang: ‘High Capacity Data Hiding in JPEG-Compressed Images’, INFORMATICA, 2004, 5, (1), pp. 127–142.
[21] Jeeva, AL., Dr.Palanisamy, V., Kanagaram, K.: ‘Comparative Analysis of Performance Efficiency and Security Measures of Some Encryption Algorithms, International Journal of Engineering Research and Applications (IJERA), 2012, 2(3), pp. 3033-3037.
[22] Lin Zhang, Lei Zhang, Xuanqin Mou, and David Zhang,: ‘FSIM: A Feature Similarity Index for Image Quality Assessment’, IEEE Transactions on Image Processing, 2011, 20(8), pp. 2378 - 2386
[23] Lin Zhang, Lei Zhang, Xuanqin Mou, and David Zhang: ‘A Comprehensive Evaluation of Full Reference Image Quality Assessment Algorithms’, in Proc. ICIP, 2012, pp. 1477-1480.
Technology (IJRASET)
©IJRASET 2013: All Rights are Reserved
232
AUTHOR BIOGRAPHY
Smitha Mohandoss, Assistant Professor in the Department of Biomedical Engineering from PSNA College of Engineering and Technology, Dindigul. She graduated as Biomedical Instrumentation Engineer from Avinashilingam University, Coimbatore in the year 2009. Since 2010, she joined her post graduation in M.E Applied Electronics from PSNA College of Engineering and Technology and completed in the year 2013. She has more than four years of experience in teaching. Her special interest in the area of Engineering includes Medical Diagnostic and Therapeutic Equipment, Digital Image Processing, Rehabilitation Engineering.
Karthik. V.J., Senior Engineer-Connected Car from Harman International India Private Limited, Bangalore. He has completed B.E., Electrical & Electronics Engineering from P.S.N.A College of Engineering & Technology, Dindigul in the year 2008. He has more than 7 years of experience in Validation of Automotive Infotainment, Instrumentation Clusters and Connected Car with Vehicle Telematics. His major areas of Expertise are Speech Recognition System, Gesture Technology, Connectivity, Systems-Environment, ADAS-Camera, Digital Image Processing, Navigation and Hologram & Proximity Sensors