0095-1137/03/$08.00⫹0 DOI: 10.1128/JCM.41.7.3306–3311.2003
Copyright © 2003, American Society for Microbiology. All Rights Reserved.
Fluorescent Dye Terminator Sequencing Methods for Quantitative
Determination of Replication Fitness of Human Immunodeficiency
Virus Type 1 Containing the Codon 74 and 184 Mutations
in Reverse Transcriptase
Viktoria Nurpeisov, Selwyn J. Hurwitz, and Prem L. Sharma*
Department of Pediatrics and Laboratory of Biochemical Pharmacology, Emory University School of Medicine and Veterans Affairs Medical Center, Decatur, Georgia 30033
Received 9 December 2002/Returned for modification 18 March 2003/Accepted 11 April 2003
The fluorescent dye-labeled dideoxynucleotide automated DNA sequencing system has been routinely used for monitoring the development of resistance mutations in human immunodeficiency virus type 1 reverse transcriptase (RT) and protease genes during therapy. This system has provided information regarding the presence of mixtures of nucleotides in the clinical samples but has not previously been validated for the quantitative determination between peak heights and relative DNA concentration. We evaluated this system by using various ratios of wild-type and mutated DNA fragments and by performing sequencing reactions at actual melting temperatures of specific primers. Several different ratios of purified DNA fragments containing mixtures of L74/V74 and M184/V184 were sequenced, and peak heights were measured. Regression analysis between ratios of peak heights and DNA concentration demonstrated a statistically significant linear corre-lation, suggesting that the quantification of two different species of DNA in a mixture could be achieved with the fluorescent dye-labeled dideoxynucleotide system. These strategies have broader implications for the quantification of replication fitness of viruses, particularly those containing RT mutations at codons 74 and 184.
The development of drug resistance mutations that affect the efficacy of antiretroviral therapy is the hallmark of all of the drugs approved by the U.S. Food and Drug Administration to date. The first report on the identification of drug resistance mutations selected by zidovudine appeared soon after intro-duction of the drug in clinic for the treatment of infections due to human immunodeficiency virus (HIV-1) (13, 14). This de-velpment motivated the search for rapid strategies for high-throughput sequencing of HIV-1 genes in order to identify novel mutations that affect drug susceptibility in in vitro cell culture assays.
The introduction of automated DNA sequencing technology revolutionized the rapid sequencing of novel genes, identifica-tion of drug-selected changes in the HIV-1 genome, and the appreciation of mixtures of viral populations in clinical samples (11). Further, hybridization strategies, such as line probe assay (LiPA), that can discriminate between wild-type (WT) and mutated codon were also introduced (27). Recent studies have shown that HIV-LiPA is more sensitive than sequencing for the detection of mixed virus populations but can result in a high level of hybridization failures (22). In addition, LiPA in general is limited, since probes for certain important muta-tions, such as K65R are unavailable.
During the past few years, clinical trials have shown that multidrug resistance mutants selected with highly active anti-retroviral therapy are generally attenuated for replication. As
soon as the role of drug-selected reverse transcriptase (RT) and protease mutations affecting HIV-1 replication became evident (2, 3, 5, 6, 16, 24, 25), automated sequencing strategies were used for quantification of viral growth fitness by compar-ing the peak heights of two nucleotides at a scompar-ingle locus in a chromatogram (6–10, 12, 24, 25).
In a previous study, investigators compared the Sequenase fluorescent dye-labeled dideoxynucleotide system (termi-nator system) with the labeled primer system. The dye-labeled primer system is more appropriate for the quantitative detection of mixtures of HIV-1 drug resistance mutations due to a better correlation of peak heights with the amount of relative DNA concentration (15). We have previously com-pared the growth fitness of WT virus (pNL4-3) and didanosine-selected mutant L74V by using theTaqfluorescent dye-labeled dideoxynucleotide system. Growth competition assays were performed by infecting human PBM cells with equivalent amounts of infectious virus, and the infected cells were col-lected at various time points. Sequencing of PCR-amplified genomic DNA and analysis of peak heights in chromatograms reveal that both WT T and mutated G nucleotide peaks were virtually equal on days 4 and 6. However, after day 8, the peak height of G was significantly lower than the WT nucleotide T (24). Furthermore, analysis of replication fitness by utilizing a mathematical model (7, 18) revealed a loss of 11% fitness for L74V viruses (24). This suggested that the dye-labeled termi-nator sequencing may be useful for quantitative analysis of mixtures containing two viruses. Thus, the utility of a dye-labeled dideoxynucleotide system for quantitative analysis re-mains controversial and requires further validation.
The dye-labeled dideoxynucleotide system is fast,
cost-effec-* Corresponding author. Mailing address: Department of Pediatrics and Laboratory of Biochemical Pharmacology, Emory University and Veterans Affairs Medical Center, Medical Research 151H, 1670 Clair-mont Rd., Decatur, GA 30033. Phone: (404) 321-6111, x7495. Fax: (404) 728-7726. E-mail: [email protected].
3306
on May 15, 2020 by guest
http://jcm.asm.org/
tive, and available in most sequencing core laboratories. We performed a rigorous analysis to validate the use of dye-termi-nator system for quantitation of two species of viruses whose genomes differ by a single nucleotide at the same position. Since several antiretroviral drugs, including highly active anti-retroviral therapy, select RT mutations L74V and M184V (21, 26) and since these mutations confer a loss of replication fitness to the virus (2, 3, 24, 25), we used these markers for the validation of quantitative assay. Various ratios of WT and mutated DNA fragments were mixed, and sequencing reac-tions were conducted at the actual melting temperatures of sequencing primer. A strong linear relationship between ratios of peak height versus DNA concentration ratios was demon-strated.
(This work was presented in part at the Third HIV DRP Symposium on Antiviral Drug Resistance of the HIV Drug Resistance Program, National Cancer Institute, at Chantilly, Va., 8 to 11 December 2002.)
MATERIALS AND METHODS
Preparation of mutants.HIV-1 RT mutations L74V and M184V have been shown to confer a loss of replication fitness to viruses in human peripheral blood mononuclear cells (2, 24, 25). Site-directed mutagenesis was performed to create a double mutant proviral clone with L74V and M184V mutations in pNL4-3 background, by using the pALTER mutagenesis system (Promega, Madison, Wis.) (23). Previously described protocols were used for plasmid transfection and viral propagation (23–25). Briefly, WT pNL4-3 and double-mutant L74V ⫹ M184V were transfected in phytohemagglutinin-stimulated human peripheral blood mononuclear cells via electroporation, and the replication of the virus was monitored by measuring RT activity in cell-free supernatants. At 3 weeks post-transfection, culture supernatants were collected for RNA extraction and to confirm the presence of mutations in the infectious virus.
RT-PCR.Total RNA was isolated from culture supernatants by using the commercial QIAmp Viral RNA mini kit (Qiagen, Valencia, Calif.). A 784-bp RT fragment was amplified by single step RT PCR of RNA with primers RT21 and RT16 (Table 1). Both WT and mutated fragments were purified by using QIA-quick PCR purification kit (Qiagen). DNA was quantified by measuring the optical density at wavelengths of 260 and 280 nm in a Beckman spectrophotom-eter. To avoid variability among independent sequencing reactions due to re-peated freeze and thaw, aliquots of purified DNA were stored at⫺20°C. Each aliquot of DNA was used only once during the sequencing reaction.
Sequencing of HIV-PCR products. The Taq fluorescent dye-labeled dideoxynucleotide system (ABI Prism BigDye terminator) was used for the quantitative detection of DNA peaks in chromatograms. This system consists of four BigDye terminators for A, C, G, and T; deoxynucleoside triphosphates (dATP, dCTP, dITP, and dUTP); magnesium chloride; and AmpliTaq DNA polymerase, FS. Sequencing reactions were performed on various mixtures of WT and mutated DNA fragments by using different primers (Table 1). The PCR conditions were as follows: one cycle at 95°C (10 s), followed by a series of 30 cycles that included treatment at 95°C for 30 s, at the annealing temperature (Tm) of the specific primer for 1 min, and at 65°C for 4 min. The PCR products
were purified on Sephadex G-50 Fine (Amersham Pharmacia Biotech AB, Upp-sala, Sweden), and half of the product was subjected to 6% acrylamide gel electrophoresis in an Applied Biosystems 377 automated DNA sequencer. The sequencing data were imported into the software package EditView (PE Biosys-tems) for further analysis of peak heights.
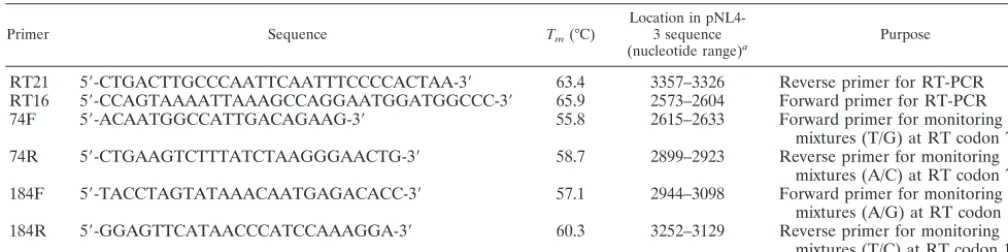
Statistical analysis.At least three independent sequencing reactions with five different mixtures of WT and DNA containing L74V or M184V mutations were performed for each of the four primers (3⫻5 variables⫽15). The peak heights were measured, and the ratios of WT (T) and mutated (G) nucleotides with forward primer 74F and WT (A) and mutated (C) nucleotides with reverse primer 74R were calculated for codon 74. Similarly, fractions of peak heights for nucleotides A/G and T/C were calculated at RT codon 184 by using the forward primer 184F and the reverse primer 184R, respectively. A regression analysis was performed on peak height ratios and DNA concentration ratios.
RESULTS
Primer design and sequencing strategy.Primer 74F has
pre-viously been used with dye-labeled dideoxynucleotide system to measure the impact of didanosine-selected mutation L74V on growth fitness of HIV-1 (24). To create identical conditions during the sequencing reactions, primers 74F, 74R, 184F, and 184R were selected such that all were at an equivalent distance (154 nucleotides [nt]) from the codon to be analyzed (Fig. 1 and Table 1). This allowed us to monitor the nucleotide peak heights in the same chromatogram regions.
[image:2.603.42.546.82.208.2]Since four dideoxynucleotides (ddATP, ddCTP, ddTTP, and
[image:2.603.308.536.501.687.2]FIG. 1. Location of sequencing primers in pol gene of proviral clone pNL4-3. All four forward (F) and reverse (R) primers, 74F, 74R, 184F, and 184R, were selected at equivalent distances with respect to RT codons 74 and 184. Primer sequences are presented in Table 1. TABLE 1. Oligonucleotides used in this study
Primer Sequence Tm(°C)
Location in pNL4-3 sequence (nucleotide range)a
Purpose
RT21 5⬘-CTGACTTGCCCAATTCAATTTCCCCACTAA-3⬘ 63.4 3357–3326 Reverse primer for RT-PCR RT16 5⬘-CCAGTAAAATTAAAGCCAGGAATGGATGGCCC-3⬘ 65.9 2573–2604 Forward primer for RT-PCR 74F 5⬘-ACAATGGCCATTGACAGAAG-3⬘ 55.8 2615–2633 Forward primer for monitoring
mixtures (T/G) at RT codon 74 74R 5⬘-CTGAAGTCTTTATCTAAGGGAACTG-3⬘ 58.7 2899–2923 Reverse primer for monitoring
mixtures (A/C) at RT codon 74 184F 5⬘-TACCTAGTATAAACAATGAGACACC-3⬘ 57.1 2944–3098 Forward primer for monitoring
mixtures (A/G) at RT codon 184 184R 5⬘-GGAGTTCATAACCCATCCAAAGGA-3⬘ 60.3 3252–3129 Reverse primer for monitoring
mixtures (T/C) at RT codon 184
a
Nucleotide numbers were obtained from pNL4-3 sequence GenBank accession no. M19921 (1).
on May 15, 2020 by guest
http://jcm.asm.org/
on May 15, 2020 by guest
http://jcm.asm.org/
ddGTP) were tagged to different fluorescent dyes, both DNA strands were sequenced to analyze whether the presence of structurally different dyes impacts base incorporation and peak heights. For example, the ratios of the peak heights of T/G (TTA/GTA) with forward primer 74F and the peak heights of A/C (AAT/CAT) with reverse primer 74R would be different, if the dyes tagged to dideoxynucleotide do impact peak heights. The mixtures of WT T (TTA) and mutated G (GTA) nu-cleotides with forward primer 74F and of WT A (AAT) and mutated C (CAT) nucleotides with reverse primer 74R at RT codon 74 were subjected to PCR, followed by sequencing. Similarly, WT A (ATG) and mutated G (GTG) nucleotides with forward primer 184F and WT T (TAC) and mutated C (CAC) nucleotides with reverse primer 184R at codon 184 were analyzed. Different ratios of the WT and mutated DNA were used in the sequencing reaction to correct for variability. A total of 100 ng of mixtures of DNA was used for the PCRs. The ratios of WT to mutated DNA were 50:50, 60:40, 40:60, 80:20, and 20:80. Both plus and minus DNA strands were sequenced by using forward and reverse primers. The primer locations are presented in Fig. 1 and Table 1.
It is a common practice to use an annealing temperature of 50°C in DNA sequencing core laboratories. However, how this affects the optimal hybridization of primer to target molecules during PCR of sequencing reactions is not clear. We per-formed all our sequencing reactions at actual melting temper-atures (Tm) of specific primers (Table 1). Visual inspection of
chromatograms (Fig. 2) revealed that the peak heights of nu-cleotides were not identical because of differences in base incorporation for nucleotides due to four different fluorescent dye-tagged terminators. However, the ratios of peak heights in relation to DNA concentrations were not affected. For exam-ple, we always observed relatively smaller peak heights with primer 74F in comparison to other primers, but the relative ratios of the peak heights of two nucleotides were always in accordance with DNA concentrations (Fig. 2 and Table 2).
One exception to our general observations was the abnormal peak heights for A/G mixture of nucleotides at codon 184 (see Fig. 2, 184F). We found that when there are small differences between the concentrations of two nucleotides (G⫽60 ng, A
⫽ 40 ng) and the concentration of mutated DNA (AGA) is higher than the WT DNA (AAA), there is a lack of correlation between peak heights and DNA concentrations. We were un-able to resolve this problem with more than five independent sequencing runs. In contrast to forward primer 184F, the re-verse primer 184R gave reproducible, predicted relationships between peak heights and DNA concentration for the same locus, suggesting the importance of using both forward and reverse primers to compare the replication fitness of HIV-1 variants in a mixture.
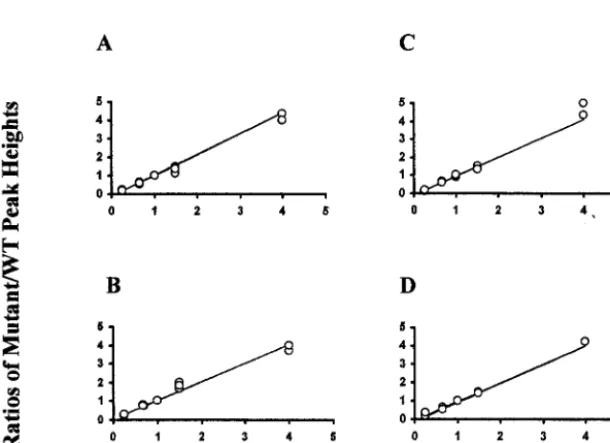
Correlation between ratios of DNA concentration and ratios
of peak heights. The data obtained from three independent
sequencing runs with each of the four primers is presented in Fig. 3. Since five different ratios of WT and mutated DNA were used, each plot (Fig. 3) shows 15 datum points. The peak heights of individual nucleotides were measured at RT codons 74 and 184, and the fractions (%) of the peak heights were calculated for both nucleotides. A scatter plot was used to depict 15 datum points (peak height ratios), and a regression analysis was performed to establish the relation between
FIG. 2. Quantitation of DNA concentrations in relation to peak heights. Sequencing reactions were performed with mixtures of purified PCR fragments o f WT DNA and the DNA containing the L74V and M184V mutations. To analyze nucleotide peaks at RT codon 74, both coding and noncoding DNA strands were sequenced with the forward and reve rse primers 74F and 74R, respectively. The peak heights of nucleotides T and G (TTA/GTA) obtained with primer 74F and nucleotides A and C with primer 74R were measured, and the p ercentage of each nucleotide in the mixture was calculated. Similarly, peak heights of A and G with primer 184F and T and C with primer 184R were determined at RT codon 184. N, equivale nt mixture of two nucleotides resulting in equal peak heights (preset values in software of ABI 377). This chromatogram is representative of at least three independent sequencing reactions. The average values for three sequencing runs are presented in Table 2.
on May 15, 2020 by guest
http://jcm.asm.org/
theDNA concentration of two variables and the peak heights obtained in the chromatogram (Fig. 2). The regression analysis between ratios of peak heights and ratios of related DNA concentrations showed a remarkable linear relation. This lin-ear correlation was observed among independent experiments and also when the values of three experiments were considered together (Fig. 2 and 3). Regression analysis was also performed on the data obtained from individual sequencing runs. For three sequencing runs, theR2values were as follows: primer
74F, 0.998, 0.998, and 0.999 (combined R2 ⫽0.994); primer
74R, 0.999, 0.996, and 0.997 (combinedR2 ⫽ 0.997); primer
184F, 0.996, 0.998, and 0.999 (combined R2 ⫽ 0.976); and
primer 184R, 0.999, 0.999, and 0.994 (combinedR2⫽0.998).
DISCUSSION
Clinical trials have shown that HIV-1 replication fitness may play an important role in the outcome of disease (4, 17, 19, 20),
and reliable assays are needed to determine relative viral fit-ness in a heterogeneous population of viruses. Several inves-tigators have used a dye-labeled primer system with automated DNA sequencer to measure the replication fitness of viruses by comparing the peak heights of two viruses at a single locus in the RT or protease genes (7, 8, 12). The use of Taq dye-terminator chemistry to quantitate replication fitness is rarely reported (10, 24), and no detailed statistical analysis regarding the correlation of peak heights and the amount of DNA has been reported. In this report, we validate the use ofTaq fluo-rescent dye-terminator chemistry for the quantitative determi-nation of relative viral fitness. Regression analysis between the ratios of peak heights and ratios of DNA concentration showed that a linear correlation exists between these two values under specific assay conditions.
[image:5.603.43.285.82.169.2]In an earlier study, Larder et al. (15) demonstrated that the quantitative detection of HIV-1 drug resistance mutations is best achieved by the fluorescence-labeled sequencing primers. These authors also indicated that Sequenase dye-terminator chemistry failed to produce equal peaks in the presence of 50% of mixture. In effect, visualizing the Sequenase terminator data in the chromatogram (Fig. 2b in reference 15) and the table in that study would indicate a lack of correlation between the DNA concentration and peak heights at several ratios of WT to mutant nucleotide. Moreover, due to the presence of back-ground peaks in the chromatogram obtained from dye-termi-nator chemistry, the determination of the nucleotide with a minor population was impossible. Our data argue against those observations, and in 12 independent sequencing reactions us-ing dye-terminator chemistry and four different primers, the peak size was always equal in a 50% mixture of WT and mutant
FIG. 3. Demonstration of a linear relation between DNA concentration and peak heights. Peak-height ratios (mutant/wild type) were plotted versus the corresponding DNA concentration ratios for the four sequencing primers: 74F (A), 74R (B), 184F (C), and 184R (D). Each plot shows 15 datum points (ratios of peak heights) obtained from three independent sequencing runs. A linear regression analysis was performed for each of the three independent runs (see Results). The combined linear regression correlation coefficients (R2) for primers 74F, 74R, 184F, and 184R
[image:5.603.143.448.424.645.2]were 0.994, 0.997, 0.976, and 0.998, respectively.
TABLE 2. Fractions of peak heights in relation to DNA concentration
DNA concn (ng) Fraction of peak ht (WT/WT⫹mutant) awith
sequencing primer:
WT Mutant 74F 74R 184F 184R
50 50 50.0 50.0 50.0 50.0
60 40 60.0 59.0 61.0 60.7
40 60 40.0 38.0 41.0 39.7
80 20 81.0 80.6 79.0 81.0
20 80 20.0 19.7 21.0 19.0
a
Mixtures of WT and mutated DNA were sequenced by using four primers. Peak heights were measured for three independent sequencing runs, and frac-tions (WT/WT⫹mutant) were calculated. The averages of the ratios are pre-sented here.
on May 15, 2020 by guest
http://jcm.asm.org/
DNA. Indeed, various ratios of WT to mutant were found to have a high degree of correlation with peak heights. In at least three independent sequencing runs with four primers (Fig. 2 and 3) and the same sequencer, the variability between runs was minimal. Unlike previous reports, we performed sequenc-ing reactions at actual annealsequenc-ing temperatures (Tm) of primers,
allowing an optimal hybridization of primer to target mole-cules. Additionally, the location of primer with respect to the nucleotide to be analyzed may play a role in determining the peak heights of nucleotides in a mixture. The evaluation of nucleotide peak heights in the same region of the chromato-grams allowed a better comparison between the data obtained with four different primers.
Our values of peak heights obtained at mixed-base positions by using dye-labeled terminator chemistry were in fact similar to those reported previously with dye-labeled primer chemistry (15). However, the dye-labeled primer system is cumbersome and expensive due to the requirement of four dye-labeled primers for the detection of four nucleotides and incorporation of 5⬘universal-tailed M13 sequences in the PCR products. In comparison, dye-terminator chemistry is a single-tube method and easy to assay in a short period of time.
There has been a considerable improvement in sequencing chemistry during the last decade. Specifically, the discovery of
Taqpolymerase allowed us to perform sequencing reactions at considerably higher temperatures than Sequenase polymerase. This resulted in increased specificity and eliminated problems due to DNA secondary structure. Additionally, substitute nu-cleotides ITP and UTP can be used to replace dGTP and dTTP to overcome the problem in sequencing G/C-rich regions. As shown in Fig. 2, most of our chromatograms had very few to no background peaks, allowing us to determine 20% of the minor population in the mixture. This is in contrast to a previous report, in which others were unable to detect reliably a 20 to 25% minor population in the mixture with a primer-labeled sequencing chemistry (12). In summary, dye-labeled termina-tor chemistry could be used reliably for measuring relative fitness of cloned viruses in a mixture, and the strategy de-scribed here could be extended to determine replication effi-ciencies of HIV-1 variants selected during therapy.
ACKNOWLEDGMENTS
This work was supported by NIH grant RO1-AI-47726 (P.L.S.). We thank Rathna Giri Polavarapu, Emory University DNA Core Facility, and Alisa Morales of Applied Biosystems for valuable sugges-tions during this project. We also thank Cheryl Strauss for proofread-ing the manuscript.
REFERENCES
1. Adachi, A., H. E. Gendelman, S. Koenig, T. Folks, R. Willey, A. Rabson, and M. A. Martin.1986. Production of acquired immunodeficiency syndrome-associated retrovirus in human and nonhuman cells transfected with an infectious molecular clone. J. Virol.59:284–291.
2. Back, N. K., M. Nijhuis, W. Keulen, C. A. Boucher, B. O. Oude Essink, A. B. van Kuilenburg, A. H. van Gennip, and B. Berkhout.1996. Reduced repli-cation of 3TC-resistant HIV-1 variants in primary cells due to a processivity defect of the reverse transcriptase enzyme. EMBO J.15:4040–4049. 3. Boyer, P. L., and S. H. Hughes.1995. Analysis of mutations at position 184
in reverse transcriptase of human immunodeficiency virus type 1. Antimi-crob. Agents Chemother.39:1624–1628.
4. Brenner, B. G., D. Turner, and M. A. Wainberg.2002. HIV-1 drug resis-tance: can we overcome? Expert Opin. Biol. Ther.2:751–761.
5. Croteau, G., L. Doyon, D. Thibeault, G. McKercher, L. Pilote, and D. Lamarre.
1997. Impaired fitness of human immunodeficiency virus type 1 variants with high-level resistance to protease inhibitors. J. Virol.71:1089–1096.
6. Goudsmit, J., A. D. Ronde, D. D. Ho, and A. S. Perelson.1996. Human immunodeficiency virus fitness in vivo: calculations based on a single zidovu-dine resistance mutation at codon 215 of reverse transcriptase. J. Virol.
70:5662–5664.
7. Goudsmit, J., A. de Ronde, E. de Rooij, and R. de Boer.1997. Broad spectrum of in vivo fitness of human immunodeficiency virus type 1 sub-populations differing at reverse transcriptase codons 41 and 215. J. Virol.
71:4479–4484.
8. Harrigan, P. R., I. Kinghorn, S. Bloor, S. D. Kemp, I. Najera, A. Kohli, and B. A. Larder.1996. Significance of amino acid variation at human immuno-deficiency virus type 1 reverse transcriptase residue 210 for zidovudine sus-ceptibility. J. Virol.70:5930–5934.
9. Harrigan, P. R., S. Bloor, and B. A. Larder.1998. Relative replicative fitness of zidovudine-resistant human immunodeficiency virus type 1 isolates in vitro. J. Virol.72:3773–3778.
10. Imamichi, T., S. C. Berg, H. Imamichi, J. C. Lopez, J. A. Metcalf, J. Fallon, and H. C. Lane.2000. Relative replication fitness of a high-level 3⬘ -azido-3⬘-deoxythymidine-resistant variant of human immunodeficiency virus type 1 possessing an amino acid deletion at codon 67 and a novel substitution (Thr3Gly) at codon 69. J. Virol.74:10958–10964.
11. Kavlick, M. F., K. Wyvill, R. Yarchoan, and H. Mitsuya.1998. Emergence of multi-dideoxynucleoside-resistant human immunodeficiency virus type 1 variants, viral sequence variation, and disease progression in patients receiv-ing antiretroviral chemotherapy. J. Infect. Dis.177:1506–1513.
12. Kosalaraksa, P., M. F. Kavlick, V. Le R. Maroun, and H. Mitsuya.1999. Comparative fitness of multi-dideoxynucleoside-resistant human immunode-ficiency virus type 1 (HIV-1) in an in vitro competitive HIV-1 replication assay. J. Virol.73:5356–5363.
13. Larder, B. A., G. Darby, and D. D. Richman.1989. HIV with reduced sensitivity to zidovudine (AZT) isolated during prolonged therapy. Science
243:1731–1734.
14. Larder, B. A., and S. D. Kemp.1989. Multiple mutations in HIV-1 reverse transcriptase confer high-level resistance to zidovudine (AZT). Science246:
1155–1158.
15. Larder, B. A., A. Kohli, P. Kellam, S. D. Kemp, M. Kronick, and R. D. Henfrey.1993. Quantitative detection of HIV-1 drug resistance mutations by automated DNA sequencing. Nature365:671–673.
16. Mammano, F., C. Petit, and F. Clavel.1998. Resistance-associated loss of viral fitness in human immunodeficiency virus type 1: phenotypic analysis of protease and gag coevolution in protease inhibitor-treated patients. J. Virol.
72:7632–7637.
17. Miller, V., T. Stark, A. E. Loeliger, and J. M. Lang.2002. The impact of the M184V substitution in HIV-1 reverse transcriptase on treatment response. HIV Med.3:135–145.
18. Nagylaki, T.1992. Introduction to theoretical population genetics, p. 25–27. Springer-Verlag KG, Berlin, Germany.
19. Nicastri, E., L. Sarmati, G. D’Ettorre, L. Palmisano, S. G. Parisi, I. Uccella, A. Rianda, E. Concia, V. Vullo, S. Vella, and M. Andreoni.2003. Replication capacity, biological phenotype, and drug resistance of HIV strains isolated from patients failing antiretroviral therapy. J. Med. Virol.69:1–6. 20. Ometta, L., D. De Forni, F. Patiri, V. Trouplin, F. Mammano, V. Giacomet,
C. Giaquinto, D. Douek, R. Koup, and A. De Rossi.2002. Immune recon-stitution in HIV-1-infected children on antiretroviral therapy: role of thymic output and viral fitness. AIDS16:839–849.
21. Schinazi, R. F., B. A. Larder, and J. W. Mellors.2000. Resistance table. Mutations in retroviral genes associated with drug resistance 2000–2001 update. Int. Antiviral News6:65–91.
22. Servais, J., C. Lambert, E. Fontaine, J. M. Plesseria, I. Robert, V. Arendt, T. Staub, F. Schneider, R. Hemmer, C. Burtonboy, and J. C. Schmit.2001. Comparison of DNA sequencing and a line probe assay for detection of human immunodeficiency virus type 1 drug resistance mutations in patients failing highly active antiretroviral therapy. J. Clin. Microbiol.39:454–459. 23. Sharma, P. L., P. A. Chatis, A. L. Dogon, D. L. Mayers, F. E. McCutchan, C.
Page, and C. S. Crumpacker.1996. AZT-related mutation Lys70Arg in reverse transcriptase of human immunodeficiency virus confers decrease in susceptibility to ddATP in in vitro RT assay. Virology223:365–369. 24. Sharma, P. L., and C. S. Crumpacker.1997. Attenuated replication of
HIV-1 with a didanosine-selected reverse transcriptase mutation. J. Virol.
71:8846–8851.
25. Sharma, P. L., and C. S. Crumpacker.1999. Decreased processivity of RT containing a didanosine-selected RT mutation: comparative evaluation of the effect of RT mutations Leu74Val and Met184Val on viral fitness and RT processivity. J. Virol.73:8448–8456.
26. St. Clair, M., J. Martin, G. Tudor-Williams, M. Bach, C. Vavro, D. King, P. Kellam, S. Kemp, and B. Larder.1991. Resistance to ddI and sensitivity to AZT induced by a mutation in HIV-1 reverse transcriptase. Science253:
1557–1559.
27. Stuyver, L., A. Wyseur, A. Rombout, J. Louwagie, T. Scarcez, C. Verhofstede, D. Rimland, R. F. Schinazi, and R. Rossau.1997. Line probe assay for rapid detection of drug-selected mutations in the human immunodeficiency virus type 1 reverse transcriptase gene. Antimicrob. Agents Chemother.41:284–291.