SPECIAL ISSUE V (2016), Page 23 - 38
ENVIRONMENTAL PSYCHOLOGY:
THE URBAN BUILT ENVIRONMENT IMPACT ON HUMAN MENTAL HEALTH
Wang Chen1, Suzaini M. Zaid2 & Nurhanisah Nazarali3
1,2,3Centre for Building, Construction & Tropical Architecture
Faculty of Built Environment UNIVERSITY OF MALAYA
Abstract
Growing urban population has increased environmental demands and also affects human health. As the global population becomes more urbanized, there is a concern that it will negatively affect not just physical health, but also mental health. Mental health can be categorized and studied through many different approaches, such as psychology, psychiatry, clinical and sociology. This paper aims to highlight the comparison of mental health of rural and urban dwellers, in terms of environmental psychology (EP) through the Eysenck Personality Questionnaire (EPQ). A survey questionnaire was distributed to respondents in Petaling Jaya to represent the urban area, and Pontian to represent the rural area. The survey questionnaire was analysed using one-way ANOVA analysis, and suggests a relationship between behaviour and age, but also in relation to ‘living area’ influence that suggests urbanization affects a person’s environmental psychology. The findings suggest that urban dwellers are more prone to certain personality traits that can be detrimental to a person’s mental health.
INTRODUCTION
According to the World Health Organization, the urban population of the world is now is at approximately 54% of the total global population and continues to grow (WHO, 2016). As more and more people become urbanized, personal physical and mental health changes according to the urban landscape, where understanding of environmental psychology (EP) and environmental behaviour, (EB) is becoming a more pressing issue to human health. According to Gärling (2001), and Gifford and Sussman (2012), there are several unclear variables that affect a person’s Environmental Level of Concerns (ELC), such as age, gender and socio economic status. To identify which environmental problems are directly connected to human behavior, human behavior need to be investigated comprehensively. This paper briefly highlights a comparative study of environmental psychology between urban city dwellers in Petaling Jaya and rural area of Pontian, Johor.
Some of the variables have been classified as pro-environmental behaviour (Gifford, 2014) encompassing:Childhood Experience; puts emphasis on the fact that children can also engage in pro-environmental behaviour (Cheng & Monroe, 2012), particularly who spent time in wilder nature than domesticated one (Wells & Lekies, 2006). This means, compared to adults, they are more likely to spend time in nature (Thompson, Aspinall & Montarzino, 2008). Knowledge
and Education; refers to the fact that there is a direct relation between having
correct knowledge and making knowledgeable pro-environmental choices. However, knowledge in this case may be also self-reported knowledge as well (Fielding & Head, 2012). Recently, the analysis of 15 knowledge surveys related to environmental knowledge within American context indicated that the Americans are knowledgeable in terms of environmental problems such as renewable resources, what damages natural habitat, and where and how garbage is collected. However, they are less knowledgeable about current environmental issues such as global warming, energy and so on (Robelia & Murphy, 2012).
Personality; it seems openness is one of the Big Five personality factors, and is
ones’ value and pro-environmental behaviour is being moderated by locus of control (Engqvist Jonsson & Nilsson, 2014).
Values and Worldviews; values’ dimensions and its association with
environmental concerns has been studied extensively (Gifford, 2014). From political, economic, and technological perspectives, individuals who value free-market canons, view technology as eradicator of environmental issue and strongly believe that economics is a progress measurement indicator, and tend to have less concern about the environment (Heath & Gifford, 2006). Individuals who appeal to environmental values tend to increase pro-environmental behaviour (Gifford, 2014) than those who appeal to self-interest values (Bolderdijk, Steg, Geller, Lehman, & Postmes, 2013), or even those who have a combination of both (Evans et al., 2013). Other factors related to individual’s concern for the environment are Felt Responsibility, Moral Concerns, and Commitment; Frugality, Diversity, and Empowerment Attitudes; Place Attachment; Norms, Habits, and Defaults: Behavioural Momentum; Effect; and Demographic Factors (Gifford, 2014).
THE RELATIONSHIP BETWEEN PSYCHOLOGY AND
ENVIRONMENT
The most common elements found to affect personal environmental behaviours (EB) are architecture, landscape design, urban planning, geography, sociology, anthropology, education, psychology, ergonomics, and industrial design (Günther, 2009). A study done by Evans et al. (2013) suggest that types of houses also affect a person’s psychology and mental health, where symptoms of psychological distress like anxiety and depression were linked to a low-income population that was dwelling in a high-rise urban area. Environmental psychology can be defined as the impact of physical environment on human beings, and the impact of human beings on the physical environment (Gärling, 2001). However, EB and EP are quite personal to a person’s predisposition and elements of vulnerability, as to how they react and adapt to environmental demands (Zubin & Spring, 1977). Consequently, people who suffer high personal vulnerability will have a harder time to adapt to their environmental demands. Therefore, it is important to understand the relationship between the urban environment and human psychology, to discover behavioural adaptation to urban living conditions.
of the urban area has customized certain activities that are only distinctive of urban city inhabitants (Moser, 2012). One example is the growing obesity epidemic, where the urban environment has reduced the possibility for greater physical activity in children (Ding & Gebel, 2012; Pont et. al., 2009). The urban form clearly had an effect on parental perceptions, such as the neighbourhood area where the children had to travel, safety, as well as on the transport options available to the household (McMillan, 2005). These factors determined whether the children were allowed to walk, cycle or take transportation to school (McMillan, 2005), which would determine the amount of physical activity the child would partake every day to school.
METHODOLOGY
The methodology used to conduct this research was through quantitative analysis. A survey questionnaire was conducted as part of the quantitative analysis, with a total of 50 questionnaires were distributed online and in person, through random sampling technique. 100% of the respondents returned the questionnaire, making a sample size of 50 respondents. The survey questionnaire was carried out for both a rural area and an urban area, to compare the characteristics of rural and urban inhabitants. The Petaling Jaya region was selected for the urban area case study, and Pontian region in Johor State as the rural area case study. These areas decisively selected based on sociodemographic characteristics of people occupying the regions such as abilities, attitudes, and personality traits as well as temporary characteristics of knowledge, skill and motivation toward environmental psychology. The survey questionnaire consisted of both selective answers (yes or no questions) and open-ended (or semi-structured) questions. The survey questionnaire in this research aims at revealing to the extent to which sociodemographic characteristics are related to environmental psychology and pro-environmental behaviour. A quantitative sampling approach draws a representative sample of the targeted population, to consequently generalize the results back into the population (Marshall, 1996).
timeframe to conduct the survey questionnaire and very limited access to the targeted population size.
The survey questionnaire was designed based on the EPQ, which was designed to measure personality traits of psychoticism, extraversion, neuroticism, and social desirability (Eysenck & Eysenck, 1975). Individual personality can be defined as character, temperament, intellect and physique, which determine the individual’s unique ability to adjust according to the environment (Eysenck & Eysenck, 1975). The EPQ is a well-established personality assessment tool that can be used in several contexts, such as clinical, health, education, psychological, organization and such (Pedro, et. al., 2016). Therefore, the EPQ was determined as the most suitable assessment tool to investigate the relationship between human being’s relationships with the urban environment. Scientifically, the environmental psychology is of central importance in applied psychology, considering a theoretical and methodological foundation for environmental planning, design, and management. Therefore, we consider the socio demographic factors from a macro point of view, such as income, employment status, home ownership, household size, stage of family cycle and psychological factors of beliefs, attitudes, motivation and intentions, personal and social norms, behavioural controls in which they are known as pro-environmental indicators.
Using Statistical Package for Social Science (SPSS) Version 22.0 Software, data from the questionnaires was analysed, in order to provide quantitative indications of qualitative judgments. With the correlation between the questionnaire and the factors, Post Hoc Multiple Comparison Test had been used in analysing the data to get a better and understandable view. The data collected was also analysed using one-way ANOVA, in identifying the influence of respondents’ gender towards the EPQ. The EPQ designed with the aim of assessing the personality traits, encompassing psychoticism, extraversion, neuroticism, and last but not least social desirability. Its mechanism stands for assessing impulsivity (acting on impulse) in the psychoticism (to indicate qualities commonly found among psychotics) sub-scale and assessing sensation-seeking along with venturesome (to take risk or disposition to venture) in the extraversion sub-scale.
FINDINGS
Table 1: Respondent’s residence
Table 2 and Table 3 present findings of the respondent’s profile according to both rural and urban respondent, categorized by gender and age, respectively.
Table 2: Respondent’s gender
The age range included in the survey questionnaire is concentrated on the working age population of 16 to 55 years, where work related stress could affect a person’s mental health condition (Health and Safety Executive, 2015) that could make this working age group more vulnerable to mental health issues.
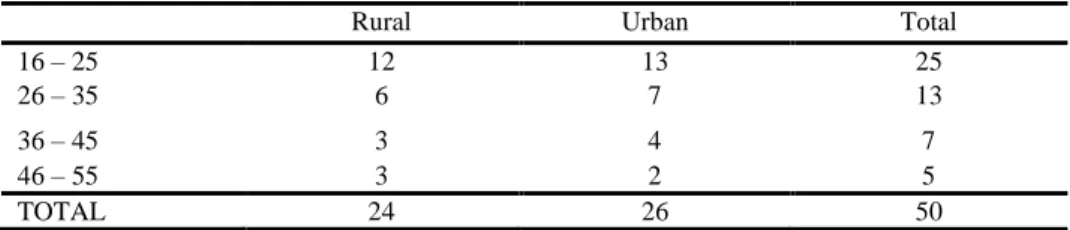
Table 3: Respondent’s age group
Represented in Table 4, the one-way ANOVA was conducted on identifying the influence of the respondents’ gender towards the Eysneck questions. The analysis shows that only the question 4 that affected by the gender with a significant value less than 0.05, which is 0.004. On the other hand, the rest of the questions have value more than 0.05 indicating that the gender of the respondents did not influence the data collection in identifying the behaviour and personality of the respondents.
Table 4: The influence of gender group of respondents towards EPQ
Rural Urban Total
Frequency (No. of Respondents) 24 26 50
Percentage (%) 48 52 100
Rural Urban Total
Male 12 11 23
Female 12 15 27
TOTAL 50
Rural Urban Total
16 – 25 12 13 25
26 – 35 6 7 13
36 – 45 3 4 7
46 – 55 3 2 5
TOTAL 24 26 50
Sum of
Squares df Mean Square F Sig. Are you a talkative person? Between
Groups .570 1 .570 2.355 .131 Within Groups 11.610 48 .242
Do you ever feel ‘just miserable’ for no reason?
Between
Groups .001 1 .001 .004 .952 Within Groups 10.499 48 .219
Total 10.500 49 Are you rather lively? Between
Groups .570 1 .570 2.355 .131 Within Groups 11.610 48 .242
Total 12.180 49 Would it upset you a lot to see a
child or an animal suffer?
Between
Groups 1.587 1 1.587 8.971 .004 Within Groups 8.493 48 .177
Total 10.080 49 Are your feelings easily hurt? Between
Groups .001 1 .001 .004 .952 Within Groups 10.499 48 .219
Total 10.500 49 Are all your habits good and
desirable ones?
Between
Groups .039 1 .039 .425 .518 Within Groups 4.461 48 .093
Total 4.500 49
Do you tend to keep in the background on social occasions?
Between
Groups .570 1 .570 2.355 .131 Within Groups 11.610 48 .242
Total 12.180 49 Do you prefer to go your own way
rather than act by the rules?
Between
Groups .094 1 .094 2.469 .123 Within Groups 1.826 48 .038
Total 1.920 49
Do you sometimes talk about things you know nothing about?
Between
Groups .039 1 .039 .425 .518 Within Groups 4.461 48 .093
Total 4.500 49
Do you prefer reading to meeting people?
Between
Groups .570 1 .570 2.355 .131 Within Groups 11.610 48 .242
Total 12.180 49 Do you enjoy practical jokes that
can sometimes really hurt people?
Between
Groups .094 1 .094 2.469 .123 Within Groups 1.826 48 .038
Total 1.920 49
Are you a worrier? Between
Groups .001 1 .001 .004 .952 Within Groups 10.499 48 .219
Total 10.500 49 As a child did you do as you were
told immediately and without grumbling?
Between
Groups .039 1 .039 .425 .518 Within Groups 4.461 48 .093
Total 4.500 49
Do you think marriage is old-fashioned and should be done away with?
Between
Groups .039 1 .039 .425 .518 Within Groups 4.461 48 .093
Total 4.500 49
Do you sometimes boast a little? Between
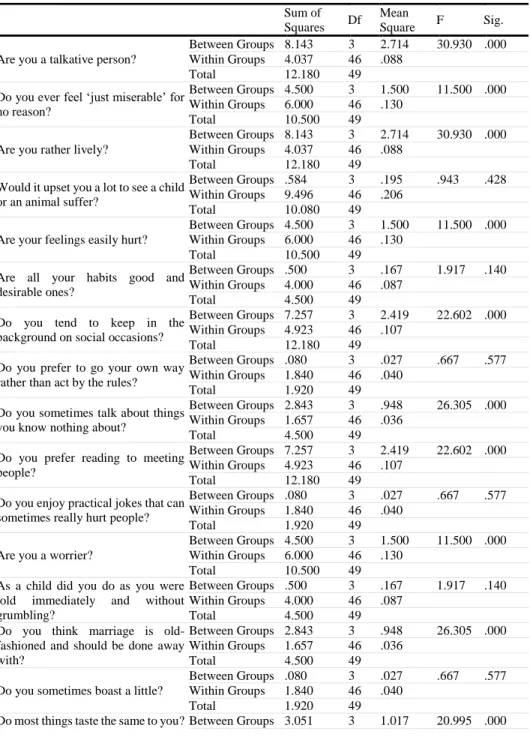
Additionally, it was found that age is a factor that affects the respondent’s behaviour in the EPQ test, as represented in Table 5. The majority of respondents have the significant result with lower than 0.05 which indicating that the age influencing the behaviour. The questions with lower than 0.05 are questions number 1, 2, 3, 5, 7, 9, 10, 12, 14, 16, 18, 19, 20, 21 and 23. There are a few questions that show the total influence of age towards the behaviour based on the significant value of 0.00. Thus, Post-Hoc Multiple Comparison Test was also carried out to identify specific means difference for each of the age range for each question. The Post-Hoc test revealed that the significant value of two age groups, namely 26-35 and 36-45 is higher than 0.05. This is proven by the significant value, which is 1.000 As for the question 6, the significant value of ANOVA test shows that it exceeding 0.05, which is 0.140. In proving the relationship between the sensitivity towards the behaviour, the mean difference of the age range
Within Groups 1.826 48 .038 Total
1.920 49
Do most things taste the same to you?
Between
Groups .005 1 .005 .042 .838 Within Groups 5.275 48 .110
Total 5.280 49
Have people said that you sometimes act too rashly?
Between
Groups .233 1 .233 2.617 .112 Within Groups 4.267 48 .089
Total 4.500 49
Do you always wash before a meal? Between
Groups .390 1 .390 1.611 .210 Within Groups 11.610 48 .242
Total 12.000 49 Have you ever insisted on having
your own way?
Between
Groups .001 1 .001 .004 .952 Within Groups 10.499 48 .219
Total 10.500 49 Would you like other people to be
afraid of you?
Between
Groups .010 1 .010 .046 .831 Within Groups 10.870 48 .226
Total 10.880 49 Do people tell you a lot of lies? Between
Groups .094 1 .094 2.469 .123 Within Groups 1.826 48 .038
Total 1.920 49
Are you always willing to admit it when you have made a mistake?
Between
Groups .211 1 .211 3.888 .054 Within Groups 2.609 48 .054
Total 2.820 49
Would you feel very sorry for an animal caught in a trap?
Between
Groups .025 1 .025 .121 .730 Within Groups 10.055 48 .209
provided, and the age of 16-25 and 26-35 carries the same mean difference, standard error and significant value. The same significant value is 0.209.
Table 5: The influence of age group of respondents towards EPQ
Sum of Squares Df
Mean
Square F Sig.
Are you a talkative person?
Between Groups 8.143 3 2.714 30.930 .000 Within Groups 4.037 46 .088
Total 12.180 49
Do you ever feel ‘just miserable’ for no reason?
Between Groups 4.500 3 1.500 11.500 .000 Within Groups 6.000 46 .130
Total 10.500 49
Are you rather lively?
Between Groups 8.143 3 2.714 30.930 .000 Within Groups 4.037 46 .088
Total 12.180 49
Would it upset you a lot to see a child or an animal suffer?
Between Groups .584 3 .195 .943 .428 Within Groups 9.496 46 .206
Total 10.080 49
Are your feelings easily hurt?
Between Groups 4.500 3 1.500 11.500 .000 Within Groups 6.000 46 .130
Total 10.500 49
Are all your habits good and desirable ones?
Between Groups .500 3 .167 1.917 .140 Within Groups 4.000 46 .087
Total 4.500 49
Do you tend to keep in the background on social occasions?
Between Groups 7.257 3 2.419 22.602 .000 Within Groups 4.923 46 .107
Total 12.180 49
Do you prefer to go your own way rather than act by the rules?
Between Groups .080 3 .027 .667 .577 Within Groups 1.840 46 .040
Total 1.920 49
Do you sometimes talk about things you know nothing about?
Between Groups 2.843 3 .948 26.305 .000 Within Groups 1.657 46 .036
Total 4.500 49
Do you prefer reading to meeting people?
Between Groups 7.257 3 2.419 22.602 .000 Within Groups 4.923 46 .107
Total 12.180 49
Do you enjoy practical jokes that can sometimes really hurt people?
Between Groups .080 3 .027 .667 .577 Within Groups 1.840 46 .040
Total 1.920 49
Are you a worrier?
Between Groups 4.500 3 1.500 11.500 .000 Within Groups 6.000 46 .130
Total 10.500 49 As a child did you do as you were
told immediately and without grumbling?
Between Groups .500 3 .167 1.917 .140 Within Groups 4.000 46 .087
Total 4.500 49
Do you think marriage is old-fashioned and should be done away with?
Between Groups 2.843 3 .948 26.305 .000 Within Groups 1.657 46 .036
Total 4.500 49
Do you sometimes boast a little?
Between Groups .080 3 .027 .667 .577 Within Groups 1.840 46 .040
Total 1.920 49
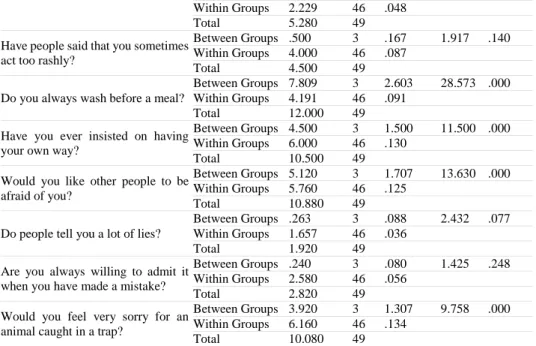
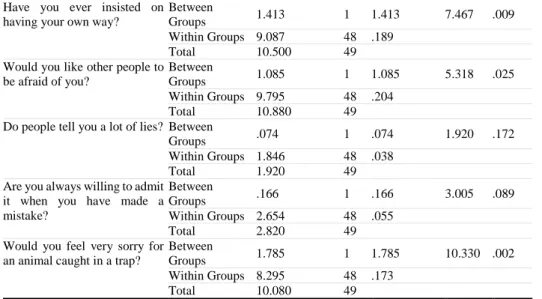
The influence of living area was also identified in the EPQ, as presented in Table 6. The significant value of living area that influencing the behaviour is only for the question number 2, 4, 5, 12, 19, 20, 22 and 23. A factor analysis was carried out in identifying the factor of living area affecting the people’s behaviour.
Table 6: The influence of living area of respondents towards EPQ Within Groups 2.229 46 .048
Total 5.280 49
Have people said that you sometimes act too rashly?
Between Groups .500 3 .167 1.917 .140 Within Groups 4.000 46 .087
Total 4.500 49
Do you always wash before a meal?
Between Groups 7.809 3 2.603 28.573 .000 Within Groups 4.191 46 .091
Total 12.000 49
Have you ever insisted on having your own way?
Between Groups 4.500 3 1.500 11.500 .000 Within Groups 6.000 46 .130
Total 10.500 49
Would you like other people to be afraid of you?
Between Groups 5.120 3 1.707 13.630 .000 Within Groups 5.760 46 .125
Total 10.880 49
Do people tell you a lot of lies?
Between Groups .263 3 .088 2.432 .077 Within Groups 1.657 46 .036
Total 1.920 49
Are you always willing to admit it when you have made a mistake?
Between Groups .240 3 .080 1.425 .248 Within Groups 2.580 46 .056
Total 2.820 49
Would you feel very sorry for an animal caught in a trap?
Between Groups 3.920 3 1.307 9.758 .000 Within Groups 6.160 46 .134
Total 10.080 49
Sum of Squares df Mean Square F Sig. Are you a talkative person? Between
Groups .001 1 .001 .002 .964
Within Groups 12.179 48 .254
Total 12.180 49
Do you ever feel ‘just
miserable’ for no reason? Between Groups 1.413 1 1.413 7.467 .009 Within Groups 9.087 48 .189
Total 10.500 49
Are you rather lively? Between
Groups .001 1 .001 .002 .964
Within Groups 12.179 48 .254
Total 12.180 49
Would it upset you a lot to see a child or an animal suffer?
Between
Groups 2.234 1 2.234 13.666 .001 Within Groups 7.846 48 .163
Total 10.080 49
Are your feelings easily hurt? Between
Within Groups 9.087 48 .189
Total 10.500 49
Are all your habits good and desirable ones?
Between
Groups .013 1 .013 .137 .713
Within Groups 4.487 48 .093
Total 4.500 49
Do you tend to keep in the background on social occasions?
Between
Groups .001 1 .001 .002 .964
Within Groups 12.179 48 .254
Total 12.180 49
Do you prefer to go your own way rather than act by the rules?
Between
Groups .074 1 .074 1.920 .172
Within Groups 1.846 48 .038
Total 1.920 49
Do you sometimes talk about things you know nothing about?
Between
Groups .013 1 .013 .137 .713
Within Groups 4.487 48 .093
Total 4.500 49
Do you prefer reading to meeting people?
Between
Groups .001 1 .001 .002 .964
Within Groups 12.179 48 .254
Total 12.180 49
Do you enjoy practical jokes that can sometimes really hurt people?
Between
Groups .074 1 .074 1.920 .172
Within Groups 1.846 48 .038
Total 1.920 49
Are you a worrier? Between
Groups 1.413 1 1.413 7.467 .009 Within Groups 9.087 48 .189
Total 10.500 49
As a child did you do as you were told immediately and without grumbling?
Between
Groups .013 1 .013 .137 .713
Within Groups 4.487 48 .093
Total 4.500 49
Do you think marriage is old-fashioned and should be done away with?
Between
Groups .013 1 .013 .137 .713
Within Groups 4.487 48 .093
Total 4.500 49
Do you sometimes boast a little?
Between
Groups .074 1 .074 1.920 .172
Within Groups 1.846 48 .038
Total 1.920 49
Do most things taste the same to you?
Between
Groups .062 1 .062 .571 .454
Within Groups 5.218 48 .109
Total 5.280 49
Have people said that you sometimes act too rashly?
Between
Groups .013 1 .013 .137 .713
Within Groups 4.487 48 .093
Total 4.500 49
Do you always wash before a meal?
Between
Groups .013 1 .013 .051 .822
Within Groups 11.987 48 .250
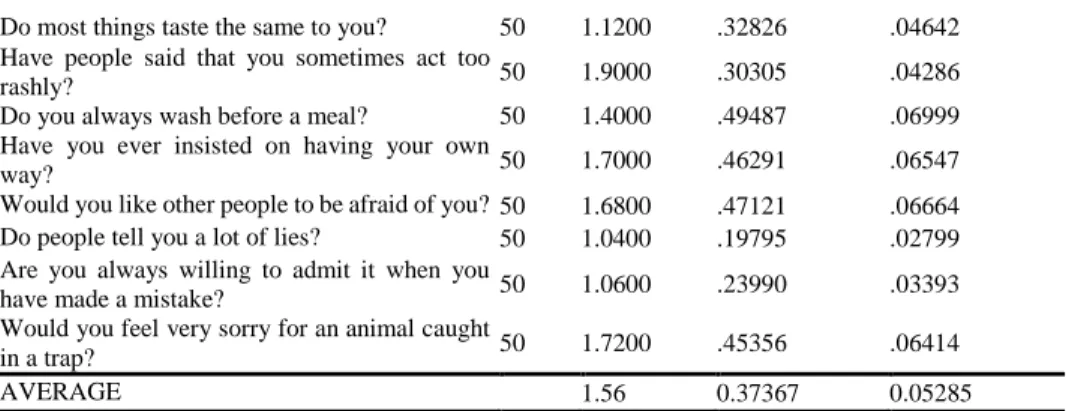
Generally, the data can be summarized as Table 7 below. Accordingly, the answers where calculate to average a mean of 1.56. A one-sample t-test was conducted to validate the significance of differences between sample means with the number of samples, 50 respondents. It shows the mean, standard deviation and standard error mean for each of the questions.
Table 7: One-Sample Statistics T-Test of the EPQ Have you ever insisted on
having your own way?
Between
Groups 1.413 1 1.413 7.467 .009 Within Groups 9.087 48 .189
Total 10.500 49
Would you like other people to be afraid of you?
Between
Groups 1.085 1 1.085 5.318 .025 Within Groups 9.795 48 .204
Total 10.880 49
Do people tell you a lot of lies? Between
Groups .074 1 .074 1.920 .172
Within Groups 1.846 48 .038
Total 1.920 49
Are you always willing to admit it when you have made a mistake?
Between
Groups .166 1 .166 3.005 .089
Within Groups 2.654 48 .055
Total 2.820 49
Would you feel very sorry for an animal caught in a trap?
Between
Groups 1.785 1 1.785 10.330 .002 Within Groups 8.295 48 .173
Total 10.080 49
N Mean Std. Deviation Std. Error Mean Are you a talkative person? 50 1.4200 .49857 .07051 Do you ever feel ‘just miserable’ for no reason? 50 1.7000 .46291 .06547 Are you rather lively? 50 1.4200 .49857 .07051 Would it upset you a lot to see a child or an
animal suffer? 50 1.2800 .45356 .06414
Are your feelings easily hurt? 50 1.7000 .46291 .06547 Are all your habits good and desirable ones? 50 1.9000 .30305 .04286 Do you tend to keep in the background on social
occasions? 50 1.5800 .49857 .07051
Do you prefer to go your own way rather than
act by the rules? 50 1.9600 .19795 .02799
Do you sometimes talk about things you know
nothing about? 50 1.1000 .30305 .04286
Do you prefer reading to meeting people? 50 1.5800 .49857 .07051 Do you enjoy practical jokes that can sometimes
really hurt people? 50 1.9600 .19795 .02799
Are you a worrier? 50 1.7000 .46291 .06547
As a child did you do as you were told
immediately and without grumbling? 50 1.9000 .30305 .04286 Do you think marriage is old-fashioned and
Part B of the EPQ test was also included in the survey questionnaire, in order to identify personality characteristics of people living in different areas, i.e. rural versus urban areas. Table 8 represents the personality findings of the respondents.
Table 8: EPQ Personality Findings of Respondents
From Table 8, there are four (4) types of personality that can be measured indicating respondents’ mental health, which are extraversion/introversion, neuroticism, psychoticism and lie. Extraversion is indicating people that are sociable and active, while introversion is seen as over-aroused. The findings show that both urban and rural areas are likely to develop the same Extraversion/Introversion personality, with 15 urban and 14 rural respondents were linked to the Extraversion/Introversion personality On the other hand, the result shows neuroticism is more likely to develop in urban areas than and rural environment. Neuroticism can be defined as personality of emotional impact that is characterized by high levels of negative affect like depression and anxiety. This means that urban dwellers are more likely to develop depression and anxiety than their rural counterpart.
Psychoticism is another type of personalities, which is less defined than extraversion and neuroticism. It is not only associated with the liability to have psychotic episode (or break with reality) but also with aggression. The result shows only two (2) people with a psychoticism personality and both of them are Do most things taste the same to you? 50 1.1200 .32826 .04642
Have people said that you sometimes act too
rashly? 50 1.9000 .30305 .04286
Do you always wash before a meal? 50 1.4000 .49487 .06999 Have you ever insisted on having your own
way? 50 1.7000 .46291 .06547
Would you like other people to be afraid of you? 50 1.6800 .47121 .06664 Do people tell you a lot of lies? 50 1.0400 .19795 .02799 Are you always willing to admit it when you
have made a mistake? 50 1.0600 .23990 .03393 Would you feel very sorry for an animal caught
in a trap? 50 1.7200 .45356 .06414
AVERAGE 1.56 0.37367 0.05285
Type of Personality No. of People
Urban Rural Total
Extraversion/Introversion 15 14 29
Neuroticism 12 2 14
Psychoticism 2 0 2
Lie 3 2 5
from the urban environment. This finding suggests that psychoticism could be an effect of the urbanization. This evolutionary phenomenon is not only a demographic shift, but also encompasses, social, economic and psychological changes that comprise the demographic movement. The rapid increase in urbanization globally may lead to a worldwide health and social issue. Notwithstanding of its benefit, it can affect mental health through the increased of factors and stressors such as polluted environment, reduced social support, overcrowded, and high levels of violence. Therefore, there is a need to evaluate the urban built environment psychology considering how the urban built environment impacts on human mental health issue such as neuroticism and psychoticism. Aside from that, the survey findings analyzed that some of the respondents did not give actual answers to the questions, therefore considered lying in the personality. It is found that five (5) respondents from urban and rural environment did not answer the questions truthfully.
DISCUSSIONS AND SUMMARY
REFERENCES
Abrahamse, W., Steg, L., Gifford, R. & Vlek, C. (2009). Factors influencing car use for commuting and the intention to reduce it: a question of self-interest or morality? Transportation Research Part F: Traffic Psychology and Behaviour, 12(4), 317-324.
Bolderdijk, J., Steg, L., Geller, E., Lehman, P. & Postmes, T. (2013). Comparing the effectiveness of monetary versus moral motives in environmental campaigning. Nature Climate Change, 3(4), 413-416.
Cheng, J. C.-H. & Monroe, M. C. (2012). Connection to Nature Children’s Affective Attitude toward Nature. Environment and Behavior, 44(1), 31-49.
Corral-Verdugo, V. & Pinheiro, J. (2006). Sustainability, future orientation and water conservation. Revue Européenne de Psychologie Appliquée/European Review of Applied Psychology, 56(3), 191-198.
Department of Statistics. (2010). Basic Population Characteristics by Administrative Districts. Putrajaya, Malaysia: Department of Statistics Malaysia.
Ding, D. & Gebel, K. (2012) Built environment, physical activity, and obesity: what have we learned from reviewing the literature? Health Place (2012) 18(1).
Eysenck, H. J., & Eysenck, S. B. G. (1975). Manual of the Eysenck Personality Questionnaire (Junior and Adult). Kent, UK: Hodder & Stoughton.
Engqvist Jonsson, A.-K. & Nilsson, A. (2014). Exploring the relationship between values and pro-environmental behaviour: the influence of locus of control. Environmental Values, 23(3), 297-314.
Evans, L., Maio, G. R., Corner, A., Hodgetts, C. J., Ahmed, S. & Hahn, U. (2013). Self-interest and pro-environmental behaviour. Nature Climate Change, 3(2), 122-125.
Fielding, K. S. & Head, B. W. (2012). Determinants of young Australians’ environmental actions: the role of responsibility attributions, locus of control, knowledge and attitudes. Environmental Education Research, 18(2), 171-186.
Fraj, E. & Martinez, E. (2006). Influence of personality on ecological consumer behaviour. Journal of Consumer Behaviour, 5(3), 167-181.
Gärling, T. (2001). Environmental Psychology: Overview. In N. Smelser & P. Baltes (Eds.) International Encyclopedia of the Social & Behavioral Science. Elsevier. Gifford, R. (2014). Environmental psychology matters. Psychology, 65(1), 541.
Gifford, R., & Sussman, R. (2012). Environmental attitudes. In S. Clayton (Ed.). Handbook of environmental and conservation psychology. Oxford, UK: Oxford University Press.
Günther, H. (2009). The environmental psychology of research. Journal of Environmental Psychology, 29(3), 358-365.
Health and Safety Executive. (2015). Stress and mental health at work. Retrieved from http://www.hse.gov.uk/stress/furtheradvice/stressandmentalhealth.htm
Heath, Y. & Gifford, R. (2006). Free-market ideology and environmental degradation the case of belief in global climate change. Environment and Behavior, 38(1), 48-71.
Marshall, M. N. (1996). Sampling for qualitative research. Family Practice, 13(6), 522-525.
McMillan, T.E., (2005). Urban form and a child’s trip to school: The current literature and a framework for future research. Journal of Planning Literature, 19(4): 440– 456.
Milfont, T. L. & Gouveia, V. V. (2006). Time perspective and values: an exploratory study of their relations to environmental attitudes. Journal of Environmental Psychology, 26(1), 72-82.
Milfont, T. L. & Sibley, C. G. (2012). The big five personality traits and environmental engagement: associations at the individual and societal level. Journal of Environmental Psychology, 32(2), 187-195.
Moser, G. (2012). Cities. In S. Clayton (Ed.) The Oxford Handbook of Environmental and Conservation Psychology (pp. 203-220). New York: Oxford United Press. Pedro, A. A., Octávio, M., Mário R. S. (2016). Psychometric properties of the European
Portuguese version of the Eysenck Personality Questionnaire — Revised (EPQ-R). Personality and Individual Differences, Volume 88, 88-93.
Robelia, B. & Murphy, T. (2012). What do people know about key environmental issues? A review of environmental knowledge surveys. Environmental Education Research, 18(3), 299-321.
Saunders, C. D. (2003). The emerging field of conservation psychology. Human Ecology Review, 10(2), 137-149.
Tabernero, C. & Hernández, B. (2011). Self-efficacy and intrinsic motivation guiding environmental behavior. Environment and Behavior, 43(5), 658-675.
Tang, Z., Chen, X., & Luo, J. (2011). Determining socio-psychological drivers for rural household recycling behavior in developing countries: a case study from Wugan, Hunan, China. Environment and Behavior, 43(6), 848-877.
Thøgersen, J. & Grønhøj, A. (2010). Electricity saving in households - a social cognitive approach. Energy Policy, 38(12), 7732-7743.
Thompson, C. W., Aspinall, P. & Montarzino, A. (2008). The childhood factor: adult visits to green places and the significance of childhood experience. Environment and Behavior, 40(1), 111-143.
Wells, N. M. & Lekies, K. S. (2006). Nature and the life course: pathways from childhood nature experiences to adult environmentalism. Children Youth and Environments, 16(1), 1-24.
WHO (2016). Urban Population Growth. Retrieved from
http://www.who.int/gho/urban_health/situation_trends/urban_population_grow th_text/en/