Application of Clustering
Algorithm CLOPE to the Query
Grouping Problem in the Field of
Materialized View Maintenance
Kateryna Novokhatska and Oleksii Kungurtsev
Odessa National Polytechnic University, System Software Department, Odessa, Ukraine
In recent years, materialized views (MVs) are widely used to enhance the database performance by storing pre-calculated results of resource-intensive queries in the physical memory. In order to identify which queries may be potentially materialized, database transaction log for a long period of time should be analyzed. The goal of analysis is to distinguish resource-intensive and frequently used queries collected from database log, and optimize these queries by implementation of MVs. In order to achieve greater efficiency of MVs, they were used not only for the optimization of single queries, but also for entire groups of queries that are similar in syntax and execution results. Thus, the problem stated in this article is the development of approach that will allow forming groups of queries with similar syntax around the most resource-intensive queries in order to identify the list of potential candidates for materialization. For solving this problem, we have applied the algorithm of categorical data clustering to the query grouping problem on the step of database log analysis and searching can-didates for materialization. In the current work CLOPE algorithm was modified to cover the introduced problem. Statistical and timing indicators were taken into account in order to form the clusters around the most resource intensive queries. Application of modified algorithm CLOPE allowed to decrease calculable complexity of clustering and to enhance the quality of formed groups.
ACM CCS (2012) Classification: Information systems
→ Data management systems → Database manage-ment system engines→Query optimization;
Computing methodologies→Cluster analysis
Keywords: query, grouping, clustering, materialized view, CLOPE, categorical data
1. Introduction
Materialized view (MV) is one of the effecti-ve ways to enhance the database performance.
MV represents the pre-calculated results of the queries stored in the physical memory. Im-plementation of MV makes it possible to sig-nificantly reduce the query execution time by decreasing the number of calls to the physical memory and eliminating the resource-intensive operations such as sorting and joining[1-2]. In order to achieve greater efficiency of MVs, they were used not only for the optimization of single queries, but also for entire groups of queries that are similar in syntax and execution results. Thus, the creation of automated tools for clustering queries with similar syntax be-came a live issue of computer science[3]. The evolution of automated creation of MVs brought up a number of problems for resolu-tion. It is recommended to create MVs for the most resource-intensive and frequently ex-ecuted queries. In addition, whenever base ta-bles are updated, MVs require refresh based on the information about these modifications. Thereby, materialization of frequently updated data is ineffective. These statements should be taken into account during development of clus-tering algorithms in order to provide an oppor-tunity to form clusters around the most inten-sive and frequently executed queries and reduce maintenance costs of future MVs.
number of queries in the transaction log can be significant. Thus, clustering algorithms and ap-proaches require reducing of the computational complexity and resource intensity.
The family of SQL dialects is constantly en-hanced by adding new language constructions, modifying existing statements or making ob-solete certain phrases. Therefore, the clus-tering algorithms should be scalable in terms of database manipulation language evolution. Support of the full syntax of the SQL language improves the quality of the formed clusters and, as a result, allows creation of more effective MVs[4].
2. Analysis of Recent Research and
Publications
The grouping algorithm for MVs was firstly proposed in[5]. In the context of MVs, group-ing means the selection of queries similar by the following criteria:
1) Data manipulation operator (SELECT, IN-SERT, UPDATE, DELETE) is identical for all queries in a group;
2) The same tables are accessed by the queries; 3) The filtering conditions of one query cov-ers the similar filtering conditions of another query;
4) Query result sets are intersecting for all queri-es in a group;
5) Queries have similar syntax(the same group-ing construction, aggregation or analytic fun-ctions, etc. are used).
The method[5]runs through comparing the ta-bles, columns, and conditional predicates in-volved in the queries. The authors proposed the following main stages of query comparison: 1) Comparing the sets of tables by analyzing
FROM clauses of each query;
2) Comparing the sets of fields obtained from the SELECT and WHERE clauses;
3) Comparing the WHERE conditions:
a. Casting WHERE clause to the canonical form;
b. Analyzing the logical structure of the WHERE clause in disjunctive form;
c. Comparing the relation expressions;
d. Comparing the individual arithmetic expres-sions.
The main disadvantages of this method are: 1) Lack of consideration of statistical and
tim-ing indices of query execution. It is recom-mended to create MV for the most resource-intensive and frequently executed queries. Withal, the method [5] considers only syn-tactic similarity of queries during clustering, without taking into account their execution time and frequency, as well as the amount of consumed resources;
2) High computational complexity of the task: a. In order to form the groups of queries as
de-scribed in[5], an exhaustive search of queries must be performed at each stage of the algo-rithm. Thus, the complexity of the algorithm equals(N−1)N, whereN is the number of
unique queries in the transaction log. N in turn can reach significant orders(thousands and tens of thousands values),
b. Algorithm is implemented based on compar-ison of the textual data that is not effective in terms of consumption of computing re-sources,
c. All steps of the algorithm are performed on the full arrays of input data;
3) Fixed width of obtained clusters. Since the clusters are formed based on the similarity of queries, there is no possibility to expand the clustering criteria (to take into account the number of resources allocated for the MVs, etc.).
3. Unsolved Aspects of the Problem
We propose to apply more generic algorithms of clustering the categorical data to the task of query grouping.
2) There should be a transformation of textual data into numeric vectors to decrease a re-source use during clustering;
3) The algorithm should group queries, distin-guishing them by the syntactic structure; 4) Statistical and timing indicators of query
ex-ecution should be considered during cluster-ing;
5) Result groups should be suitable for the in-verse transformation of the numeric vectors into textual data;
6) Algorithm should be productive and con-sume minimum amount of resources to store the service structure, as it will be applied to very large data sets;
7) Algorithm must be easy to implement.
4. Analysis of the Existing Algorithms
We have investigated the following families of algorithms for categorical data clustering: I. Density-Based Clustering (e.g. DBSCAN
[6], OPTICS[7]);
II. Hierarchical algorithms(e.g. COBWEB[8], BIRCH[9], ROCK[10], LIMBO[11]); III. Histogram algorithms (e.g. k-ANMI [12],
CLOPE[13], K-Histograms[14]);
IV. Genetic algorithms (e.g. G-ANMI [15], TCSOM[16], GSC[17]);
V. Spectral clustering(e.g. SpectralCAT[18], COOLCAT[19]).
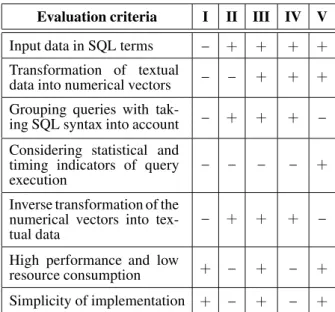
Table 1 shows how the investigated algorithms meet the requirements for grouping queries. After the comparative analysis, the algorithm CLOPE was chosen [20]. The essence of this algorithm lies in comparing the histograms of the input queries.
Algorithm CLOPE was chosen due to the fol-lowing factors:
1) The algorithm is applicable to the input data represented as a numeric vector, each ele-ment of which corresponds to the SQL to-ken;
2) The algorithm operates histograms that al-low the most accurate comparison of SQL queries;
Table 1.Comparative analysis of data clustering algorithms.
Evaluation criteria I II III IV V
Input data in SQL terms – + + + +
Transformation of textual
data into numerical vectors – – + + + Grouping queries with
tak-ing SQL syntax into account – + + + – Considering statistical and
timing indicators of query
execution – – – – +
Inverse transformation of the numerical vectors into
tex-tual data – + + + –
High performance and low
resource consumption + – + – +
Simplicity of implementation + – + – +
3) Generalized query for MV creation can be obtained on the basis of calculated histograms; 4) Algorithm is productive, simple to
imple-ment and requires a minimum number of resources for storing intermediate data. It was decided to modify the algorithm for tak-ing into account statistical and timtak-ing indicators of the input queries.
5. Statement of the Problem
The aim of this work is the application of a clustering algorithm CLOPE to the problem of grouping queries to reduce the computational complexity of the problem and to improve the quality of formed clusters by taking into account the statistical and timing indicators of query ex-ecution.
6. Input Data
After the analysis of transaction log of informa-tion system for a large period of timeT, the set of non-unique queries of different types(SELECT, INSERT, UPDATE, DELETE)was formed with the time of their execution and the amount of consumed resources:
where:
t– query text;
– query execution time;
b – number of data blocks processed by the query.
We introduce the coefficientKthat shows how query is “suitable” for materialization. In gen-eral, normalized value ofbcan be used asK. In
[21]a more precise and multifactorial algorithm of calculatingKwas proposed, which took into account the statistical and timing indicators of the query execution.
We divide the set of queries Q into 4 groups according to the type of data manipulation op-erator. We consider onlyNqueries ofSELECT
type from the set Q during further analysis. Other types of queries are excluded from con-sideration as MVs are not created on their basis:
S=
N
i=1
siti,i,bi
In order to perform the conversion of the query from SQL text to a numeric vector, we divide the query into atomic tokens. An atomic to-ken is one or more SQL expressions such as field names, table names and aliases, constants, functions, operators that are minimal seman-tic units in the formation of SELECT, FROM, WHERE clauses, sorting conditions, grouping conditions, etc.
Vocabulary of tokensV is the set of unique to-kens found while parsing S. Each vocabulary entry is described by deuce: the current token and its numeric identifier(serial number)in the vocabularyV.
For each query si, i = 1, . . . ,N we will form
the vector Di having a set of tokens from the
vocabularyVfound while parsing the query. To simplify the data processing, while forming the vectorDi, we will operate with serial numbers
from the vocabularyV instead of tokens them-selves. The number of occurrences of token in vectorDi may be greater than 1. The detailed
algorithm of the formation of tokens for group-ing queries is presented in[22]. In the next step we transform the setSto the following form:
S=
N
i=1
siti,Di,Ki
Below an example of parsing queryS1into
nu-merical vectorD1is provided:
S1 := select s1.rt object id, s1.reference,
np.object id value from params np,
(select connect by root nr.object id rt, nr.reference from references nr
where nr.attr id = 1
start with nr.object id in(2, 3)
and nr.attr id = 4
connect by prior nr.reference
= nr.object id and nr.attr id
= 5
order by LEVEL)s1
where np.object id
= s1.referenceand np.attr id
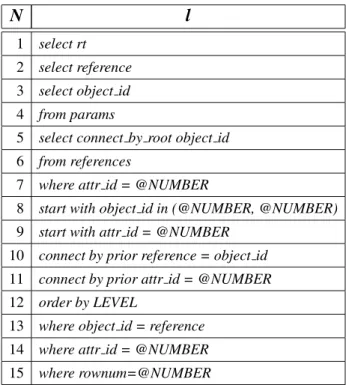
= 6and rownum=7; For clarity, a phrase in which the token was found (’select’, ’from’, etc.) was added as a prefix to each token.
Table 2.Example of dividing a query into set of tokens.
N l
1 select rt 2 select reference 3 select object id 4 from params
5 select connect by root object id 6 from references
7 where attr id = @NUMBER
8 start with object id in (@NUMBER, @NUMBER) 9 start with attr id = @NUMBER
10 connect by prior reference = object id 11 connect by prior attr id = @NUMBER 12 order by LEVEL
After analysis of the query, the following nu-meric vector is obtained:
D1 ={1,2(2),3,4,5,6,7,8,9,10,11,12,13,
14,15}.
As it can be seen, the token
L2"select reference"
occurs in vectorD1twice.
Similarly to the previous example, we parse the queryS2using the existing vocabularyV:
S2:= select s1.rt object id
from references
where attr id=9
and rownum=10;
As a result we obtain the following vector:
D2 ={3,6,14,15}.
7. Data Clustering
By a cluster we mean a group of queries that meet the previously mentioned criteria of simi-larity. Cluster can be considered as an indepen-dent unit with certain characteristics.
A set of clustersCis a partition ofSsuch that:
⎧ ⎨ ⎩C=
E
j=1
cj=S|ck
cj=∅,k=1, ...,E,k=j
⎫ ⎬ ⎭
As soon as the clustercj,j=1, . . . ,Eis a subset
ofS, its elements can be described as triples of the formt,D,K.
Each cluster is characterized by the following parameters:
− W(cj) – cluster width. Corresponds to the
number of unique tokensLin the clustercj;
− O(cj)– the number of queries in the cluster
cj;
− Occ(Ln,cj) – number of occurrences of a
unique token Ln,n = 1, . . . ,W(cj) in the
clustercj;
− P(cj)– cluster power, corresponds to the
to-tal number of tokens in the clustercj:
P(cj) = W(cj)
n=1
Occ(Ln,cj) (1)
− H(cj)– cluster height:
H(cj) = P(cj)
W(cj) (2)
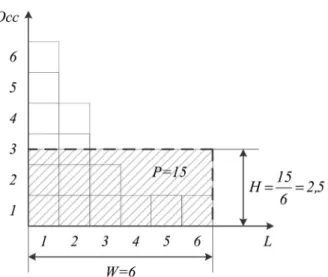
Histogram of clustercjis called a graphical
rep-resentation of its characteristics: the horizon-tal axis shows tokens, in descending order of
Occ(Ln,cj), the vertical axis shows the value
Occ(Ln,cj)itself. Cluster powerP(cj)
geomet-rically corresponds to the area of the histogram. As an example, consider the cluster:
c1=[{1,6},{2,4},{3,2},{4,1},{5,1},{6,1}].
The histogram of the clusterc1is shown in
Fig-ure 1.
Figure 1. Histogram of the clusterc1.
We propose to split the clustering algorithm CLOPE into several stages:
Stage 1: Initialization of clusters
In order to form the clusters around the most re-source intensive and frequently executed queries, we propose to introduce an additional step for cluster initialization. For this purpose, we sort the queries in descending order by coefficient
be arbitrarily selected regarding the administra-tive restrictions on the number of MV in the system.
For each query si, i = 1, . . . ,V we form the
clustercj,j=1, . . . ,E,E=V and calculate its
initial characteristics based on the parameters of the vectorDi:
− W(cj)– the number of unique tokens in
vec-torDi;
− O(cj) =1;
− P(cj) =P(Di);
− Occ(Ln,cj) =Occ(Ln,Dj),n=1, . . . ,W(cj).
An additional empty clustercE+1is created, for
which all parameters are initialized with zero value.
To the above mentioned query notationsiwe add
the fourth element Cnumi – number of cluster
assigned to the current query:
siqi,Di,Ki,Cnumi,i=1, . . . ,N
If the cluster has not been assigned yet,Cnumi=0.
We distribute the remaining queries from the sorted setSacross the clusters:
1. Retrieve the querysi,i=V+1,dots,Nfrom
the setS.
2. For the currentsiiterate through the clusters.
3. For the current value of si and cj calculate
profit functionQij. This function shows how
the inclusion of querysito clustercj affects
the characteristics of the cluster. The higher the value of Qij, the more common tokens
were found when comparing the query with cluster histogram. Thus, the purpose of the clustering is to maximizeQij.
For calculation ofQij we determine the
up-dated characteristics of cluster cj including
querysi:
W(cj)new =W(cj) +|{Lm|Lm ∈Di,
Lm ∈/ cj},m=1, . . . ,W(Di)| (3)
P(cj)new =P(cj) +P(Di) (4)
In the classical interpretation of algorithm CLOPE height H(cj)new can be calculated
as follows:
H(cj)new=
P(cj)+ W(Di)
m=1 Occ(Lm,Di)
W(cj)new
(5)
In order to regulate the impact of the new entry ofsiinto the clustercjaccording to the
“usefulness” of the query from the perspec-tive of materialization, we add coefficientK
to the formula 5. For this purpose we rep-resent the cluster cj as a set of queries sv,
v = 1, . . . ,O(cj), each of which is
charac-terized by its own value Kv and vectorDv.
ExpandP(cj)as:
P(cj) = O(cj)
v=1
P(Dv) (6)
Thus we obtain:
H(cj)new
=
O(cj)
v=1
KvP(Dv)+Ki W(Di)
m=1
Occ(Lm,Di)
W(Cj)new
(7)
Calculate the profit functionQij:
Qij= H(cj)
new(O(c j)+1)
W(cj)new −
H(cj)O(cj)
W(cj) (8)
For the case whenO(cj)=0:
Qij = H(cj)
new(O(c j) +1)
W(cj)new (9)
4. Ifj≤E, proceed to step 2. Otherwise, pro-ceed to step 5.
5. Include querysiinto the clustercmax, which
corresponds to the maximum value of profit functionQij:
Cnuminew ={max|Qimax =MAXjE=+11(Qij)},
siqi,Di,Ki,Cnumnewi ,i=1, . . . ,N.
(10)
6. Update the histogram of cluster cmax. For
this purpose, for each token of the vectorDi
check the existence of an appropriate token in the clustercmax. If the token was found:
Occ(Ln,cmax)new=Occ(Ln,cmax)
Otherwise, add a new token to the cluster
cmax:
Occ(LM+1,cmax)new=Occ(Lm,Di),
M =W(cmax) (12)
7. Update the cluster characteristics according to formulas(3),(4)and(7).
8. If the current value of O(cmax) = 0, then
initialize a new empty cluster: E = E+1. Increment the number of queries in the se-lected cluster:
O(cmax) =O(cmax) +1 (13)
9. If i ≤ N, proceed to step 1. Otherwise, proceed to step 10.
10. Complete the initialization stage.
Stage 2:Iterative distribution of queries across clusters
1. Initialize the valuesi = 1, j = 1, a counter of permutationsZ =0.
2. Retrieve the querysi,i= 1, . . . ,Nfrom the
setS.
3. For the currentsiiterate through the clusters.
4. If Cnumi = j, then the query must be
re-moved from the cluster before the new clus-ter is calculated for it.
4.1. Recalculate histogram of the cluster. For each token Ln,n = 1, . . . ,W(cj) of the
clustercjandLm,m=1, . . . ,W(Di)of the
vectorDi, ifLn=Lm:
Occ(Ln,cj)remove =Occ(Ln,cj)
−Occ(Lm,Di) (14)
IfOcc(Ln,cj)remove =0, exclude the token
from the clustercj:
W(cj)remove=W(cj)−1 (15)
Otherwise:
W(cj)remove =W(cj) (16)
4.2. Update the cluster characteristics:
P(cj)remove =P(cj)−P(Di);
O(cj)remove =O(cj)−1;
H(cj)remove = P(cj) remove
W(cj)remove
5. According to the formula (8) or (9), cal-culate the current value of Qij. If j ≤ E,
proceed to step 3. Otherwise, proceed to step 6.
6. According to the formula (10) for the cur-rentsi, select clustercmax corresponding to
the maximum value ofQij.
7. Calculate new characteristics of the selected cluster according to the formulas (3), (4) and(7).
8. If the current value ofO(cmax) =0, initialize
a new empty cluster: E =E+1. Increment the number of queries in the selected cluster according to the formula(13).
9. IfCnumi=Cnumnewi , then increment counter
of permutations: Z =Z+1.
10. IfCnumi = Cnumnewi and O(cCnumi) = 0,
remove the empty clustercCnumi.
11. If i ≤ N, proceed to step 2. Otherwise, proceed to step 12.
12. IfZ >0, move to step 1. Otherwise, output the result.
8. Experiment
All tests have been executed in 64-bit JVM, JDK v.7.0, 1 GB heap space on Intel CoreTM i3-4000M CPU, 2.4 GHz PC with 8 GB RAM and 500 GB SATA disk. For the experiment, a transaction log has been used, which contained more than 2,000 non-unique queries involving aggregation operations, multiple joins, hierar-chical queries, analytic functions etc. It was derived from commercial production database deployed on Oracle 10g EE DB server. The data was collected during one-week period. As a result of filtering, 502 unique queries were obtained. After lexical processing of data, a vocabulary was formed containing 393 tokens. The following measures were chosen as quality indicators of the formed clusters:
Msimilarity=1
E
E
i=1
1
O(Ci) · O(Ci)
j=1
| {Lm|Lm ∈Dj,Lm ∈Ci},m=1, . . . ,W(Dj)|
W(Dj)
·100,
whereE– total number of clusters.
It indicates how much “similar” queries form a cluster. For values tending to 100%, it can be concluded that the groups will be formed for virtually identical queries which makes them narrowly applicable. For small val-ues of the index “broad”, clusters will be obtained, which in the future may not be op-timal in terms of maintenance and storage. It has been experimentally established that the optimum value of the index ranges from 70% to 90%;
2) The mean distance between clusters – the average value of “Manhattan distance” as a measure of the difference of two clusters:
MManh= E
i=1 E
j=1
Occ(Ln,Ci)−Occ(Ln,Cj)
(E−1)2 ,
i= j,n=1, . . . ,W(Ci)=1, . . . ,W(Cj),
whereCiandCj– clusters aligned in width:
Ci=Ci
{Lk,0 },Lk ∈Cj,Lk ∈/ Ci,
k=1, . . . ,W(Cj);
Cj=Cj
{Lm,0 },Lm ∈Ci,Lm ∈/ Cj,
m=1, . . . ,W(Ci).
As a percentage the value is calculated as follows:
MManh,%=1
E
·
E
i=1 E
j=1
Occ(Ln,Ci)−Occ(Ln,Cj)
P(Ci+Cj) ·100
3) The minimum distance between clusters:
Mmin=minOcc(Ln,Ci)−Occ(Ln,Cj),
i=1, . . . ,E,j=1, . . . ,E,i=j, n=1, . . . ,W(Ci) =1, . . . ,W(Cj)
4) The maximum distance between clusters:
Mmax =maxOcc(Ln,Ci)−Occ(Ln,Cj),
i=1, . . . ,E,j=1, . . . ,E,i=j, n=1, . . . ,W(Ci) =1, . . . ,W(Cj)
5) The percentage of single clusters – the ratio of the number of clusters that contain only one query to the total number of calculated clusters. From the perspective of grouping queries, this indicator identifies the num-ber of queries that are not of interest in the problem of creating MV. Since the purpose of grouping is not a complete coverage of queries coming into the system, the optimal value of this index is the range of 40−60%; 6) The percentage of single tokens in the clus-ter – the ratio of the number of tokens in the cluster for which the valueOcc(L, C) is equal to one. It shows which part of the cluster could potentially be excluded from participation in the further processing of the group;
7) The number of iterations of the algorithm; 8) Data processing time – is a measure of
per-formance of the algorithm; 9) Amount of memory consumed.
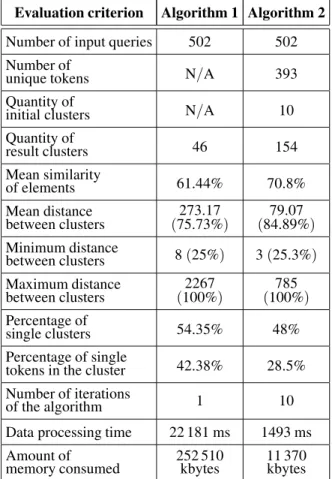
Based on the selected criteria, a comparative analysis of the algorithm from the work[5] ( “Al-gorithm 1”)and the modified algorithm CLOPE
(“Algorithm 2”)was performed. The table be-low shows the results.
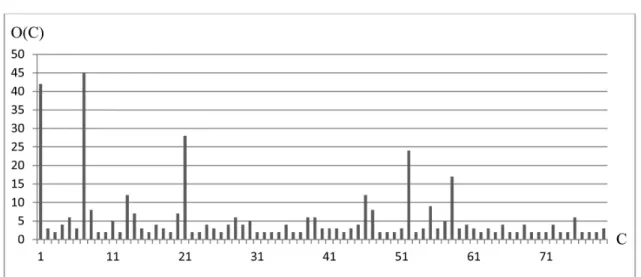
Figures 2 and 3 show histograms of clusters obtained by applying the algorithms 1 and 2
(without single clusters). The vertical axis rep-resents the number of queries that form a cluster, while the horizontal axis represents the number of clusters.
clusters and lower rate of similarity of elements within the cluster show that scattered queries form the groups. As a result, “broad” materi-alized views will be created, which will not be optimal in terms of maintenance and storage.
Table 3.Results of the comparative analysis.
Evaluation criterion Algorithm 1 Algorithm 2
Number of input queries 502 502 Number of
unique tokens N/A 393
Quantity of
initial clusters N/A 10
Quantity of
result clusters 46 154
Mean similarity
of elements 61.44% 70.8%
Mean distance
between clusters (75.73%273.17) (84.89%79.07 )
Minimum distance
between clusters 8(25%) 3(25.3%) Maximum distance
between clusters (100%2267) (100%785 )
Percentage of
single clusters 54.35% 48%
Percentage of single
tokens in the cluster 42.38% 28.5% Number of iterations
of the algorithm 1 10
Data processing time 22 181 ms 1493 ms Amount of
memory consumed 252 510kbytes 11 370kbytes
Figure 2 shows in turn a wider range of clus-ters. Groups of queries are much smaller and their size is more uniform. It gives the grounds to consider that the clusters were formed more precisely. As soon as the average distance be-tween the clusters and the rate of similarity of el-ements within the cluster were increased, more common queries from the syntax perspective formed the clusters. Thus, the maintenance cost of future MVs created for the formed clusters will be decreased.
Based on the experimental data, the following conclusions can be made:
1. The performance of the modified algorithm CLOPE is 15 times better than the previous solution;
2. Resource consumption of Algorithm 2 is 22 times lower than the previous solution; 3. The quality of the clusters has increased: 3.1. The average distance between clusters
in-creased by 9.16%;
3.2. The average similarity of the elements within the cluster increased by 9.36%;
3.3. The percentage of single clusters decreased by 6.35%;
3.4. The percentage of single tokens in the clus-ter decreased by 13.88%;
3.5. The number of clusters increased 3.16 times.
Figure 3. The distribution of queries across clusters obtained by the Algorithm 2.
9. Conclusion
In this paper, clustering algorithm for textual data has been applied to the problem of group-ing queries durgroup-ing selection of MVs. Based on the results of the comparative analysis, CLOPE algorithm was chosen from the set of existing solutions. It was further improved to meet the requirements for the quality of future MVs in the context of MV selection problem.
Modification of the algorithm allowed:
1. To consider statistical and timing indicators of the query execution. Thus, the MVs will be formed around the most resource-intensive and frequently executed queries; 2. To reduce the computational complexity of
the task through the use of more efficient algorithms of clustering;
3. To reduce the resource consumption of the algorithm by avoiding operating textual data and transitioning to numerical operations; 4. To group queries more precisely in terms
of the query syntax, as evidenced by the decrease in the percentage of single clus-ters and the increase in the total number of formed groups;
5. To form higher-quality MVs by increasing the average distance between the clusters and the rate of similarity of elements within the cluster. The data stored in the MVs will intersect less and more closely match the queries accessing them.
References
[1] A. B. Kungurtsev and Y. N. Vozovikov, “Materi-alized views management in information systems”, Eastern European Journal of Advanced Technolo-gies, vol. 1/4, no. 43, pp. 18–21, 2010.
[2] A. B. Kungurtsev and Y. N. Vozovikov, “Support-ing the effectiveness of the control of materialized views”,Electrotechnic andComputer Systems, vol. 4, no. 80, pp. 136–140, 2011.
[3] K. A. Novokhatska and Y. N. Vozovikov, “The method of update function generation for the incre-mental maintenance of materialized views”.Visnyk SumDU, Seriya “Tehnichni nauky”, vol. 3, pp. 82–96, 2011.
[4] A. B. Kungurtsev and Quoc Vinh Nguyen Tran, “The analysis of feasibility of applying the mate-rialized views in information systems”, inProc. of OPU, vol. 2, no. 2, 2003, pp. 102–106.
[5] A. B. Kungurtsevet al., “Comparison of queries in relational databases to build materialized views”, in Proc. of UNDIRT, vol. 3, no. 39, 2004, pp. 35–38.
[6] M. Ester et al., “A density-based algorithm for discovering clusters in large spatial databases with noise”, in Proc. of the KDD, vol. 96, 1996, pp. 226–231.
[7] M. Ankerst et al., “OPTICS: Ordering Points To Identify the Clustering Structure”, Proc. of ACM-SIGMOD International Conference on Management of Data, pp. 49–60, 1999.
http://dx.doi.org/10.1145/304181.304187
[8] D. Fisher, “Knowledge AcquisitionVia Incremental Conceptual Clustering”,Machine Learning, vol. 2, 1987, pp. 139–172.
[9] T. Zhanget al., “An efficient data clustering method for very large Databases”,Proc. of ACM SIGMOD International Conference on Management of Data, 1996, pp. 103–114.
http://dx.doi.org/10.1145/233269.233324
[10] S. Guha et al., “ROCK: a robust cluster-ing algorithm for categorical attributes”, Infor-mation System, vol. 25, no. 5, pp. 345-366, 2000. http://dx.doi.org/10.1016/S0306-4379(00)
00022-3
[11] P. Andritsoset al., “LIMBO: Scalable Clustering of Categorical Dana”,Proc. of EDBT’04, 2004, pp. 123–146.
http://dx.doi.org/10.1007/978-3-540-24741-89
[12] Z. He et al., “A mutual information based clus-tering algorithm for categorical dana”,Information Fusion, vol. 9, no. 2, 2008, pp. 223–233.
http://dx.doi.org/10.1016/j.inffus.2006.05.006
[13] Y. Yanget al., “CLOPE: a fast and effective clus-tering algorithm for transactional dana”, Proc. of KDD’02, 2002, pp. 682–687.
http://dx.doi.org/10.1145/775047.775149
[14] Z. Heet al., “K-Histograms: An Efficient Cluster-ing Algorithm for Categorical Dataset”, Technical Report. Tr-2003-08, Harbin Institute of Technology, 2003.
[15] S. Deng et al., “A mutual information based ge-netic clustering algorithm for categorical dana”, Knowledge-Based Systems, vol. 23, no. 2, 2010, pp. 144–149.
http://dx.doi.org/10.1016/j.knosys.2009.11.001
[16] Z. He et al., “TCSOM: Clustering Transactions Using Self–Organizing Map”, Neural Processing Letters, 2005.
http://dx.doi.org/10.1007/s11063-005-8016-3
[17] H. Wang et al., “A Genetic Spectral Clustering Algorithm”,Journal of Computational Information Systems, vol. 9, pp. 3245–3252, 2011.
[18] G. David and A. Averbuch, “SpectralCAT: Categor-ical spectral clustering of numerCategor-ical and nominal dana” Pattern Recognition, vol. 45, pp. 416–433, 2010.
http://dx.doi.org/10.1016/j.patcog.2011.07.006
[19] D. Barbara et al., “COOLCAT: an entropy–based algorithm for categorical clustering”, Proc. of the 11th International Conference on Information and Knowledge Management, 2002, pp. 582–589. http://dx.doi.org/10.1145/584792.584888
[20] K. A. Novokhatska and A. B. Kiper, “Reducing the computational complexity of query grouping using the algorithm CLOPE”,Proc . of Intellectual Technologies in System Programming, 2013, pp. 120–121.
[21] K. A. Novokhatska and A. B. Kungurtsev, “Calcu-lating the materialization factor in query evaluation during the maintenance of materialized views”, Visnyk KhNTU, vol. 2, 2015.
[22] K. A. Novokhatska and A. B. Kungurtsev, “For-mation of tokens in query grouping in the method of incremental maintenance of materialized views”, Visnyk ChDTU. Seriya ”Tehnichni nauky”, vol. 1, no. 71, 2014, pp. 193–199.
Received:February, 2015
Revised:November, 2015
Accepted:December, 2015
Contact addresses:
Kateryna Novokhatska Odessa National Polytechnic University System Software Department Odessa Ukraine e-mail: [email protected] Oleksii Kungurtsev Odessa National Polytechnic University System Software Department Odessa Ukraine e-mail: [email protected]
KATERYNANOVOKHATSKA: She graduated from Odessa National Poly-technic University in 2012 with a Master’s degree in Computer Science. She is currently a PhD student at ONPU. Her research interests include database performance, advanced query optimization, and materialized views.