1
Mediation and Moderation Analysis from the Perspective of
Behavioral Science
Sharifah Khairol Musairah
Fakulti Pengurusan & Perniagaan, Universiti TeknologiMARA, 02600 Arau, Perlis, Malaysia
Abstract
Mediation and moderation are theories for understanding causal relationships. The purpose of this article is to make researchers aware the difference between mediator and moderator. Research that combines mediation and moderation are common in either basic or applied behavioral research. Usually, this kind of research is structured in terms of mediated moderation or moderated mediation. Unfortunately, many researchers use the terms mediator and moderator interchangeably; not realizing the difference between the two. Therefore, in this article, the differences between a mediator and a moderator are outlined. This article described conceptual basis, research model, data analysis and construct validity issues that are necessary for making inferences in mediation and/or moderation analysis. Then, this article defines the mediating variable and how it differs from moderating variable. Next, longitudinal mediation model, model with moderators as well as mediators, and causal inference for mediation models are described. An empirical illustration is provided using structural equation modeling (SEM) techniques. Statistical methods to analyze mediation and moderation as well as newer techniques are described. Future directions using mediators and moderators with more elaborate models such as moderated mediation and mediation moderation are discussed conceptually.
Keywords: mediator, moderator, interaction, analysis, model
Introduction
The purpose of this article is to differentiate between the concept of a mediator and a moderator variable in such a way that the conceptual variables may justify the differences in individuals’ behavior (Edwards & Lambert, 2007; Fairchild & MacKinnon, 2009; Muller, Judd, & Yzerbyt, 2005). This is because there are quite a number of students and lecturers alike are still confused with the function of a third variable; that is, they use the term mediator and moderator interchangeably. Although we can find a lot of literature on the topics of mediation and moderation (Aiken & West, 1991; Baron & Kenny, 1986; MacKinnon, Lockwood, Hoffman, West, & Sheets, 2002), the analytic strategies for the topics are not well understood. The mediator functions as a mechanism through which the independent variable is able to influence the dependent variable; whereas the moderator focuses on the factors that influence the strength and/or direction of the relationship between variables. Mediation indicates that the effect of an independent variable on the dependent variable is transmitted through an intervening variable, which is called a mediator variable (Edwards & Lambert, 2007). In analysis, mediation is known as indirect effect of an independent variable on a dependent variable that goes through
a mediating variable (Shrout & Bolger, 2002). A good example of a mediation is the theory of planned behavior (Ajzen, 1991), which specifies that the influence of attitudes on behavior is mediated by intention. Whereas moderation is involved in studies on individual differences or situational factors that influence the strength of the relationship between a determinant and outcome (Edwards & Lambert, 2007). For example, a study shows the effects of individual characteristics on self-leadership behavior depend on situational factors.
2
1986). The next section will discuss on the mediation analysis followed by interaction /moderator effects. Then, the integration of moderation and mediation will be discussed, followed by methodology of the research and the instruments used to measure the variables. Next, the analytical strategy for hypotheses testing will be discussed, and a discussion of psychometric properties of the instruments used for this study. Finally, discussion of the findings will be presented in conclusion, followed by the implications to researchers.
Mediation Analysis
Mediating variables are important in behavioral science research. Although mediational models are quite common in Organizational Behavior studies, there is a lot of confusion surrounding the foundation of causal inferences. Analyses of mediational designs have been an important part of research in the behavioral sciences for decades (Cole & Maxwell, 2003). Mediation analysis is also used in organizational studies (MacKinnon, Fairchild, & Fritz, 2007; Mathieu & Taylor, 2006). Mediation is similarly of relevance to experimental psychologists as it is to those who study naturally occurring processes through non-experimental analysis. In a lot of studies, a mediator is a mechanism that uncovers possible causal mechanisms. A mediator transmits the effect of an independent variable on a dependent variable (MacKinnon et al., 2007). A mediator acts as a mechanism where an antecedent affects a mediating variable, which in turn affects an outcome. Therefore, a mediator is a behavioral, biological, psychological, or social concept that transmit the effect of independent variable to dependent variable (MacKinnon et al., 2007). In other words, a mediator is a way that researchers can explain a process or mechanism in which one variable affects another.
One of the reasons why mediational design is important is because it is the foundation of many psychological theories (MacKinnon et al., 2007). For instance, in social psychology, attitudes cause intentions, which in turn cause behavior (Ajzen, 1991). In cognitive psychology, memory processes mediate how information is transmitted into a response (MacKinnon et al., 2007). These models are valuable for theory development and testing as well as for the identification of possible situation of intervention in work setting (Shrout & Bolger, 2002). A modern approach of the mediational design is in prevention and treatment research (MacKinnon et al., 2007), whereby interventions are used by hypothesizing the mediator to be causally related to the outcome. Another reason for a growing interest in mediational analysis is due to methodology. This is because a mediator represents
a consideration of how the mediating variable affects the association between independent and dependent variables. Although the theory may seem simple, the methodological and statistical analysis can be challenging in assessing mediational model.
Mediating variable stands between two variables and is considered as the bridge that must be crossed to get from Independent Variable (IV) to Dependent Variable (DV). In other words, mediator is the process by which IV influences DV. In a mediational model, IV is hypothesized to have an effect on an outcome or independent variable (DV) through one or more intervening variables called Mediators (M). In other words, mediational models advance an IV →M → DV causal sequence, and seek to illustrate the mechanisms through which IV and DV are related (Mathieu & Taylor, 2006). If we seek a more accurate explanation of the causal effect the antecedent (predictor) has on the DV (criterion, outcome); then we need to focus on mechanisms that make causal chain possible. Therefore, Mediator may be needed to fill in the missing variables in the causal chain. For example:
Intelligence → Performance
Intelligence → Work Effectiveness → Performance
With this model, we need to justify the causal order of variables including temporal precedence. What this means is that; in mediation analyses, we need a time-based model of events whereby IV occurs before M which in turn occurs before DV (cause and effect). This is due to the temporal relationships of the underlying phenomena. In other words, something must happen first; before it can have an effect on something else. Therefore, Mediator is the means by which IV affects DV.
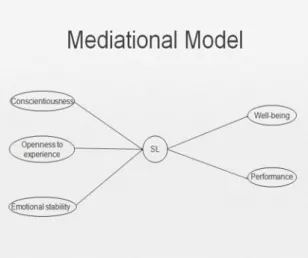
Figure 1: Mediational Model
3
personality traits and work outcomes. Looking at the model, how do you think this process operates? Do you think they operate all at the same time? What are the intervening stages? Assuming employees with high level of conscientiousness, openness to experience, and emotionally stable; who practice self-leadership as a motivational mechanism; then they would perform. Do you think this happen at the same time? Normally, it would take time for an individual to learn self-leadership strategies; then only when one is working can we determine the level of performance. Now, thinking about this; we need to design a longitudinal study. Consider our own research and the research of others. What kinds of research designs have been used and what forms of causal inference do they permit? Remember: correlation does NOT mean causation. Using logic, reason and common sense can be helpful.
It is therefore suggested that the readers consult Cole and Maxwell (2003) and Maxwell, Cole and Mitchell (2011) about the difficulties of estimating mediational effect using a cross-sectional design. They suggested that the results of analyses based on cross-sectional data are unlikely to accurately reflect longitudinal mediation effects (Cole & Maxwell, 2003; Maxwell et al., 2011). Therefore, the timing of measurements is critical – pilot tests are needed. In addition, Cole and Maxwell (2003) suggested not to test mediation hypotheses unless you have longitudinal data (spaced appropriately) for at least two time points, preferably three.
Interaction/Moderator Effects
Moderating variable moderates the relationship between IV and DV. It is to answer the question “what conditions make the relationship stronger or weaker between IV and DV?” Interaction and moderation are referring to the same ideas. This means that effect on one variable (IV) on DV changes with the level of another variable (moderator). In many cases, people confuse two main effects with an interaction. Interaction effects are the joint effects of two predictor variables in addition to the individual main effects. For example, we have a model of performance that suggests intelligence and motivation are predictors of task performance. In research, this means that both intelligence and motivation are important. The IV → DV relationship changes form (gets stronger, weaker, changes signs) depending on the value of another explanatory variable (the moderator). Hence, the best performers are those who are both highly intelligent and highly motivated.
Example of Moderating Variable: IV = Individual characteristics Moderator = Work Condition DV = Performance
For example, work condition tends to influence employees’ performance. However, the effect of work condition is likely to be different depending on the situation.
Autonomy will moderate the relationships between conscientiousness, extraversion, and affective commitment with self-leadership, such that the relationship will be strong and positive when autonomy is high and weak when autonomy is low.
Another example: Time pressure will moderate the relationships between conscientiousness, extraversion, and affective commitment with self-leadership, such that the relationships will be weaker under high time pressure than under low time pressure.
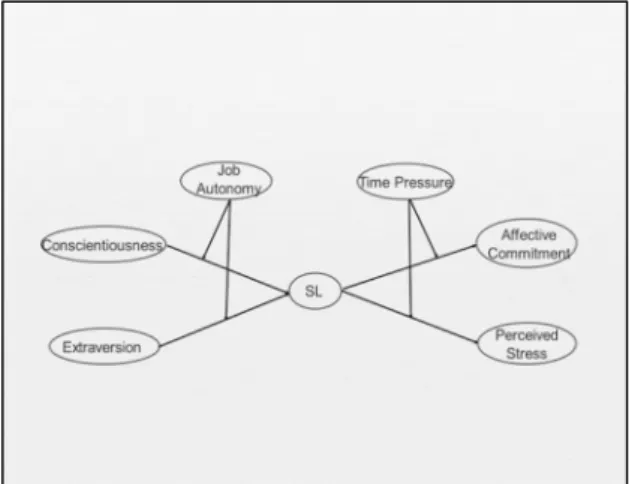
Figure 2: Individual and situational factors impacting self-leadership
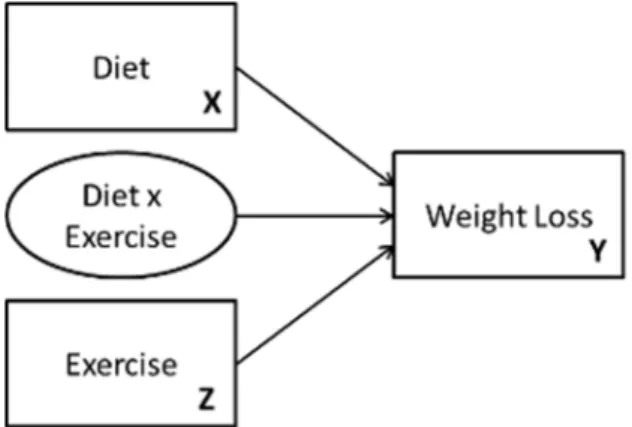
Figure 3: Simple interaction example by Lyytinen and Gaskin (StatWiki) (Gaskin, 2012)
4
you lose 1 pound of weight for every 500 calories you cut back from your regular diet
but when you exercise while dieting, then you lose 2 pounds for every 500 calories you cut back from your regular diet, in addition to the 1 pound you lose for exercising for one hour; thus in total, you lose three pounds
Moderator variables alter the relationship between IV and DV. At particular levels of the moderator, the relationships between IV and DV will be stronger or weaker. In some situations, the direction of the relationship between IV and DV will change from positive to negative. To create interaction variable, we need to center the two main effects: score – mean. Then, we need to multiply the two centered main effects. The basic idea why we restructure IV and moderator variable; and then multiply restructured IV and moderator is to create an interaction term. However, the intercept term is not necessary with double-mean-centering.
Moderation and Mediation
Now when we talk about moderation and mediation model, mediated moderation occurs when the interaction between two variables affects a mediator, which then affects a dependent variable (Morgan-Lopez & MacKinnon, 2006). For example, a study examining one’s intention to share knowledge as a mediator from the effect of attitude toward knowledge sharing on knowledge sharing behavior; in which a moderating effect of situational factors is transmitted through the intention to share knowledge (mediator). In other situation, a moderated mediation occurs when a mediating effect is thought to be moderated by some variables (Edwards & Lambert, 2007). For example, research on the role of situational factors can attenuate the effects of personality traits on self-leadership behavior; meaning that the interaction between personality traits and the role of situational factors can reduce the effect of self-leadership behavior on psychological stress. As such, the role of situational factors moderates the mediated effects of personality traits on psychological stress transmitted through self-leadership behavior.
Figure 4: Moderation and mediation model
Figure 4 above shows the mediating role of self-leadership as a motivational mechanism and the moderating role of work autonomy and time pressure. The moderating role of work autonomy and time pressure is based from the Theory of Situational Strength, which is the interaction between work situation and individual traits on behavior and work outcomes. This is because strong situations may restrain individual characteristics whereas weak situations may promote the demonstration of individual differences.
Methodology
The sample for this study was academics from public universities in Malaysia. This was a non-experimental study in a natural work setting so there was no control group. Instead, the possible confounding variables were controlled and the use of self-leadership strategies was measured across two different time points. In addition, collecting data across two time points as a means of reducing common method variance (CMV) provided the opportunity to conduct a more rigorous examination than a simple cross-sectional approach. This is because CMV is more likely to emerge in simple models (Chang, van Witteloostuijn, & Eden, 2010), whereas this study specified a complex relationships between independent and dependent variables with interaction terms in the model.
5
from a university from each category was used, depending upon the availability, access, and large population of faculty.
Email was used as a first contact to introduce myself, explain the research and alert the potential respondents to an incoming questionnaire. An email invitation was sent two weeks prior to the actual survey. Potential respondents were assured that by virtue of sending the email directly to me, their responses would be confidential. Following the initial email invitation, respondents were sent a first email survey. Follow-up notices were sent two weeks after the initial return date. This study used mixed-mode data collection strategies because there is evidence that switching to a second mode of data collection increases survey response rates (Nulty, 2008). Moreover, mixed-mode surveys provide an opportunity to compensate for the weaknesses of each method (Dillman, 2007). However, mixing modes might create the possibility that people give different answers to each mode; therefore, the issue was minimized by using visual principles for questionnaire design so that respondents receive comparable paper and email questions.
Independent Variables
Conscientiousness. Conscientiousness was measured with 10 items from the International Personality Item Pool (Goldberg et al., 2006). A five-point Likert scale was used for all items ranging from “Very inaccurate” to “Very accurate”. Each scale covered both positively and negatively worded statements and example items of these are: “I am always prepared” and “I shirk my duties”. Extraversion. Extraversion was assessed with ten items from the International Personality Item Pool (Goldberg et al., 2006) on a 5-point Likert-style response scale. This scale covered both positively and negatively worded statements and example items of these are: “I start conversations” and “I don’t talk a lot”.
Moderating Variables
Time Pressure. Time pressure was measured using the 9-item scale (Roxburgh, 2004) on a 5-point Likert-style response scale. The responses range from 1 = strongly disagree to 5 = strongly agree. This is a mixed-worded scale (positive and negative worded scale) and example items for each of these are, “You feel pressed for time” and “You have enough time for yourself”.
Autonomy. Job autonomy was measured using the Work Autonomy Scales developed by Breaugh (1985). This scale has been used in other more recent studies by Sadler-Smith, El-Kot and Leat (2003) who explored the validity of the scale
in Egypt. Another study that used this scale in a non-Western context was Dee, Henkin and Chen (2000), in which they examined faculty autonomy in Taiwan’s universities. This instrument was selected for this study because it measures method, scheduling, and criteria autonomy; which is suitable with the job nature of academics. Method autonomy refers to how someone does a job. For academics, it would involve the freedom to determine the course content. Schedule autonomy refers to the freedom of determining the timing of the classes. Criteria autonomy refers to the assessment of the work; in which teaching, research and other services are being judged. This scale was designed as nine statements, which the respondents rate on a five-point response format (1 = strongly disagree to 5 = strongly agree). This is a multi-dimensional measure of work autonomy and example items for each of the dimensions are: “I am allowed to decide how to go about getting my job done (the methods to use)”, “I have control over the scheduling of my work”, and “I am able to modify what my job objectives are (what I am supposed to accomplish)”.
Mediating Variable
Self-Leadership. Respondents’ level of self-leadership skills was measured using the Revised Self-Leadership Questionnaire (Houghton & Neck, 2002). The RSLQ consists of 35 items within the three self-leadership dimensions: behavior focused strategies, natural reward strategies, and constructive thought pattern strategies. However, in an email on 26th June 2008 J. Houghton suggested
that the items for punishment (or self-discipline); which are located in the sub-scales be removed. This is because self-punishment is a negative process and therefore it does not fit with the positive strategies of the theory of self-leadership. Therefore, there were 31 items that were used to measure self-leadership. Each item is scored on a Likert-type scale from 1 to 5, unchanged from the original instrument. The respondents read each item and responded to what degree the statement describes them. The responses range from 1 = not at all accurate to 5 = completely accurate.
Dependent Variable
6
six items scale was measured on a Likert-type scale from 1 to 5 and covered both positively and negatively worded statements. Example items for each of these are: “I would be very happy to spend the rest of my career with this organization” and “I do not feel a strong sense of ‘belonging’ to my organization”. The responses ranged from 1 = strongly disagree to 5 = strongly agree.
Stressful environment. This study used the 10-item version of Perceived Stress Scale (Cohen et al., 1983); which measures the degree of situations in individuals’ life that are perceived as stressful. This scale has been used in a non-Western context by Lau (2012) who investigated the relationship between health-related quality of life and perceived stress in Macao, China. There is an additional reference that has validated this scale which provided normative data for the perceived stress scale with 10 items from large 2006 and 2009 probability samples of the United States by Cohen and Janicki-Deverts (2012). A five-point Likert scale was used for all items ranging from “Never” to “Very often”. This is a mixed-worded scale and example items for each of these are: “Felt nervous and stressed” and “Felt that things were going your way”.
Analytical Strategy
Prior to testing the hypotheses, the factor structures of each scale was examined with AMOS 18 (IBM SPSS Amos, 2012). First, a confirmatory factor analysis was conducted to evaluate the psychometric properties of the constructs. The variables were estimated with one-factor congeneric models. For identification purposes, the variance of the latent variable was set to 1 and the fixed regression weight of the first factor loading was removed.
Second, a measurement model that consisted of seven factors was tested: the personality variables (conscientiousness and extraversion), the attitudinal variable (affective commitment), the moderator variables (job autonomy, time pressure and perceived stressful environment) and the dependent variable (self-leadership at Time 2). The goodness of fit of this overall measurement model was assessed. In addition, the convergent and divergent validity of the scales was examined with Average Variance Extracted statistics (AVE) (Fornell & Larcker, 1981).
Throughout both the measurement and structural model evaluation processes, the following goodness-of-fit indices with fit values deemed to be acceptable within the literature (Hu & Bentler, 1999): chi-square (χ²) value not significant at 0.05 level, comparative fit index (CFI) exceeding .95, and root mean square error of approximation (RMSEA) less than .08. In addition, AMOS reports
90% confidence intervals around the value and a further test for closeness of fit (PCLOSE).
To test the moderating hypotheses, double mean centering was conducted, thus placing the new mean at zero and the new standard deviation at one. In the past, estimating latent interactions in structural equation models has been analyzed using (single) mean-centering strategy (Marsh, Wen, & Hau, 2004). Estimating latent interaction effects using the single-mean-centering required a cumbersome estimation procedure involving 2-steps (Lin, Wen, Marsh, & Lin, 2010). A more recent technique (Lin et al., 2010) designed to address this issue instead uses a double-mean-centering strategy for estimating latent interactions in structural equation models. This strategy facilitates the model specification and eliminates the need to compute a mean structure and the complicated 2-stage estimation procedure. Therefore, this technique was utilized to estimate latent interaction effects.
Confirmatory Factor Analysis (CFA)
To begin, confirmatory factor analyses (CFA) were used to assess the measurement properties at both Time one and Time two. Before testing the full model, a series of one-factor congeneric models for each variable in the model were tested and evaluated separately before being tested in combination with other variables. The reason for this was that the validity of the measurement model needed to be tested first before making any attempt to evaluate the structural model (Byrne, 2010). According to Anderson and Gerbing (1988), the measurement model should be evaluated before testing the structural model to minimize incorrect interpretations of the findings. Throughout each step of the testing, changes were made to the model when the fit to the data was unsatisfactory; while making sure that the changes still conformed to the relevant theories.
Second order factor models were also estimated for the work autonomy scale (Breaugh, 1985) and for self-leadership; the items were parceled according to their theoretical subscale (i.e., behavioral focused, constructive thought, and natural rewards) (Landis, Beal, & Tesluk, 2000). During the initial model generating stage, regression weights and goodness-of-fit statistics were inspected. Indicators that had low factor loadings (below 0.50) and/or items with highly correlated error variances were removed (Blunch, 2008; Hair, Black, Babin, Anderson, & Tatham, 2010). The number of items for each construct was reduced until an acceptable goodness of fit to the data was reached.
7
model well, χ² (35) = 163.13, p = .000; CFI = .668, RMSEA = .117 (.099, .135) PCLOSE = .000. Items C4, C8, C12, C14 and C16 had small coefficients (Table 5.3), perhaps indicating incompatibility in the context of the Malaysian culture. For example, item C14, “I like order”, might act as a double meaning (ordering people around); which reflects a negative connotation in a Malaysian work culture. In addition, item C16, “I shirk my duties”, might be a problem of linguistic incompetence (Johnson, 2005) because English is a second language. Therefore, these items may not be as clear to the respondents because they might be interpreted differently in Malaysian culture. They were therefore deleted and after removing the items that have small coefficients (below .50), the data fits the model well, χ² (5) = .808, p = .977; CFI = 1.000, RMSEA = .000. The same procedure has been followed for all of the other variables in the model.
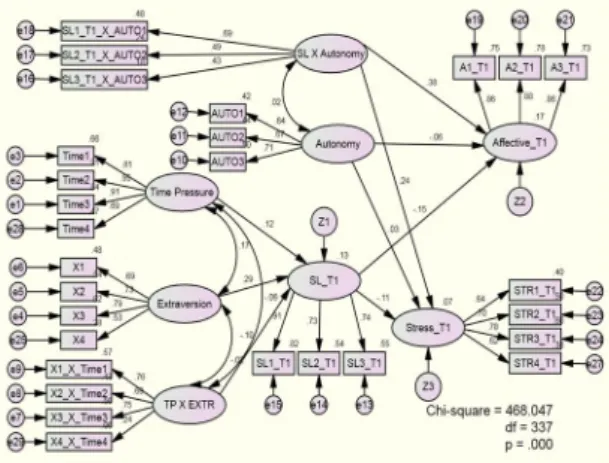
Figure 5: Mediation and Moderation Model First, the author tested autonomy at the second half of the mediation and switch time pressure over to the first half of the mediation. Similar with the previous models, the interaction effect was significant only at the second half of the mediation; and only for Model 1 at Time 1. Model 1 at T1; the fit of this model was adequate, χ² (337) = 468.05, p = .000, CFI .917, RMSEA = .051 (.040, .062); PCLOSE = .408. Time Pressure to SL (β = .12, ns); TP X Extraversion to SL (β = –.10, ns); Extraversion to SL (β = .29, p < .01); SL to Stress (β = –.11, ns); SL X Autonomy to Affective (β = .38, p < .01); Autonomy to Affective (β = – .06, ns); SL to Affective Commitment (β = – .15, ns); Autonomy to Stress (β = .03, ns); SL X Autonomy to Stress (β = .24, ns).
Model 2 at T1 antecedents & SL with T2 outcomes; the fit of this model was adequate, χ² (337) = 445.73, p = .000, CFI .933, RMSEA = .047 (.034, .058); PCLOSE = .664. TP to SL (β = .13, ns); TP X Extraversion to SL (β = –.10, ns); Extraversion to SL (β = .30, p < .01); SL to Stress (β = – .06, ns); SL X Autonomy to Affective (β =
.13, ns); Autonomy to Affective Commitment (β = –.09, ns); SL to Affective (β = – .14, ns); Autonomy to Stress (β = .09, ns); SL X Autonomy to Stress (β = .09, ns).
Model 3 at time one antecedents with time two SL & Outcomes; the fit of this model was adequate, χ² (338) = 459.73, p = .000, CFI = .925, RMSEA = .049 (.037, .061); PCLOSE = .520. Time Pressure to SL (β = .02, ns); TP X Extraversion to SL (β = – .03, ns); Extraversion to SL (β = .28, p = < .01); SL to Stress (β = –.04, ns); SL X Autonomy to Affective (β = .07, ns); Autonomy to Affective (β = –.08, ns); SL to Affective (β = – .11, ns); Autonomy to Stress (β = .09, ns); SL X Autonomy to Stress (β = – .04, ns).
Figure 6: Moderated Mediation Model
Then, the author tested both moderators at the second half of the mediation. Both moderators were significant for Affective Commitment but not for Stress; however, they were only significant for Model 1 at Time 1. The fit of the model was adequate; χ² (311) = 426.57, p = .000, CFI = .926, RMSEA = .050 (.038, .062); PCLOSE = .500. Extraversion to SL (β = .32, p < .01); Time Pressure to Affective Commitment (β = .31, p < .000); SL X TP to Affective (β = .25, p < .01); Self-Leadership to Affective Commitment (β = – .21, p < .05); SL X Autonomy to Affective (β = .25, p < .05); Autonomy to Affective (β = – .03, ns); Autonomy to Stress (β = .06, ns); SL X Autonomy to Stress (β = .13, ns); SL to Stress (β = – .18, ns); SL X TP to Stress (β = .05, ns); Time Pressure to Perceived Stress (β = .33, p < .000).
8
to Stress (β = .12, ns); SL X Autonomy to Stress (β = .03, ns); SL to Stress (β = – .14, ns); SL X TP to Stress (β = .15, ns); Time Pressure to Stress (β = .39, p < .000).
Model 3 at T1 antecedents with T2 Self-Leadership & outcomes; the fit of the model was adequate, χ² (313) = 460.21, p = .000, CFI = .910, RMSEA = .057 (.045, .067); PCLOSE = .164. Extraversion to SL (β= .28, p < .01); TP to Affective (β = .11, ns); SL X TP to Affective (β = – .07, ns); Self-Leadership to Affective Commitment (β = – .12, ns); SL X Autonomy to Affective (β = .10, ns); Autonomy to Affective (β = – .07, ns); Autonomy to Stress (β = .11, ns); SL X Autonomy to Stress (β = – .03, ns); SL to Stress (β = – .07, ns); SL X TP to Stress (β = – .00, ns); TP to Stress (β = .35, p < .000). Based from the 2 sets of results, the moderators were significant at Time 1 only (cross-sectional).
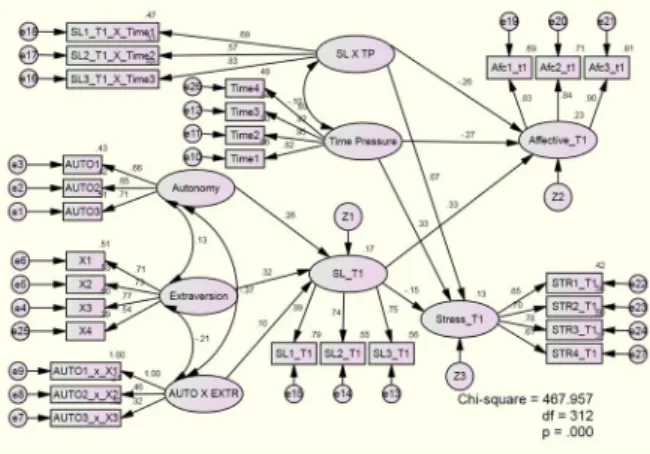
Figure 7: Moderation and mediation model
This is the model with the randomly parcelled items of affective; CFI = .903, RMSEA = .058. Autonomy to SL (β = .26, p < .05); AUTO x EXTR (β = .10, ns); Extraversion to SL (β = .32, p < .01); SL to Stress (β = – .16, ns); SL x Time Pressure to Affective Commitment (β = – .26, p < .01); Time Pressure to Affective Commitment (β = – .27, p < .01); SL to AC (β = .33, p < .000); Time Pressure to Perceived Stress (β = .33, p < .000); and SL x TP to Stress (β = .07, ns).
The other model with only negatively worded items of affective commitment did not fit the data well, χ² (312) = 481.56, p = .000; CFI = .897, RMSEA = .061. Autonomy to SL (β = .26, p < .05); Autonomy x Extraversion to SL (β = .10, ns); Extraversion to SL (β = .31, p < .01); SL to Perceived Stress (β = – .15, ns); SL x TP to AC (β = .31 p <.01); Time Pressure to Affective (β = .32, p < .000); SL to AC (β = – .19, p < .05); Time Pressure to Stress (β = .33, p < .000); SL x TP to Stress (β = .08, ns).
The previous model with all positively worded items of affective commitment did not fit the data well; χ² (312) = 464.41, p = .000; CFI = .896,
RMSEA = .058. Autonomy to SL (β = .27, p < .05); Auto x Extraversion to SL (β = .10, ns); Extraversion to SL (β = .32, p < .01); SL to Stress (β = – .15, ns); SL x TP to AC (β = – .16, ns); Time Pressure to AC(β = –.15, ns); SL to AC (β = .41, p < .000); Time Pressure to Stress (β = .32, p < .01); SL x TP to Stress (β = .05, ns).
These figures are confusing as the author got totally different results with positively worded items only compared to negatively worded items and combination of both. Based from the literature about East Asians being different from the Westerns, Wong and colleagues (2003) suggested that the differences between the way East Asians and Americans respond to mixed-worded scales may be due to substantive differences in the religious belief systems underlying eastern versus western cultures (pg. 87). Therefore, some psychometricians (Schriesheim & Eisenbach, 1995) suggested that researchers should include items that are all in the same direction (Iwata, Saito, & Roberts, 1994). In addition, Iwata and associates (1994) found that responses to positive items were mostly inconsistent with those of negative items and they suggested that this response style might apply to other Asian groups as well (pg. 283). They also stated that this kind of problem cannot be solved by translation, but by including the items that are all in the same direction to reduce such discrepancies (Iwata, Roberts, & Kawakami, 1995; Iwata et al., 1994).
Conclusion
Mediation is seen as causal; therefore, the Independent Variable (IV) must precede the Mediating Variable (MV) and the MV must precede the DV (Cole & Maxwell, 2003). One of the best ways to increase internal validity of mediational analysis is by the design of the study (MacKinnon et al., 2007; Maxwell et al., 2011). Therefore, it is suggested for future researchers who want to design a mediational analysis, use longitudinal design; meaning the timing of measurement. First, obtain the values of all the variables; including prior values of MV (mediator) and DV. Then, get another set of values of MV and DV. By measuring MV after IV and DV after MV, we would know that MV does not cause IV and DV does not cause IV or MV. Finally, by obtaining prior measures of MV and DV and control for them, we can reduce the effects of CMV (common method variance) and perhaps eliminate the effects of omitted variables.
9
elaborate models of a mediated moderation and moderated mediation. In addition, the author explained when moderation is mediated and when mediation is moderated by giving examples of a research. In conclusion, mediation and moderation models are ideal for investigating the question of what process and under what condition the variable achieve its effects.
References
Aiken, L. S., & West, S. G. (1991). Multiple regression: Testin and interpreting interactions. Multiple regression: Testing and interpreting interactions.
Ajzen, I. (1991). The theory of planned behavior. Organizational Behavior and Human Decision
Processes, 50(2), 179–211.
http://doi.org/10.1016/0749-5978(91)90020-T Anderson, J. C., & Gerbing, D. (1988). Structural modeling in practice: A review and recommended two-steps approach. Psychological Bulletin, 103, 411–423.
Baron, R. M., & Kenny, D. A. (1986). The moderator-mediator variable distinction in social psychological research: conceptual, strategic, and statistical consideratios. Journal of Personality and Social Psychology, 51(6), 1173–82. Retrieved from http://www.ncbi.nlm.nih.gov/pubmed/3806354 Blunch, N. J. (2008). Introduction to structural equation modelling using SPSS and AMOS. Introduction to structural equation modelling using
SPSS and AMOS. Retrieved from
https://ezproxy.chadronstatelibrary.com/login?url= http://search.ebscohost.com/login.aspx?direct=true &db=psyh&AN=2008-05818-000&site=eds-live Breaugh, J. A. (1985). The measurement of work autonomy. Human Relations, 38, 551–570.
Byrne, B. M. (2010). Structural Equation Modeling with AMOS. Structural Equation Modeling (Vol. 22). http://doi.org/10.4324/9781410600219
Chang, S.-J., van Witteloostuijn, A., & Eden, L. (2010). From the Editors: Common method variance in international business research. Journal of International Business Studies, 41(2), 178–184. http://doi.org/10.1057/jibs.2009.88
Cohen, S., & Janicki-Deverts, D. (2012). Who’s stressed? Distributions of psychological stress in the United State in Probability Samples from 1983, 2006, and 2009. Journal of Applied Social
Psychology, 42(6), 1320–1334.
http://doi.org/10.1111/j.1559-1816.2012.00900.x Cohen, S., Kamarck, T., Mermelstein, R., Sheldon, C., Kamarck, T., & Mermelstein, R. (1983). A Global Measure of Perceived Stress, 24(4), 385–
396. Retrieved from
http://www.jstor.org/stable/2136404
Cole, D. a, & Maxwell, S. E. (2003). Testing mediational models with longitudinal data: questions and tips in the use of structural equation modeling. Journal of Abnormal Psychology, 112(4), 558–577. http://doi.org/10.1037/0021-843X.112.4.558
Dee, J. R., Henkin, A. B., & Chen, J. H.-H. (2000). Faculty autonomy: Perspectives from Taiwan. Higher Education, 40, 203–216.
Dillman, D. A. (2007). Mail and Internet surveys: The tailored design method (2nd ). New York: Wiley.
Edwards, J. R., & Lambert, L. S. (2007). Methods for integrating moderation and mediation: a general analytical framework using moderated path analysis. Psychological Methods, 12(1), 1–22. http://doi.org/10.1037/1082-989X.12.1.1
Fairchild, A. J., & MacKinnon, D. P. (2009). A General Model for Testing Mediation and Moderation Effects. Prevention Science, 10(2), 87– 99. http://doi.org/10.1007/s11121-008-0109-6 Fornell, C., & Larcker, D. F. (1981). Evaluating Structural Equation Models with Unobservable Variables and Measurement Error. Journal of Marketing Research (JMR). Feb1981, 18(1), 39–
50. 12p. 1 Diagram.
http://doi.org/10.2307/3151312 Gaskin, J. (2012). Interaction.
Goldberg, L. R., Johnson, J. A., Eber, H. W., Hogan, R., Ashton, M. C., Cloninger, C. R., & Gough, H. G. (2006). The international personality item pool and the future of public-domain personality measures. Journal of Research in Personality, 40(1), 84–96. Retrieved from http://www.sciencedirect.com/science/article/B6W
M0-4HDG96N-1/1/867f5db56ba5d1b07abddad383698658
Hair, J. F., Black, W. C., Babin, B. J., Anderson, R. E., & Tatham, R. L. (2010). Multivariate Data Analysis. Prentice Hall.
Houghton, J. D., & Neck, C. P. (2002). The revised self-leadership questionnaire. Journal of Managerial Psychology, 17(8), 672. http://doi.org/10.1108/02683940210450484 Hu, L., & Bentler, P. M. (1999). Cutoff criteria for fit indexes in covariance structure analysis: Conventional criteria versus new alternatives. Structural Equation Modeling: A Multidisciplinary
Journal, 6(1), 1–55.
10
Software Business Analytics, YTD03114-U, 1–8.Iwata, N., Roberts, C. R., & Kawakami, N. (1995). Japan-U.S. comparison of responses to depression scale items among adult workers. Psychiatry
Research, 58(3), 237–245.
http://doi.org/http://dx.doi.org/10.1016/0165-1781(95)02734-E
Iwata, N., Saito, K., & Roberts, R. E. (1994). Responses to a self-administered depression scale among younger adolescents in Japan. Psychiatry
Research, 53(3), 275–287.
http://doi.org/10.1016/0165-1781(94)90055-8 Johnson, J. a. (2005). Ascertaining the validity of individual protocols from Web-based personality inventories. Journal of Research in Personality,
39(1 SPEC. ISS.), 103–129.
http://doi.org/10.1016/j.jrp.2004.09.009
Landis, R. S., Beal, D. J., & Tesluk, P. E. (2000). A Comparison of Approaches to Forming Composite Measures in Structural Equation Models. Organizational Research Methods, 3(2), 186–207. http://doi.org/10.1177/109442810032003
Lau, Y. (2012). Traditional Chinese Pregnancy Restrictions, Health-Related Quality of Life and Perceived Stress among Pregnant Women in Macao, China. Asian Nursing Research, 6(1), 27– 34. http://doi.org/10.1016/j.anr.2012.02.005 Lin, G.-C., Wen, Z., Marsh, H., & Lin, H.-S. (2010). Structural Equation Models of Latent Interactions: Clarification of Orthogonalizing and Double-Mean-Centering Strategies. Structural Equation Modeling: A Multidisciplinary Journal,
17(3), 374–391.
http://doi.org/10.1080/10705511.2010.488999 MacKinnon, D. P., Fairchild, A. J., & Fritz, M. S. (2007). Mediation analysis. Annual Review of
Psychology, 58, 593–614.
http://doi.org/10.1146/annurev.psych.58.110405.08 5542
MacKinnon, D. P., Lockwood, C. M., Hoffman, J. M., West, S. G., & Sheets, V. (2002). A comparison of methods to test mediation and other intervening variable effects. Psychological
Methods, 7(1), 83–104.
http://doi.org/10.1037/1082-989X.7.1.83
Marsh, H. W., Wen, Z., & Hau, K.-T. (2004). Structural equation models of latent interactions: evaluation of alternative estimation strategies and indicator construction. Psychological Methods, 9(3), 275–300. http://doi.org/10.1037/1082-989X.9.3.275
Mathieu, J. E., & Taylor, S. R. (2006). Clarifying conditions and decision points for mediational type inferences in Organizational Behavior. Journal of
Organizational Behavior, 27(8), 1031–1056. http://doi.org/10.1002/job.406
Maxwell, S. E., Cole, D. A., & Mitchell, M. A. (2011). Bias in cross-sectional analyses of longitudinal mediation: Partial and Complete Mediation Under an Autoregressive Model. Multivariate Behavioral Research, 46(5), 816–841. http://doi.org/10.1080/00273171.2011.606716 Meyer, J. P., Allen, N. J., & Smith, C. A. (1993). Commitment to Organizations and Occupations: Extension and Test of a Three-Component Conceptualization. Journal of Applied Psychology,
78(4), 538–551. Retrieved from
http://www.sciencedirect.com/science/article/B6W
Y3-46T4DH3-2H/2/e115df538b68c85576c4b76d9a022fa3 Morgan-Lopez, A. a, & MacKinnon, D. P. (2006). Demonstration and evaluation of a method for assessing mediated moderation. Behavior Research
Methods, 38(1), 77–87.
http://doi.org/10.3758/BF03192752
Muller, D., Judd, C. M., & Yzerbyt, V. Y. (2005). When moderation is mediated and mediation is moderated. Journal of Personality and Social
Psychology, 89(6), 852–863.
http://doi.org/10.1037/0022-3514.89.6.852
Newman, a., & Sheikh, a. Z. (2012). Organizational commitment in Chinese small- and medium-sized enterprises: the role of extrinsic, intrinsic and social rewards. The International Journal of Human Resource Management, 23(2), 349–367.
http://doi.org/10.1080/09585192.2011.561229 Nulty, D. D. (2008). The adequacy of response rates to online and paper surveys: what can be done?, 33(3), 301–314. Retrieved from http://www.informaworld.com/10.1080/026029307 01293231
Roxburgh, S. (2004). There just aren’t enough hours in the day: The mental health consequences of time pressure, 45(June), 115–131.
Sadler-Smith, E., El-Kot, G., & Leat, M. (2003). Differentiating work autonomy facets in a non-Western context. Journal of Organizational Behavior, 24(October 2002), 709–731. http://doi.org/10.1002/job.200
Schriesheim, C. A., & Eisenbach, R. J. (1995). An Exploratory and Confirmatory Factor-Analytic Investigation of Item Wording Effects on the Obtained Factor Structures of Survey Questionnaire Measures. Journal of Management,
21(6), 1177–1193.
11
experimental and nonexperimental studies: new procedures and recommendations. Psychological Methods, 7(4), 422. http://doi.org/10.1037//1082-989x.7.4.422
Wasti, S. A. (2002). Affective and continuance commitment to the organization: Test of an integrated model in the Turkish context. International Journal of Intercultural Relations,
26(5), 525–550. http://doi.org/10.1016/S0147-1767(02)00032-9
Wong, N., Rindfleisch, A., & Burroughs, J. E. (2003). Do Reverse Worded Items Confound Measures in Cross Cultural Consumer Research? The Case of the Material Values Scale. Journal of
Consumer Research, 30(1), 72–91.