Journal of Applied Food Technology
H o m e p a g e : h t t p s : / / e j o u r n a l 2 . u n d i p . a c . i d / i n d e x . p h p / j a f t
The Effect of Different Type Drying Methods on Chemical Characteristics
and Microbiology of Goat Milk Powder Kefir
Nurwantoro, Siti Susanti, Heni Rizqiati*
Food Technology Department, Faculty of Animal and Agricultural Sciences, Diponegoro University, Indonesia
*Corresponding author ([email protected])
Abstract Received: 10 December 2019 Article information:
Accepted: 28 May 2020 Available online: 01 June 2020
Keywords: kefir powder drying goat milk
© 2020 Indonesian Food Technologists All rights reserved
This is an open access article under the CC BY-NC-ND license
doi:10.17728/jaft.6699
The research aims to test and compare the chemical characteristics and total Lactic Acid Bacteria or LAB of goat milk powder kefir that was produced from cabinet drying, freeze drying and spray drying. Kefir was made from goat milk since it was found as a good digestibility, no β-lactoglobulin, and high protein. Data analysis was performed with the test analysis of variance with a significance level of 5% followed by Duncan testing if significant result was detected. Analysis of total acid was conducted using titration. Analysis of proteins was conducted using Kjeldahl method. Water content analysis was performed using oven and ash content was analyzed using furnace. Analysis of fat content was conducted using Soxhlet method. Analysis of total LAB and total yeast were done using Total Plate Count (TPC). As results, drying method significantly affected (p<0.05) water content, ash content, and total LAB but there was no significant effect (p<0.05) on the total acid, protein content, fat content, and total yeast. As conclusion, the best treatment of drying method in making goat milk kefir powder was spray drying.
Introduction
Kefir is one of the fermented products, made of several raw ingredients such as cow milk, goat milk, buffalo milk, seeds and fruits, added with kefir grains as a starter which there are LAB and yeast that are bound in the matrix polysaccharides (O’Brien et al., 2016). Kefir is also known as a probiotic drink, in general, kefir is made by pasteurizing milk and then inoculated with kefir grains (seeds of kefir) which contain a collection of LAB (Lactobacilli, Lactococci, Lactobacillus kefir,
Lactobacillus parakefir, Lactobacillus kefiranofirgum,
Lactobacillus bacteria and Lactobacillus kefiranofacien).
Kefir gives health benefits because it acts as inhibitor for the bacteria growth, may causes digestive system disease, in addition, it is able to reduce blood cholesterol levels and increase High Density Lipoprotein (HDL) (Ostadrahimi et al., 2015) .
Goat milk has several differences compared to cow milk, the one that make it difference is in fat and protein content. Goat milk has a better digestibility when compared to cow milk due to small fat granules with size less than 1.5 µm and it consists of short and medium
chain fatty acids (Schettino et al., 2017). Goat milk contains fatty acids which are classified as volatile fatty acids. The total content of volatile fatty acids in goat milk is higher than in cow milk, buffalo milk and horse milk (Erkaya and Sengul, 2011).
Three types of drying methods were used in this study: freeze drying, spray drying, and cabinet drying. Freeze drying is one of the drying methods which has advantage in maintaining drying product quality (Emami
et al., 2018) besides minimize humidity, no changes in
aroma, color and other organoleptic elements, inhibit microbial activity, and prevent chemical reactions which can damage the nutritional content of food (Bourdoux et al., 2016). Spray drying converts liquid products into dry powder products using spray system with hot media resulting in evaporation and turning into powder. Spray drying are fast drying cycles, short product retention and the final result is ready to be packaged when the drying process is finished (Wan and Yang, 2016).
et al., 2017). The advantage of using cabinet drying is relatively cheap in operating cost (Huddar and Kamoji, 2018). The use of optimum drying should consider the kefir quality such as total acid, protein content, water content, ash content, fat content, total LAB, and total yeast and since less study was found in kefir with variation in dryer, therefore this study was aimed at determining the effect of different drying methods on total acid, protein content, water content, ash content, fat content, total LAB, and total yeast on goat milk kefir powder.
Materials and Methods
This study was conducted in March-November 2019 at the Laboratory of Food Chemistry and Nutrition and the Laboratory of Food Engineering and Post-Harvest, Faculty of Animal Husbandry and Agriculture, Diponegoro University, Semarang.
As much as 21 liters of fresh goat milk and 1 kg kefir grain were purchased at Omah Kefir Ungaran, 0.1 N NaOH solution, H2SO4, selenium, NaOH, phenolphthalein, MRSA media, PDA (Potato Dextrose Agar), MRMB, physiological NaCl, ether, aquadest, and aluminum foil. Cabinet dryers (NCD-5, Dongguan Naser Machinery CO., LTD., China), freeze dryers (2018.11.16, ShunDi food., Ltd, Shanghai, China), and spray dryers (OLT-SD8000B, Ollital Technology, Fujian, China), kjeldahl flask, destruction equipment, distillation apparatus, soxhlet tool, furnace, autoclave (Hirayama, Japan), and incubator (Memmert, Germany).
Kefir Manufacture
Previous method (Ot’es and Cagindi, 2003) was used to produce kefir with several modifications. Fresh goat milk was pasteurized at 70° C for 15 seconds and allowed to stand until 27°C, then inoculated with a 5% kefir grains starter. Stirring was then applied until well mixed prior to incubation at room temperature (±27°C) for 24 hours. The kefir was then filtered to separate the kefir grains from the kefir and then proceed with the drying step.
Drying Process
Freeze drying method referred to the method of Zhao and Zhang (2005) with modification. Spray drying process was carried out in a 0.06 mbar T vacuum freeze dryer T ice condenser, frozen in -45°C for 36 hours with temperature inlet was set in 120oC (Aponte et al., 2016). Drying treatment by the cabinet drying method refers to the Pratama et al. (2017) with modification by kefir was poured on a baking sheet and put in a cabinet drying at a temperature of 50°C for 24 hours. Then the dried kefir was milled using miller machine (Beater bar-FCT-Z300, Maksindo, Indonesia) for 45 seconds up to 1 minute until the kefir powder was produced.
Total Titratable Acid Analysis
The total titratable acid analysis was carried out using a method that refers to Campbell-Platt (2009) using the titration method which is expressed as a percentage of lactic acid. Goat milk kefir powder samples were prepared and it was rehydrated until 10 ml was
obtained and taken into an erlenmeyer, then added with 2-3 drops of phenolphtalein then titrated using 0.1 N NaOH. Titration was stopped until it constantly obtained pink color. Total acid was determined by calculating the molar mass of the acid in the solution as the sum of mass of all atoms in the molecule. Multiply the volume of the standard solution of NaOH by its concentration to determine the number of moles of the titrant was used for the titration. Number of moles is volume (in L) x applied concentration (mol/L).
Total Protein Content Analysis
Total protein content analysis was measured by the Kjeldal method (Sudarmadji et al., 1997). A sample of 0.5 gram was put into a kjeldal flask then it was added with 10 ml of concentrated H2SO4 and 0.5 gram selenium then it was destructed until the color turned into clear green then followed by distillation. The distillation results were then titrated using 0.1 N HCl until the color changes into purple and determined the blank form. Protein levels was calculated using the formula as described in Chang and Zhang (2017).
Water Content Analysis
Water content was measured by the drying-oven method (AOAC, 2005). As much as 2 grams of kefir powder samples were prepared and put into a porcelain cup, which had measured its empty weight with an analytical balance then each sample and cup were put into the oven and dried at 105° C for 4 hours. After it reached 4 hours drying oven, the sample was removed from the oven, next it was put in a desiccator for 15 minutes and weighed with an analytical balance. The water content was determined by calculating the weight subtraction between the samples before and after drying, and then was divided by the sample’s weight, and finally multiplying it with 100%.
Total Ash Content Analysis
Total ash content analysis refers to Sudarmadji et al. (1997). The empty porcelain cup was weighed first, then the kefir powder was weighed as much as 2 g. The kefir was dried with a furnace at 500-600° C for 3 to 5 hours. Next, the furnace was turned off and awaited until reached the lower temperature and weighed the final result with analytical balance. Determination of ash content was carried out by the final weight be diminished with the porcelain weight, and then it was divided by the sample’s weight, and finally multiplying it with 100%.
Total Fat Content Analysis
Total LAB Analysis
LAB analysis used TPC method with MRSA media (Yunivia et al., 2019). Kefir powder sample was weighed as much as 1 gram and then dissolved in 10 ml of distilled water. Next, 1 ml of sample was put into a test tube containing 9 ml of physiological NaCl 0.85% as a dilution of 101. Dilution was then carried out to 104. At the last 3 dilution, carried out a search in which 1 ml of sample was put into a petri dish and added with 15 ml of sterile MRSA medium and mixed well. After solidifying, the plates were incubated at 37°C for 24 hours.
Total Yeast Analysis
Total yeast testing referred to Yunivia et al. (2019) using TPC method. The kefir powder sample was weighed as much as 1 g and dissolved in 10 ml of distilled water. As much as 1 ml of sample was put into a test tube containing 9 ml of physiological NaCl 0.85% as a dilution of 10-1. The dilution was carried out up to 10-4 and carried out the duplication of the last 3 dilutions. After that, the PDA media were added with a temperature of 50°C and mixed well then incubated at 37°C for 48 hours.
Data Analysis
The data obtained were processed using the SPSS application for Windows 22.0 with a significance level of 5%. The results of total acid, water content, ash content, fat content, total LAB, and total yeast were analyzed by analysis of variance and if there was a significant effect, then continued with Duncan test.
Results and Discussion
Total Titratable Acid
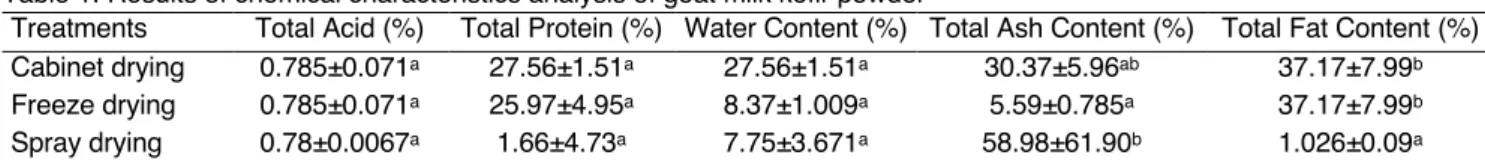
Based on Table 1, it can be seen that the differences in the drying method did not show any significant effect (p<0.05) on the total acid of goat milk kefir powder. The average total acid score on cabinet drying treatment was 0.785%, on freeze drying treatment was 0.785% and on spray drying treatment was 0.78%. Based on Table 1, it was found that the average total acid in each drying treatment had a bit range from 0.78% to 0.785%. This is in accordance with the standards set by Codex (2003) which states that the total standard of lactic acid kefir milk is at least 0.6%. This shows that the total acid obtained in goat milk kefir powder with the different drying method has reached the set standard for total kefir acid. The total lactic acid in goat milk kefir powder was produced from the fermentation process by lactic acid bacteria and yeast, in the fermentation process there was lactose degradation into single sugars, named glucose and galactose which became lactic acid. This is consistent with the opinion of Nursiwi et al. (2015) which stated that the levels of lactic acid in goat milk kefir powder depended on the amount
of lactose and the amount of kefir grain, and the length of fermentation process.
Total Protein Content
Based on Table 1, it can be seen that differences in the type of drying method had no significant effect (p> 0.05) on the total protein content of goat milk kefir powder. The average of total protein content in goat milk kefir powder produced was quite high. The higher of total microbes contained in goat milk kefir, the higher protein content in kefir due to the microbial constituent (Hanum 2016). The raw material influenced the total protein content of goat milk kefir (Haenlein, 2014). According to Adriani et al. (2014) goat milk protein was 4.57%. A research by Widiantara et al. (2018) stated that milk processing with high temperature and long time might caused denaturation of protein compounds and reduce their protein content.
Water Content
Based on Table 1, it is known that the drying method had a significant effect (p<0.05) on the moisture content of goat milk powder kefir. The average score of water content at cabinet drying treatment was 17.86%, freeze drying treatment was 8.37%, and spray drying treatment was 7.75%. This might influenced by the use of the temperature used when drying with an inlet temperature of 125°C in the spray drying causing decrease in water content highly, as stated by Quek et al. (2007) that the higher of drying temperature, the greater temperature difference between the heating media and the material, the faster heat transfer occurs so the more water would be evaporated resulting in the faster drying speed. Based on all applied methods, the water content produced was not in accordance with SNI 01-2970-2006 regarding the requirements for the quality of fatty milk powder that was equal to 5.00% due to originally protein content in goat milk which was less than 5%. It is known that during fermentation, protein in goat milk might stimulated the growth of starter by hydrolyzing into dissolved components generating the specific formation of textures. This is consistent with the opinion of Pereira et al. (2015), that the protein denaturation might appeared due to acid formation during fermentation.
Total Ash Content
Table 1 shows significant effect on the total ash content in goat milk kefir powder from all drying method has a. The results of the average levels of total ash content of goat milk kefir powder on this three drying methods did not meet the standards. Due to the absence of SNI for kefir, SNI 2981: 2009 on yogurt is stated that the maximum total ash content is 1.0%. Drying treatment
Table 1. Results of chemical characteristics analysis of goat milk kefir powder
Treatments Total Acid (%) Total Protein (%) Water Content (%) Total Ash Content (%) Total Fat Content (%) Cabinet drying 0.785±0.071a 27.56±1.51a 27.56±1.51a 30.37±5.96ab 37.17±7.99b
Freeze drying 0.785±0.071a 25.97±4.95a 8.37±1.009a 5.59±0.785a 37.17±7.99b
Spray drying 0.78±0.0067a 1.66±4.73a 7.75±3.671a 58.98±61.90b 1.026±0.09a
Notes : Data shown as mean value from 7 replications. The number followed by the same superscript shows no significant difference at the α
with the freeze drying method produces total ash content with the lowest mean value. This is consistent with the opinion of Riansyah et al. (2013) states that total ash content formed during the drying process will increase with increasing temperature and length of drying time. Drying with low temperatures will produce less ash content. According to Sundari et al. (2015), ash content in food shows the inorganic mineral content in it and ash content is influenced by the method of ashes and the raw materials thereof. The minerals contained in goat's milk are calcium, magnesium, and phosphorus.
Total Fat Content
Based on Table 1 shows that the drying method does not significantly affect the fat content in goat milk. The results of fat content in goat milk kefir powder did not meet the standards, because according to SNI 01-2970-2006 the fat content in milk powder is between 1.5 and 26%. Drying treatment using the cabinet drying method resulted high or exceeding standard fat content that might influenced by the drying temperature and length of drying time (Purbasari, 2019; Riansyah et al., 2013). Drying using the spray drying method resulted in low or below standard of fat content due to longer time was required to finalize the process that allowed lipase enzyme to break down the more fat resulting in the decrease in fat content (Bayu et al., 2017). Kefir fat content also depends on the total fat content of raw material (Utomo et al., 2017).
Total Lactic Acid Bacteria
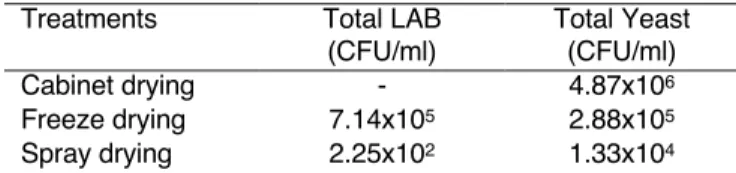
Table 2 shows significant effect (p<0.05) on the total LAB of goat milk powder kefir among drying methods but did not meet the requirements of SNI 2891-2009 (at least 107 CFU/ml). The lowest amount of bacteria was found in kefir powder by the method of drying cabinet drying. This is due to high drying temperatures as high as 50°C for 24 hours causing the decrease in the number of living lactic acid bacteria (Al-Baarri et al., 2016). The highest total LAB yield was found in kefir powder with the freeze drying method, which was 7.14 x 10⁵ CFU/ml because this method provided suitable condition for sensitive products and able to maintain the quality of the final product to be more durable, especially heat-sensitive products (Dewi, 2009).
Table 2. Results of microbiological analysis of goat milk kefir powder
Treatments Total LAB (CFU/ml)
Total Yeast (CFU/ml) Cabinet drying - 4.87x10⁶
Freeze drying 7.14x10⁵ 2.88x10⁵
Spray drying 2.25x10² 1.33x10⁴
Notes : Data shown as mean value from 7 replications. The number followed by the same superscript shows no significant difference at the
α level of 0.05
Total Yeast
Table 2 shows no significant effect of total yeast in goat milk powder kefir among drying methods. The highest total yield of yeast to the lowest was found in the cabinet drying, freeze drying and spray drying methods.
Yeast growth is influenced by several factors such as temperature, humidity, pH, oxygen, and the nature of the microbes themselves (Anggraini et al., 2017; Hardianto
et al., 2018). The total standard of yeast according to Codex (2011) is at least 104 CFU/ml representing all the average total yield of yeast has met the standard. According to Ningsih et al. (2018), yeast works by degrading various types of sugar, especially simple sugar as an energy source to produce alcohol and CO2 as the final product of its metabolism. This process occurs because of the enzymes produced by yeast that fermenting sugar into the simplest form such as glucose to produce ethanol and carbon dioxide (Hasanah et al.
2012).
Conclusion
The different type of drying method specifically affected the water content, total ash content, total LAB and yeast of goat milk powdered kefir. The best treatment of drying method was spray drying. This may reach maximum shelf life product.
References
Adriani., A. Latif., S. Fachri, I. Sulaksana. 2014. Increase production and quality of crossbreed goat milk in response to improved feed quality. Jurnal
Ilmu-Ilmu Peternakan 17(1):15-21.DOI:
10.22437/jiiip.v17i1.2087. (In Bahasa Indonesia). Aktaş, M., Khanlari, A., Aktekeli, B., Amini, A. 2017.
Analysis of a new drying chamber for heat pump mint leaves dryer. International Journal of Hydrogen Energy 42(28):18034-18044. DOI: 10.1016/j.ijhydene.2017.03.007.
Al-Baarri, A.N., Legowo, A.M., Pramono, Y.B., Siregar, R.F., Pangestu, R.F., Azhar, H.N., Sarya, R.H., Hapsari, M.C. 2016. Technique for Making Fruity Powder Yogurt. Indonesian Food Technologists Semarang. (In Bahasa Indonesia).
Anggraini, S.P.A., Yuniningsih, S., Sota, M.M. 2017. Effect of pH on the quality of ethanol products from molasses through the fermentation process. Jurnal Reka Buana 2(2):99-105. DOI: 10.33366/rekabuana.v2i2.725 (In Bahasa Indonesia).
AOAC. 2005. Official Methods of Analysis. Association of Official Analytical Chemists. Benjamin Franklin Station, Washington.
Aponte, M., Troianiello, G.D., Di Capua, M., Romano, R., Blaiotta, G. 2016. Impact of different spray-drying conditions on the viability of wine Saccharomyces cerevisiae strains. World Journal of Microbiology and Biotechnology 32(1):1-9. DOI:10.1007/ s11274-015-1956-5
Bayu, M.K., H. Rizqiati, Nurwantoro. 2017. Analysis of total dissolved solids, acidity, fat content, and level of viscosity in optima kefir with different fermentation times. Jurnal Teknologi Pangan 1(2): 33-38. (In Bahasa Indonesia).
Food Science and Food Safety 15(6):056-1066. DOI: 10.1111/1541-4337.12224
Chang. S.K.C., Zhang, Y. 2017. Protein Analysis. Food Analysis 315-331 DOI: 10.1007/978-3-319-45776-5_36
Campbell-Platt, G. 2009.Food Science and Technology. International Union of Food Science and Technology. A John Wiley & Sons, Ltd, New Jersey.
Codex Alimentarius. 2003. Codex Standard for Fermented Milks. CODEX STAN 243-2003. Codex Alimentarius. 2011. Milk and Milk Products (2nd
Edition). CODEX STAN 243-2003. FAO/WHO Standards, Roma.
Dewi, P. 2009. The survival of acetobacter xylinum cells in dry-freeze preservation using a carrier medium. Jurnal Biosaintifika 1(1):41-48. DOI: 10.15294/biosaintifika.v1i1.44.
Emami, F., Vatanara, A., Park, E.J., Na, D.H. 2018. Drying technologies for the stability and bioavailability of biopharmaceuticals. Journal Pharmaceutics. 18:1-22. DOI: 10.3390/ pharmaceutics10030131.
Erkaya, T., Sengul, M. 2011. Comparison of volatile compounds on yoghurts made from cows’, bufffaloes’, ewews’, and goats’ milks. International Journal of Dairy Technology 64(2):240-246 DOI:10.1111/j.1471-0307.2010.00655.x.
Haenlein, G.F.W. 2004. Goat milk in human nutrition. Journal of Small Ruminant Research 51(2):155-163. DOI:10.1016/j.smallrumres.2003.08.010. Hanum, G.R. 2016. Effect of incubation time and type of
inoculum on the quality of goat milk kefir. Stigma
Journal of Science 9(2):12-15. DOI:
10.36456/stigma.vol9.no2.a333.
Hardianto, A. Muhibuddin, Sektiono, A.W. 2018. Optimization of phosphate to increase population density growth and the ability of Saccharomyces
cerevisiae antagonists to Fusarium sp. Jurnal
Sains dan Teknologi 1(2):27-41. DOI: 10.32764/saintekbu.v10i2.206. (In Bahasa Indonesia).
Hasanah, H., Jannah, A., Fasya, A.G. 2012. Effect of fermentation time on cassava alcohol levels
(Manihot utilissima Pohl.). Jurnal Alchemy
2(1):68-79. DOI:10.18860/al.v0i0.2294.
Huddar, V.B., Kamoji, M.A. 2018. Experimental Investigations on electrical heat assisted drying of cashew kernels. IOP Conference Series : Material
Science and Engineering 376: 1-8.
DOI:10.1088/1757-899x/376/1/012093.
Ningsih, D.R., Bintoro, V.P., Nurwantoro. 2018. Analysis of total dissolved solids, alcohol content, pH value, and total acid in kefir optima with the addition of high fructose syrup (HFS). Jurnal Teknologi Pangan 2(2): 84-88. DOI:10.14710/jtp.2.2.84–89. (In Bahasa Indonesia).
Nursiwi, A., Utami, R., Andriani, M., and Sari, A. P. 2015. Fermented cheese waste whey for kefiran production by kefir grains. Jurnal Hasil Teknologi Pertanian 8(1):37-45. DOI: 10.20961/jthp. v0i0.12794. (In Bahasa Indonesia).
O’Brien, K.V., Aryana, K.J., Prinyawiwatkul, W., Ordonez, K.M.C., Boeneke, C.A. 2016. Short communication : The effects of frozen storage on the survival of probiotic microorganisms found in traditionally and commercially manufactured kefir. Journal Dairy Science 99: 7043-7048. DOI: 10.3168/jds.2015-10284.
Ostadrahimi, A., Taghizadeh, A., Mobasseri, M, Farrin, N, Payahoo, L., Gheshlaghi, Z.B., Vanedjabbari, M. 2015. Effect of probiotic fermented milk (kefir) on glycemic control and lipid profile in type 2 diabetic patients: A randomized double-blind placebo-controlles clinical trial. Iran Journal Public Health 44(2): 228-237. DOI: 10.21203/rs. 2.12262/v1.
Ot’es, S., Cagindi, O. 2003. Kefir: A probiotic dairy composition nutritional and therapeutic aspect. Pakistan Journal of Nutrition 2 (2): 54-59. DOI: 10.3923/pjn.2003.54.59.
Pereira, C., Henriques, M., Gomes, D., Gomez-Zavaglia, A., de Antoni, G. 2015. Novel functional whey-based drinks with great potential in the dairy industry. Journal Food Technology and
Biotechnology 53(3): 307-314. DOI:
10.17113/ftb.53.03.15.4043.
Pratama, Y., Abduh, S.B.M., Legowo, A.M., Pramono, Y.B., Al-Baarri, A.N. 2017. Optimum carrageenan concentration improved the physical properties of cabinet-dried yoghurt powder. IOP Conference Series: Earth and Environmental Science 102:1-7. DOI:10.1088/1755-1315/102/1/012023.
Purbasari, D. 2019. Foam-mat drying application on soy milk powder manufacture. Jurnal Agroteknologi 13(1): 52-61. DOI: 10.19184/j-agt.v13i01.9253. (In Bahasa Indonesia)
Quek, S.Y., Chok, N.K., Swedlund, P. 2007. The physicochemical properties of spray-dried watermelon powders. Chemical Engineering and Processing: Process Intensification 46(5): 386-392. DOI:10.1016/j.cep.2006.06.020.
Riansyah, A., Supriadi, A., Nopianti, R. 2013. Temperature and duration of drying on salted fish “sepat siam” (Trichogaster pectoralis) using oven. Journal Fishtech 2(1):53-68. DOI:10.36706/ fishtech.v2i1.1103. (In Bahasa Indonesia).
Schettino, B., Vega, S., Gutiérrez, R., Escobar, A., Romero, J., Domínguez, E., González-Ronquillo, M. 2017. Fatty acid profile of goat milk in diets supplemented with chia seed (Salvia hispanica L.). Journal of Dairy Science 100(8): 6256-6265. DOI:10.3168/jds.2017-12785.
SNI (Standar Nasional Indonesia) 01-2970. 2006. Milk Powder Standard. National Standard Agency, Jakarta
SNI (Standar Nasional Indonesia) 298. 2009 Yogurt. National Standard Agency. Jakarta.
Sudarmadji, S., Haryono, B., Suhardi. 1997. Analysis Procedures for Food and Agriculture Materials. Penerbit Liberty, Yogyakarta. (In Bahasa Indonesia)
from pagan protein sources. Media Litbangkes 25(4): 235-242. DOI: 10.22435/mpk.v25i4. 4590.235-242.
Utomo, B., Sugiartanti, D.D., Awaludin, A.N. 2017. Milk kefir information system for healing acne on the face. Jurnal Efektor 4(2):22-25. DOI:10.29407/ e.v4i2.966. (In Bahasa Indonesia)
Wan, F., Yang, M. 2016. Design of PLGA-based depot delivery systems for biopharmaceuticals prepared by spray drying. International Journal of Pharmaceutics 498:82-95. DOI:10.1016/j.ijpharm. 2015.12.025
Widiantara, T., Hervelly, Nur’afiah, D. 2018. Effect of comparison of brown sugar with sucrose and comparison of corn flour, sweet potato with green
beans on the characteristics of Jenang. Pasundan
Food Technology Journal 5(1):1-9.
DOI:10.23969/pftj.v5i1.803.
Yunivia, Y., Dwiloka, B., Rizqiati, H. 2019. Effect of addition of high fructose syrup (HFS) on changes in physicochemical and microbiological properties of green coconut water kefir. Jurnal Teknologi Pangan 3(1): 116-120. DOI: 10.14710/jtp.3.1.116– 120.