VOLUME 15 ISSUE 4 (2017), Page 1 - 12
ARE GREEN UNIVERSITIES PRODUCING GREENER FUTURE LEADERS?
Raihana Mohd Ghaus1, Rosta Harun2, Lim Kuang Hock3, & Zakiah Ponrahono4
1,3,4Faculty of Environmental Studies
UNIVERSITI PUTRA MALAYSIA
2Institute for Medical Research
NATIONAL INSTITUTE OF HEALTH MALAYSIA
Abstract
In recent years, studies on campus sustainability have been conducted to measure the impact that universities have on the environment and several mechanisms to measure and rank universities globally on how they perform in sustainability have been proposed. The UI Greenmetrics ranks universities based on sustainable performance ratings and focused more on the initiatives and opportunities provided to achieve sustainability but did not address the issue of environmental literacy among the university students. This study aims to understand how sustainable practices and policies adopted by Green Universities as well as demographic factors relate to the level of environmental attitude and responsible environmental behaviour of Malaysian student leaders. A census survey was carried out on student leaders of Malaysian public universities to assess their level of perception, attitude, personal responsible environmental behaviour (REB) and REB with regards to UI Greenmetrics Criteria. The Mann-Whitney U test conducted revealed that there was no significant difference in the level of the assessed components across all demographic factors between green and non-green universities. Spearman rank order correlation showed that there was a significant positive correlation between perception and personal REB (rs(322) = .385, p ≤ .05) as well student council REB (rs(322) = .542, p ≤ .05). Attitude was found to have a significant negative correlation with student council REB (rs(322) = -.114, p ≤ .05) while a high level of personal REB was significantly correlated with student council behaviour (rs(322) = .579, p ≤ .05).
Keyword: Green University; UI Greenmetrics; environmental attitude;
environmental behaviour; student leaders
Date Received: 11th May 2017
INTRODUCTION
UI Greenmetrics as a measure of campus sustainability
Universities in Malaysia have been working towards implementing Green Initiatives as outlined in the United Nations Environmental Programme (UNEP) Greening Universities Toolkit in 2013 to become sustainable Green Campuses. Universities are thought of as mini cities in the way they function and causes direct and indirect impact on the environment (Mat et al., 2011). In recent years, studies on campus sustainability have been conducted to measure the impact that universities have on the environment and several mechanisms to measure and rank universities globally on how they perform in sustainability have been proposed. In 2010, the University of Indonesia proposed for a global ranking list of universities’ sustainable performance ratings. The UI Greenmetrics is designed as a practical, entry-level tool for assessing campus sustainability efforts in both developed and developing countries and thought to be a simpler approach than other ranking systems such as GREENSHIP, STARS and the College Sustainability Report Card (Lauder et al., 2015). Results of the 2015 ranking saw 8 Malaysian tertiary institution listed as green campuses from a total of 407 universities that took part in the ranking worldwide. For Malaysia, Universiti Putra Malaysia came in first and ranked at number 17, followed by Universiti Utara Malaysia, 44, Universiti Malaya, 65, Universiti Tun Abdul Razak, 106, Universiti Kebangsaan Malaysia, 110, Universiti Teknologi Malaysia, 118, Universiti Malaysia Sabah, 173 and International Islamic University of Malaysia came in at number 361 (Universitas Indonesia, 2015).
Participation in the ranking by universities is voluntary and some universities may prefer to opt out of the ranking Universities that participate in the ranking may benefit by further fortifying their commitment to achieve campus sustainability while gaining a mark of assurance of their greenness through this recognition. Husin & Kunjuraman (2015) believe that campus sustainability has an important role to ensure the quality of educational services provided by local universities in order to compete with higher institutions abroad. A study conducted in Thailand comparing green and non-green universities in terms of perceived quality of life suggested that universities should adopt the criteria set in the UI Greenmetric World University Ranking to achieve better sustainability in their campuses and improve the quality of life of their stakeholders (Tiyarattanachai & Hollmann, 2015).
indicators (Universitas Indonesia, 2015). In the education category, indicators include the number of courses related to environment and sustainability offered as well as the availability of funds to carry out research. The study focused more on the initiatives and opportunities provided to achieve sustainability but did not address the issue of environmental literacy with components such as environmental attitude and activism among the university students. At status quo, the metrics still lacks the measure of environmental literacy in its indicators. Therefore, a comprehensive study on the level of environmental literacy should be conducted to determine whether the level of environmental attitude and responsible environmental behaviour (REB) among the students reflects the ranking of the green universities.
The importance of measuring environmental literacy
There is a need to assess the environmental literacy of the university students in order to predict the future of decision-making on issues concerning natural resource use and environment as environmental literacy holds enormous potential for radically changing the way environmental issues are conceived (Clair, 2003). The UI Greenmetrics does not take into account environmental literacy in its assessment. For environmental protection to take place, it is not sufficient to assume that providing avenue for discourse on environmental knowledge will automatically result in the university producing more green citizens. As observed by Burchett (2015), although today’s generation is more knowledgeable about environmental issues and sustainability, the knowledge is not translated into a deep concern for ecological issues or major alterations of human behaviour. Therefore, in addition to creating environmentally informed students, universities must also be able to instil the willingness to act for the environment for graduates to truly become green.
result from the assessment of their environmental attitude and behaviour will provide an insight on how responsive the student representatives are to address environmental issues on campus.
Measures of environmental literacy of student leaders between green and non-green universities
The research aims to understand how the sustainable practices and policies adopted by Green Universities relates to the level of environmental literacy of Malaysian student leaders. For the purpose of this study, the term “green university” refers to Malaysian public universities listed in the 2015 UI Greenmetrics ranking while “non-green university” are those that have not participated in the ranking. There are three specific objectives of the research. The first is to assess the environmental literacy of student leaders in Malaysian universities in relation to UI Greenmetric indicators. This will provide information on the level of environmental attitude and behaviour of student leaders with regards to the UI Greenmetrics indicator. Secondly, the study aims to compare and contrast between environmental literacy levels among student leaders of green and non-green universities. This will show if there is a significant difference between environmental attitude and behaviour of student leaders between green and non-green universities across demographic factors. The second objective will also indicate whether or not the perceived green initiatives in universities promote positive environmental attitude and behaviour in the student representatives. The third objective is to assess the level of participation and support of student leaders towards the implementation of sustainable practices in universities in line with the requirements of UI Greenmetrics. This will indicate the student leaders’ support in the implementation of the universities’ green initiatives with regards to the UI Greenmetrics through their personal and organizational environmental behaviour.
METHOD OF STUDY
Data collection and instrument
The instrument used in this study was a questionnaire adapted from the Environmental Attitude Inventory by Milfont and Duckitt (2010) and constructed in accordance with the UI Greenmetrics indicators. The draft questionnaire was vetted by the content expert to verify content validity. Pre-testing was carried out by distributing the questionnaire to 120 undergraduate students in Universiti Putra Malaysia. Exploratory factor analysis was conducted to establish construct validity for four components which were Perception (8 items), Attitude (9 items), Personal REB (6 items) and Student Council REB (7 items). The internal reliability of each component was Cronbach Alpha 0.57 (Perception), Cronbach Alpha 0.05 (Attitude), Cronbach Alpha 0.68 (Personal REB) and Cronbach Alpha 0.80 (Student Council REB). The tested questions were reviewed and eventually reduced to 27 questions after 3 questions were deleted from the attitude component to produce a higher measure of reliability. For each component, the items were assessed on a 5 point Likert-type (1= strongly disagree, 2= moderately disagree, 3=unsure, 4=moderately agree, 5=strongly agree) with responses for negative questions re-coded in order to enable calculation of average scores.
Statistical analysis
Data from each university were grouped into green and non-green universities based on respondent characteristics and explained using descriptive statistics. Non-parametric statistical tests were conducted to analyse the data. Mann-Whitney U test was carried out to test the mean scores of perspective, attitude, personal REB and student council REB between green and non-green universities based on field of study, student accommodation and gender. Correlation analysis using Spearman’s rho value was conducted to identify correlations between constructs based on the UI Greenmetrics criteria. Statistical tests were run at 95% confidence level.
FINDING AND DISCUSSION
Demographic characteristics of respondents
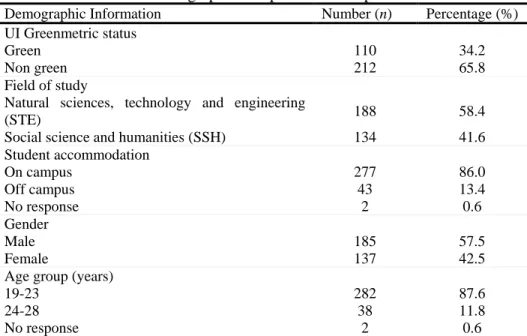
Table 1 Demographic composition of respondents
Demographic Information Number (n) Percentage (%) UI Greenmetric status
Green Non green
110 212
34.2 65.8 Field of study
Natural sciences, technology and engineering
(STE) 188 58.4
Social science and humanities (SSH) 134 41.6 Student accommodation
On campus 277 86.0
Off campus 43 13.4
No response 2 0.6
Gender
Male 185 57.5
Female 137 42.5
Age group (years)
19-23 282 87.6
24-28 38 11.8
No response 2 0.6
Descriptive statistics
The highest perceived green initiative recorded was for setting and infrastructure for both green universities (M=4.02, SD=1.09), and non-green universities (M=3.85, SD=0.98). The lowest recorded was for water in green universities (M=3.3, SD=1.04) and education in non-green universities (M=3.27, SD=1.45). For environmental attitude, both green and non-green universities scored the highest in waste (green: M=4.55, SD=0.76; non-green: M=4.53, SD=0.78) and the lowest was for transport (green: M=2.33, SD=1.27; non-green: M=2.63, SD=1.33). In terms of personal REB, the highest score was observed for education in both university groups (green: M=3.90, SD=1.27; non-green: M=3.88, SD=1.33) while the lowest score was recorded for waste (green: M=2.33, SD=1.26; non-green: M=2.63, SD=1.28). The highest score for student council REB was observed in settings and infrastructure for both green and non-green universities (non-green: M=3.70, SD=1.16; non-non-green: M=3.87, SD=1.09) and the lowest was in water conservation (green: M=2.86, SD=1.13; non-green: M=3.13, SD=1.11).
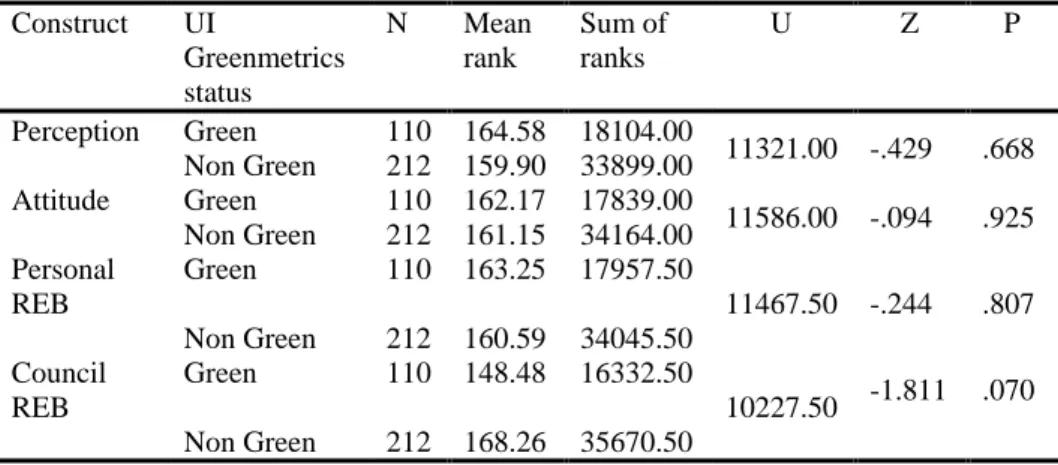
Non-parametric tests
Table 2 Results of the Mann Whitney U test to compare construct scores between Green and Non Green Universities
Construct UI
Greenmetrics status
N Mean rank
Sum of ranks
U Z P
Perception Green 110 164.58 18104.00
11321.00 -.429 .668 Non Green 212 159.90 33899.00
Attitude Green 110 162.17 17839.00
11586.00 -.094 .925 Non Green 212 161.15 34164.00
Personal REB
Green 110 163.25 17957.50
11467.50 -.244 .807 Non Green 212 160.59 34045.50
Council REB
Green 110 148.48 16332.50
10227.50 -1.811 .070 Non Green 212 168.26 35670.50
A series of Spearman rank-order correlation was run to determine the relationship between the four constructs in this study (Table 4).There was a strong, positive correlation between perception and personal REB, which was statistically significant (rs(322) = .385, p≤ .05). Perception was also found to be
significantly positively correlated with student council REB (rs(322) = .542, p≤
.05). The level of attitude was observed to be unrelated to perception (rs(322) =
-.057, p> .05) and personal REB (rs(322) = .003, p> .05). However, attitude
was found to have a significant negative correlation with student council REB (rs(322) = -.114, p≤ .05). A high level of personal REB was significantly
correlated with student council behaviour (rs(322) = .579, p≤ .05)
Table 4 Spearman’s correlations based on construct
1 2 3 4
1.Perception 1
2.Attitude -.057 1
3.Personal REB .385** .003 1
4.Council REB .542** -.114* .579** 1 **. Correlation is significant at the 0.01 level (2-tailed).
*. Correlation is significant at the 0.05 level (2-tailed).
A closer examination of Spearman rank-order correlation between constructs according to the categories in the UI Greenmetrics (Table 5) gives a better picture on how the results in Table 4 were achieved. Lim et al (2014) observed in a study of environmental behaviour among undergraduates in Malaysia that there was a positive association between high knowledge and attitudes with pro-environmental behaviours. The results in this study was found to be inconsistent with this finding as attitude is observed to be negatively correlated with perspective and personal REB with regards to Settings and Infrastructure, Water and Transportation. For the Water criteria, attitude was found to have a significant negative correlation with perception (rs(322) = -.231, p≤ .05), personal REB
(rs(322) = -.200, p≤ .05) and student council REB (rs(322) = -.303, p≤ .05). It
is interesting to note that while the students have a positive attitude towards water conservation through the implementation of rainwater harvesting, they have not observed much water conservation activities on campus which in turn results in low water conservation behaviour on a personal and organizational scale.
Table 5 Spearman’s correlations according to UI Greenmetrics Criteria
Settings and Infrastructure (SI)
1 2 3 4
1.SI Perception 1
2.SI Attitude -.014 1
3.SI Personal REB .163** -.054 1
Waste (WS)
1.WS Perception 1
2.WS Attitude .250** 1
3.WS Personal REB .152** .055 1
4.WS Council REB .382** .120* .283** 1 Transportation (TR)
1.TR Perception 1
2.TR Attitude -.105 1
3.TR Personal REB .139* -.038 1
4.TR Council REB .276** -.088 .174** 1 Energy and Climate Change (EC)
1.EC Perception 1
2.EC Attitude .078 1
3.EC Personal REB .091 .283** 1
4.EC Council REB .394** .169** .210** 1 Water (WR)
1.WR Perception 1
2.WR Attitude -.231** 1
3.WR Personal REB .355** -.200** 1
4.WR Council REB .431** -.303** .556** 1 Education (ED)
1.ED Perception 1
2.ED Attitude .278** 1
3.ED Personal REB .496** .407** 1
4.ED Council REB .194** .013 .204** 1 **. Correlation is significant at the 0.01 level (2-tailed).
CONCLUSION
should reassess their targets on achieving green campus status to include the environmental literacy of graduates as the desired outcome of tertiary education. Working towards this, university administrators should consider increasing the student involvement in the planning and implementation of sustainable practices in the campus.
ACKNOWLEDGEMENTS
This research was partially supported by the Public Service Department, Malaysia. We are thankful to Associate Professor Dr. Sopian Bin Bujang and Ms. Idura Binti Yaakup from the Ministry of Higher Education for their help in facilitating communication with the respondents and Associate Professor Dr. Ramdzani Abdullah from the Faculty of Environmental Studies, Universiti Putra Malaysia who provided expertise that greatly assisted the research.
REFERENCES
Burchett, J. H. (2015). Environmental literacy and its implications for effective public policy formation. Baker Scholar Projects. Retrieved from: http://trace.tennessee.edu/utk_bakerschol/27
Clair, R. S. (2003). Words for the world: Creating critical environmental literacy for adults. New Directions for Adult and Continuing Education, 2003(99), 69–78.
Hussin, R., & Kunjuraman, V. (2015). Exploring strategies for sustainable ‘ecocampus’: The experience of Universiti Malaysia Sabah. Geografia online@ Malaysian Journal of Society and Space, 11, 84-96.
Lauder A., Sari, R. F., Suwartha, N., & Tjahjono, G. (2015). Critical review of a global campus sustainability ranking: GreenMetric. Journal of Cleaner Production. doi: 10.1016/j.jclepro.2015.02.080.
Kaplowitz, M. D., & Levine, R. (2005). How environmental knowledge measures up at a big ten university. Environmental Education Research, 11(2), 143-160.
Lim, K. H., Harun, R., Ching, F. G., & Yeo, L. Y. (2014). Environmental awareness, attitude and behaviour among under graduates in Malaysia. In
Proceedings of the International Conference on Environmental Forensics 2013: From Sources to Solution (pp. 427-432). Singapore: Springer. Mat, S. O. H. I. F., Sopian, K., Mokhtar, M., Ali, B., Hashim, H. S., Rashid, A.
K. A., & Zain, M. F. M. (2011). Managing Sustainability in Universiti Kebangsaan Malaysia. Environmental Problems and Development, 33-38. Milfont, T. L., & Duckitt, J. (2010). The environmental attitudes inventory: A valid and reliable measure to assess the structure of environmental attitudes. Journal of Environmental Psychology, 30(1), 80-94.
impacts on quality of life of stakeholders in Green and Non-Green Campus universities. SpringerPlus (2016)5:84 DOI 10.1186/s40064‑016‑1697‑4 Universitas Indonesia (2015). UI GreenMetric World University Ranking.