Studies on Regulation of the Cell Cycle in Fission Yeast
Miroslava Pozgajova
*, Peter Androvic, Anna Trakovicka
SlovakUniversity of Agriculture in Nitra,Tr. A. Hlinku 2, 94976 Nitra, Slovak Republik
Abstract
Essential for normal life progression and reproduction is correct chromosome segregation during mitosis and meiosis. Defects in the division program lead to aneuploidy, which in turn leads to birth defects, miscarriages or cancer. Although, researchers invented much about the regulation of the cell cycle, there is still long way to understand the complexity of the regulatory machineries that ensure proper segregation of chromosomes. In this paper we show the results of visualization of the cell cycle progression during meiosis and mitosis with the use of live cell imaging microscopy technique. As a model organism we use the fission yeast Schizosaccharomyces pombe.
Keywords: meiosis, mitosis, live cell imaging, Schizosaccharomyces pombe
1. Introduction
Cell is the basic element of all living species.
Every time a cell divides it must completely duplicate its genome, which is subsequently segregated into daughter cells. During evolution, two types of cell division have developed namely mitosis and meiosis [1]. Mitosis results in production of two identical daughter cells with diploid chromosome number (2n) that arise from one mother cell. This process ensures growth of the organism. If a mistake occurs in this process, the resulting daughter cells will inherit either too many or too few chromosomes, a condition known as aneuploidy [2]. A wide number of research studies have shown that such abnormality is commonly present in tumor cells, suggesting that chromosome segregation defects play a significant role in tumor development and progression [3]. Special type of cell division, meiosis, is responsible for production of gametes that are essential for reproduction, as it reduces number of chromosomes and the result is production of four
* Corresponding author:
Miroslava Pozgajova, Tel. 00421948003749, Email:
cells with haploid number of chromosomes (n). Correct segregation of the genome during gametogenesis is critical for the proliferation of sexually reproducing species. Errors in chromosome segregation during meiosis result in aneuploidy, the leading cause of birth defects and miscarriages in humans [4].
Thus, chromosome segregation is a research topic of many scientific laboratories [5, 6, 7, and others]. The exact mechanism of accurate chromosome segregation however, still remains unclear.
Chromosome segregation errors are highly frequent in mammalian female meiosis and their incidence gradually increases with maternal age. Identification and characterization of proteins and protein complexes involved in this process is essential for understanding of how and why chromosomes mis-segregate.
Pozgajova M. et al./Scientific Papers: Animal Science and Biotechnologies, 2015, 48 (1)
174 chromosomes, contains 4824 protein-coding genes, which makes it a free-living organism with the smallest amount of genes yet identified among eukaryotes [9]. The strength of the use of S.pombe as model organism lies in its easy and inexpensive handling as well as rapid growth. Moreover, S. pombe is harmless, and most importantly 172 S. pombe proteins have similarity with proteins related to human diseases. Furthermore, the S. pombe chromosome organisation is very similar to that of higher eukaryotes. This makes it a powerful tool for studying regulation, control and characterisation of biological processes in eukaryotic cells.
To understand how biological processes, such as maintaining proper chromosome segregation function, it is necessary to perform detailed
analysis on molecular basis with the help of microscopic visualisation. Modern visualisation techniques, such as live cell imaging, enable us to visually follow the whole process of cellular division [10]. Together with up-to-date molecular biology techniques, which are used to label, delete, or modify protein of interest, it is possible to analyse the function and role of the particular molecule in chromosome segregation.
Therefore, we set up the live cell imaging system of cell visualisation, to observe the whole process of meiotic and mitotic division in living organism in real time. Chromosome segregation errors are highly frequent in mammalian female meiosis and their incidence gradually increases with maternal age. Identification and characterization of proteins and protein complexes involved in this process is essential for understanding of how and why chromosomes mis-segregate.
2. Materials and methods
Yeast strains
The genotypes of the yeast strains used in this study are as follows:
wild type: h+ ura4 mCherry-atb2-HygR
wild type GFP: h- mCherry-atb2-HygR leu1-32 lys1-131 ura4-D18
cen2(D107)::KanR-ura4+-lacO his7+::lacI-GFP
Schizosaccharomyces pombe strains were maintained and grown using standard conditions. [1, 17, 3].
Time-lapse fluorescence microscopy
Yeasts were grown on rich medium (YES) plates overnight at 32°C and for another 8hours in liquid YES. Afterwards, for meiosis studies cells were crossed and plated on nitrogen low PMG-N plates for 12 h at 25°C to induce starvation, which is necessary condition for yeast to undergo meiosis. To study mitosis cells were grown on EMM (Edimburgh minimal medium) plates. Then, cells were resuspended in liquid PMG-N or EMM and transferred to a glass-bottom microwell dish (MatTek, Ashland) coated with 2 μl of 2 mg/ml lectin BS-1 (Sigma-Aldrich). Live cell imaging was performed using epifluorescence microscope Olympus Cell R system equipped with Olympus MT-20 150W mercury arc burner, Halogen Lamp 100W, Hamamatsu ORCA-ER CCD camera, 60×/1.42 PlanApoN oil immersion objective and standard filter sets: DAPI (excitation 381– 392 nm, emission 420–460 nm), CY3 (excitation 547– 572 nm, emission 569–623 nm), and FITC (excitation 475-495 nm, and emission 510-531 nm). All meiosis experiments were performed at 25°C, and mitosis experiments at 32°C. Images of cells were taken as time-lapse with five optical Z-sections, using 1 μm z distance, in 5 min intervals for eight hours. Image and data analyses were performed in ImageJ. The length of meiosis and mitosis duration was determined using the above described Olympus Cell R system.
3. Results and discussion
With this system, it is possible to observe green dot (using the FITC filter) representing the chromosome, surrounded with blue-labelled DNA (using the DAPI filter) and attached to α-tubulin (using the Cy3 filter).
For normal meiosis it is characteristic, that during first meiotic division GFP dot moves to one pole
of the cell, and subsequently during second meiotic division sister chromatids separate (Fig. 1). All conditions diverse from described conditions are concerned as errors in chromosome segregation.
Anaphase I Anaphase II
Normal segregation (reductional)
Missegregation of sister chromatids
Normal segregation (segregation of sister chromatids)
Sister chromatid non-disjunction Meiosis
Anaphase I Anaphase II
Normal segregation (reductional)
Missegregation of sister chromatids
Normal segregation (segregation of sister chromatids)
Sister chromatid non-disjunction Meiosis
Figure 1. Schematic pictures of chromosome segregation during meiosis.
Proper segregation of chromosomes requires segregation of homologus chromosomes during first meiotic division and segregation of sister chromatids during second meiotic division.
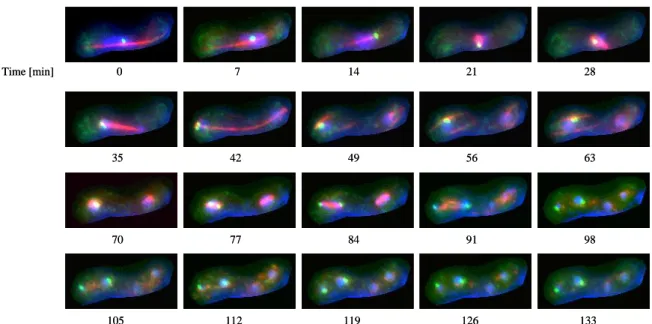
Normally, there is very low amount, if any, of missegregating chromosomes in wild type cells. This was also observed in our system, in which we did not detect any missegregation of chromosomes in 70 visualised cells (Figure 2). Therefore, we can conclude, that the yeast strains with all labelling undergo normal meiosis suggesting, that the set up is suitable for analyses with
reproducible results. Duration of the meiotic division was measured 12 hours after induction of mating on solid PMG –N plates. Afterwards, cells were resuspended in liquid PMG –N and after mild sonication, transferred on glass-bottom microwell dish coated with 2µL of 2mg/ml lectin BS-1.
7 14 21 28
35 42 49 56 63
70 77 84 91 98
105 112 119 126 133
0 Time [min]
Meiosis
7 14 21 28
35 42 49 56 63
70 77 84 91 98
105 112 119 126 133
0 Time [min]
Meiosis
Figure 2. Representative pictures of meiotic cells. First anaphase starts at the time point 35 to 42 minutes and second meiosis starts at 77 to 84 minutes. Afterwards 4 nuclei are present, where two on the left side contain GFP labelled
Pozgajova M. et al./Scientific Papers: Animal Science and Biotechnologies, 2015, 48 (1)
176 Almost the same procedure is used to study chromosome segregation in mitosis. Vegetative cells were grown in liquid nutritionally rich YES medium at 32°C for 6 hours. Exponentially
growing cells were then transferred to minimal medium and visualised under the Olympus Cell R fluorescence microscope (Figure 3).
mother cell
normal segregation
missegregation
Mitosis
mother cell
normal segregation
missegregation
Mitosis
Figure 3. Schematic picture of chromosome segregation during mitosis.
In this schematic draw it is shown, how chromosomes segregate during mitotic anaphase. Blue balls represent DNA stained with Hoechst33342, green dot shows segregation of second chromosome, and the red line represents
α-tubulin stained with m-cherry.
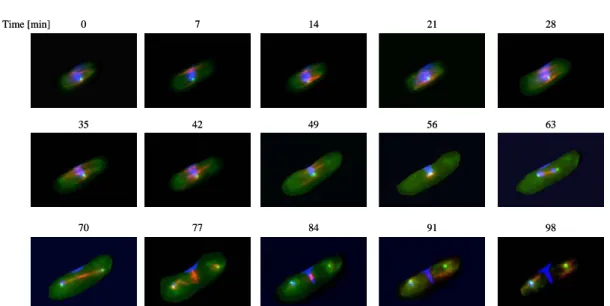
Wild type strains usually do not show chromosome missegregation under conditions which were used in our system. Indeed, no
missegregation of the second chromosome was observed during the experiment in 70 analysed cells (Figure 4).
7 14 21 28
0 Time [min]
35 42 49 56 63
70 77 84 91 98
Mitosis
7 14 21 28
0 Time [min]
35 42 49 56 63
70 77 84 91 98
Mitosis
Figure 4. Representative pictures of mitotic cells. Cells underwent anaphase at the time point 63 to 70 minutes, this was followed by segregation of nuclei and subsequent cytokinesis.
Cell cycle is a complex process its progress is regulated by vast number of proteins and protein complexes [14]. Cell division may proceed either as mitosis or meiosis [1]. Mitosis, after DNA duplication and nuclei division ensures production of two identical daughter cells from one mother cell. During meiosis, a single round of DNA
and Spo6 in the regulation of chromosome segregation and meiosis progression [7].
Live cell imaging, together with modern molecular biology techniques allow researchers to track single chromosome and study its architecture throughout meiosis or mitosis [17, 18], repair and dynamics of double-stranded breaks during meiotic recombination [19]. This state-of-the art method might help to discover phenotypes, which could be overseen with other visualisation techniques.
4. Conclusion
Our experiments have shown that it is possible to visualize and observe the whole process of chromosome segregation during meiosis and mitosis, record it, and analyse it.
The live cell imaging system we are using produces reproducible and comparable results, which makes it a suitable set-up for the analysis of chromosome segregation in meiosis and mitosis. This visualisation method together with modern molecular biology techniques will allow us to study the function of a single molecule during cell division.
Acknowledgements
This work was supported by the Slovak Research and Development Agency under the Contract No. APVV-0636-11.
References
1. Harigaya, Y., Yamamoto, M. Molecular mechanisms underlying the mitosis-meiosis decision. Chromosome Research, 2007, 523-537
2. Michaelis, C., Ciosk, R., Nasmyth, K. Cohesins: chromosomal proteins that prevent premature separation of sister chromatids. Cell, 1997, 35-45
3. Sen, S. Aneuploidy and cancer. Curr. Opin. Oncol., 2000, 82-88
4. Hassold, T., Hall, H., Hunt, P. The origin of human aneuploidy: where we have been, where we are going. Human Molecular Genetics, 2001, 203-208
5. Rabitsch, K. P. et al. Two Fission Yeast Homologs of Drosophila Mei-S332 Are Required for Chromosome Segregation during Meiosis I and II. Current Biology, 2004, 287-301
kinases required for the proper meiotic segregation of chromosomes in the fission yeast Schizosaccharomyces pombe. Cell Cycle, 2013, 618-624
8.Forsburg, S. L. The best yeast? Trends Genet, 1999, 340-344
9. Wood, V., Gwilliam, R., Rajandream, M. A., Lyne, M., Lyne, R., Stewart, A., et al. The genome sequence of Schizosaccharomyces pombe. Nature, 2002, 871-880 10. Pidoux, A.L., Uzawa, S., Perry, P.E., Cande, W.Z., and Allshire, R.C. Live analysis of lagging chromosomes during anaphase and their effect on spindle elongation rate in fission yeast. J. Cell Sci., 2000, 4177–4191
11. Cipak, L., Zhang, C., Kovacikova, I., Rumpf, C., Miadokova E., Shokat, K.M., et al. Generation of a set of conditional analog-sensitive alleles of essential protein kinases in the fission yeast Schizosaccharomyces pombe. Cell Cycle, 2011, 3527-3532
12. SABATINOS, S.A., FORSBURG, S.L. Molecular genetics of Schizosaccharomyces pombe. Methods Enzymol. 2010, 759-795
13. Dudas, A., Ahmad, S., Gregan, J. Sgo1 is required for cosegregation of sister chromatids during achiasmate meiosis I. Cell Cycle, 2011, 951-955
14. Nurse, P., Bissett, Y. Gene required in G1 for commitment to cell cycle and in G2 for control of mitosis in fission yeast. Nature, 1981, 558-560
15. Ding, D.Q., Haraguchi, T., Hiraoka, Y. From meiosis to postmeiotic events: Alignment and recognition of homologous chromosomes in meiosis. FEBS Journal, 2010, 565-570
16. Gregan, J., Riedel, C. G., Pidoux, A. L., Katou, Y., Rumpf, C., Schleiffer, A., et al. The kinetochore proteins Pcs1 and Mde4 and heterochromatin are required to prevent merotelic orientation. Curr Biol., 2007, 1190-11200
17. Gao, Q., Tanaka, T.U., He, X. GFP-based Microscopic Approaches for Whole Chromosome Analysis in Yeast. In Stansfield, I. and Stark, M.J.R. Yeast Gene Analysis. London: Academic Press, 2011, 730
18. Rumpf, C., Cipak, L., Schleiffer, A., Pidoux, A., Mechtler, K., Tolic-Norrelykke, I. M., et al. Laser microsurgery provides evidence for merotelic kinetochore attachments in fission yeast cells lacking Pcs1 or Clr4. Cell Cycle, 2010, 3997-4004
19. Leland, B.A., King, M.C. Using LacO arrays to monitor DNA double-strand break dynamics in live