Performance Analysis of Signaling
Delay for Wireless Cellular Networks
Masashi Sugano
1, Doo Seop Eom
2, Masayuki Murata
3and Hideo Miyahara
3 1Faculty of Comprehensive Rehabilitation, Osaka Prefecture College of Nursing, Osaka, Japan2Department of Electrical Engineering, Korea University, Seoul, Korea
3Graduate School of Information Science and Technology, Osaka University, Osaka, Japan
In wireless cellular networks, signaling traffic such as location update, paging and handoff due to the user’s mobility takes a considerable portion of the total traffic load. In addition, the maximum allowable delays may be different among the signaling packets. In this paper, we present an analytical model for evaluating a total processing delay of signaling packets of wireless cellular networks, which integrates the delays of the radio channel and the processing delay at the wired portion. Through numerical examples, we show that priority processing is effective for reducing the handoff processing delays. We also evaluate the delay difference among cells accord-ing to their position within the location area, and the influence of number of terminals upon the processing delays.
Keywords: wireless cellular network, signaling packet, location update, handoff, paging.
1. Introduction
In wireless cellular networks, signaling traffic such as location update, paging and handoff due
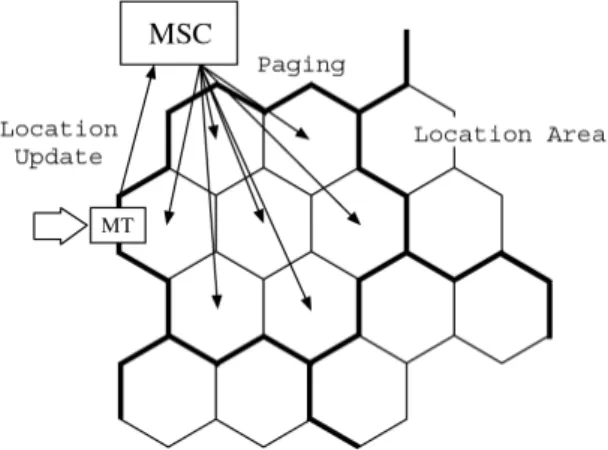
Fig. 1.Location management of mobile terminals.
to the user’s mobility takes a considerable por-tion of the total traffic load. Such signaling traffic load is significantly increasing because of increase of mobile terminals and decrease of radio cell sizes 1]. To reduce the amount of
lo-cation update signaling information, a notion of the location area has been introduced 2, 3]; the
region covered by a wireless cellular network is first divided into location areas. Each of the lo-cation areas consists of several cells(Figure 1),
and it is a basic unit for location management of the mobile terminals so that the larger location area could decrease the traffic load of location updates. However, uncertainty of the location of the mobile terminal increases as the size of the location area increases. The traffic load of paging will increase as a result. The load at the mobile switching center managing each lo-cation area is also increased. Consequently, the size of location area has a strong influence on signaling packet delays 4].
Past research was dedicated mainly to the sig-naling traffic of the wired portion of the cellular network. For example, the authors in 5]
eval-uated the signaling load of Signaling System 7
(SS7)in both the Pan–European GSM system
and the North American IS–41. In 6, 7], the
authors have proposed new paging schemes to reduce paging costs under delay bounds. Also, there was some research on evaluating the ef-fect of signaling traffic in wireless ATM net-works 8, 9, 10, 11, 12], but they only focused
On the other hand, Rubin et al. have stud-ied the signaling delay experienced on the ra-dio channels in wireless cellular networks 13].
They analyzed the delay of the forward signal-ing channel which is a radio channel directed from a base station to mobile terminals. They also discussed the relation between the signal-ing delay and the size of location area 2]. In
those works, however, they only evaluated the delay on radio channels, and did not consider the processing delay in the wired portion of the cellular networks, in spite of the fact that the lo-cation area size affects not only the traffic load of the radio channel, but also, the processing de-lay at the wired part of the network. Therefore, it becomes essential to consider the delays of the wireless channel and those in the wired net-work. Only such total modeling of the cellular network makes it possible to evaluate the pro-cessing delay of the wireless cellular network such as call setup delays.
In addition, the maximum allowable delays may be different among the signaling packets. For example, when a mobile terminal with commu-nicating in progress crosses the boundary of a cell in order to avoid information loss, its hand-off processing delay must be kept as small as possible. The processing of location updates, on the contrary, would not require such a strin-gent delay. The priority scheduling seems to be attractive to satisfy different kinds of QoS requirements. Actually, several priority assign-ment schemes on radio channels were presented in 2], but the effect of priority processing in the
wired portion of the cellular network should also be clarified.
In this paper, we present an analytical model for evaluating the total processing delay of signal-ing packets of wireless cellular networks. By using this model, we can design a system sat-isfying the delay requirement of each type of processing. Through the analytical method, we derive the total processing delays for connection setup, location update and handoff. In addition, we introduce priority processing to reduce the handoff processing delay, and evaluate its ef-fectiveness through numerical examples. The signaling delay should also be influenced by the position of the cells within the location area, because the arrival rate of location update pack-ets is different. Therefore, we will compare the delays experienced in each cell according to the
position of its location area. We will also in-vestigate the influence of number of terminals upon processing delays.
This paper is organized as follows. In the next section, we explain the model of the wireless cellular network and the processing delay under consideration. In Section 3 we present the ana-lytical method to derive each processing delay. In Section 4, we discuss the performance im-provement of the priority processing for hand-off delay, the delay differences among cells in a location area, and the influence of number of terminals. Finally, we conclude our paper in Section 5.
2. Model Description
2.1. Model of Wireless Cellular Network
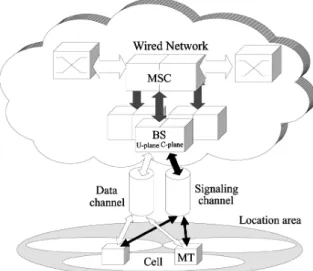
As illustrated in Figure 2, we assume that a wire-less cellular network has the following compo-nents;
Mobile terminal(MT)
Base station(BS)
Mobile switching center(MSC)
The region covered by the wireless cellular net-work is divided into location areas. Each loca-tion area consists of some adjacent cells, and has its dedicated MSC. Under this configuration, the following control should be performed;
When a MT crosses the boundary of the lo-cation area, it generates a lolo-cation update packet, by which the involved MSCs are in-formed of the location change of the MT. When a MSC receives a call request for the MT within the location area, paging packets are broadcasted by BSs in the location area to alert the MT to the incoming call. Upon receipt of the response from the destined MT, the call setup becomes possible.
The wireless channel is divided into the data channel for user data and the signaling chan-nel for the signaling packets. In the current study, we chose TDMA/TDD (Time Division
Multiple Access/Time Division Duplex) 14]
as a multiple access method, which implements an underlying physical structure. TDMA/TDD
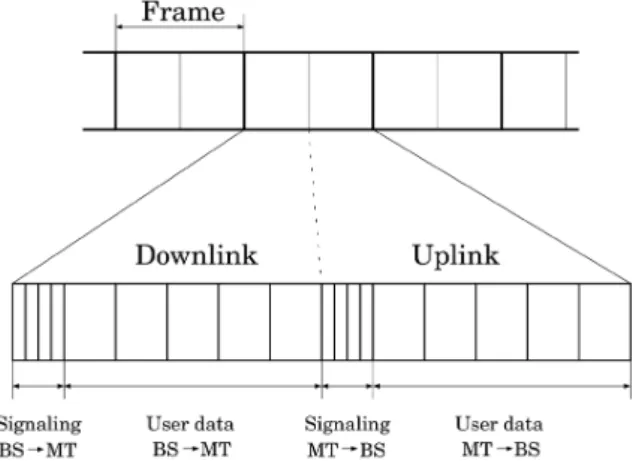
has been adopted by several wireless ATM pro-totype implementations, and we believe that the method is most suitable to realize the mecha-nism of QoS guarantees. As shown in Figure 3, TDMA/TDD protocol divides a fixed length
frame into uplink(from MTs to BS)and
down-link dynamically, and it is applicable to the en-vironment where the demand of both directions changes, dependent on time. Both downlink and uplink consist of control slots and user data slots for each direction.
Fig. 3.Radio frame structure of TDMA/TDD.
When the MT has a new signaling packet to transmit, it first sends the packet on the control slot, according to a slotted ALOHA protocol. If the BS receives the signaling packet correctly, it returns the acknowledgment during the next downlink. On the other hand, if packet colli-sion occurs, the BS sends no response, so that
the MT will retry the transmission at the next frame. We will consider the delays caused by retransmissions to derive from the transmission delay on radio channel, as shown in Section 3.
2.2. Signaling Packet Flow and Processing Delays
The delay experienced by the signaling packet consists of the transmission delay on both up-link and downup-link, the processing delays at BS and MSC, and the processing delay at the wired network. We evaluate the following signaling packet delays;
Mobile originating call setup delay: TMW
Let TMW represent the time duration from
generation of CR(call request)at MT to
ar-rival of CA (call acknowledgment) at MT
as shown in Figure 4(a). For calls destined
for the wired networks, the flow of the CR packet is; Uplink!BS!MSC. After being
processed at wired network, CA is returned
via MSC!BS!Downlink.
Mobile terminating call setup delay: TWM
TWM represents the time duration from the
arrival of call request at MSC to the time when its response is sent to the wired net-work. For calls destined for some MT, PG
(paging) packets are broadcasted from the
MSC to BSs in the MSC’s location area, and sent to MTs via downlink. Then, the cor-responding MT generates CR which will be returned to the wired network(Figure 4(b)).
Location update processing delay: TLU
The flow of LU(location update)requests is
Uplink ! BS ! MSC, and corresponding
LA(location update acknowledgment)is
re-turned as BS!downlink(Figure 4(c)).
Handoff processing delay: THO
HO (handoff) requests are sent via Uplink
!BS!MSC. After the handoff request is
processed at the wired network, the corre-sponding HA(handoff acknowledgment)is
returned as MSC!BS!downlink(Figure
(a) MT originating call setup
(b) MT terminating call setup
(c) Location update
(d) Handoff
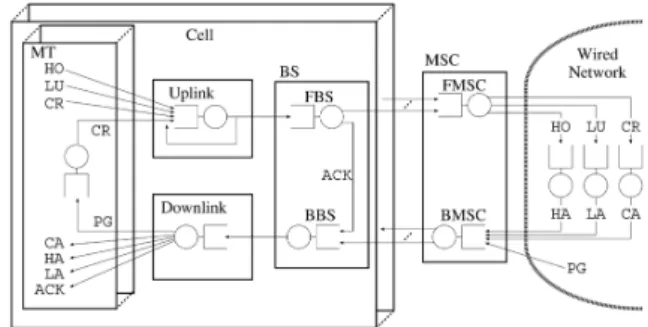
Fig. 4.Signaling packet flow and processing delay.
3. Analysis
3.1. Queuing Network Model
To analytically derive processing delays, we build a queuing network model to evaluate the delays of signaling packets in the wireless cel-lular networks(see Figure 5). In what follows,
we define each queue in turn.
Fig. 5.Queuing model of the signaling traffic of the wireless cellular networks.
1. Uplink queue of the wireless channel The uplink is contended by CR, LU, and HO packets. CR packets to respond to PG pack-ets should also be considered. The delays of those packets are determined by the ap-proximate analysis which takes into account collision of the packets due to the multiple access protocol of the TDMA/TDD system.
2. FBS(forward base station)queue
When BS processes the packet, it returns acknowledgment(ACK)to the sending MT
via the corresponding BS. At the same time, BS forwards the packet to MSC. The packets are processed in an FIFO manner.
3. FMSC (forward mobile switching center)
queue
MSC handles all incoming packets from BSs within the location area. Those packets are processed in an FIFO manner and forwarded to the wired network,
4. CR, LU and HO queues
CR, LU and HO queues represent the delays of the corresponding packets experienced at the wired networks. HO, LU and CR pack-ets are assumed to be processed separately. The exact representation cannot be known, and we use IS (Infinite Server) queues for
5. BMSC(backward mobile switching center)
queue
CA, LA and HA signaling packets are re-turned to BSs by the MSC. PG packets com-ing from the wired network are also for-warded to the appropriate MT via BS. Those are processed in an FIFO manner.
6. BBS(backward base station)queue
Signaling packets coming from MSC are processed in an FIFO manner at the BS. 7. Downlink queue of the wireless channel
The packet delay at the downlink queue can be modeled by FIFO queue since the BS sta-tion can actively schedule the packet trans-mission on the wireless channel.
To formulate the problem, we introduce some notations and assumptions as follows;
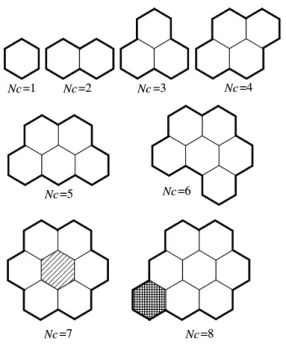
1. Each location area consists ofNccells.
2. MTs are uniformly spread within the net-work, so that each cell hasNMT mobile
ter-minals.
3. Arrivals of MT originating and terminating call requests follow Poisson processes with rateλMW andλWM, respectively.
4. Call duration has an exponential distribution with mean 1=µ. Furthermore, the duration
of MT stay in the wireless cell before moving into other cells follows an exponential dis-tribution with mean 1=h. Generally, these
approximation is introduced by the perfor-mance evaluation of cellular networks (see
e.g., 15, 16, 17]). By introducing these
ap-proximation, due to the PASTA(Poisson
ar-rivals see time-averages)property, the
hand-off call and the new call can be treated iden-tically.
5. The processing time at MT, BS, MSC, and wired portion follow exponential distribu-tions with means.
1=µMT: Mean processing time at MT.
1=µBS: Mean processing time at BS.
1=µMSC: Mean processing time at MSC.
1=µCR: Mean call setup time.
1=µHO: Mean handoff processing time.
1=µLU: Mean location update processing
time.
6. The MT engaged in the active call does not generate CR packets. Therefore, when we consider the arrivals of CR packets at MSC, such a possibility should be considered. 7. The transmission delay at wired network is
assumed to be negligible.
Furthermore, we use the following notations to describe the delay at each component. In these notations, the symbol ‘’ represents the types
of signaling packets(e.g., CR). In addition, we
introduce the indexk(k =1:::Nc)to
distin-guish the delays at each cell, since the arrival rates of location update packets are different at each cell, according to its position in the loca-tion area.
Dk
Ru(): Transmission delay on uplink. Dk
Rd(): Transmission delay on downlink. DkBu(): Processing delay at FBS.
Dk
Bd(): Processing delay at BBS. DMu(): Processing delay at FMSC. DMd(): Processing delay at BMSC. DMp(): Processing delay for call setup,
lo-cation update, and handoff at wired network.
DMT(): Processing delay of call setup at a
MT.
If we assume the exponential distributions of processing delay at all queues, we can have a product–form network solution, for which we have well–known computational methods such as the convolution method and the MVA algo-rithm 18]. However, we have the Uplink queue
not satisfying the condition of the product–form solution. Nevertheless, we adopt the widely used approximation approach that the uplink queue is modeled as an IS (infinite server)
queue, where work demands of the signaling packets are determined by separately perform-ing delay analysis of the multiple access system. Then, our model can be numerically analyzed. To consider priority scheduling for several sig-naling packets, we need to introduce another approximate analysis 19]. As shown in the
3.2. Delay Analysis at Each Component
3.2.1. Analysis of Uplink Transmission Delay
We first considerλCR, the CR packet arrival rate
at uplink. CR packets are generated by the call request in both directions. Furthermore, from our assumption that active MT does not generate CR packets, only idle MTs generate CR pack-ets. Letpbusybe the probability that the MT has
the active call. We can derive the average num-ber of idle MTs in the cell as(1;pbusy)NMT.
Then, we have the CR arrival rate as
λCR=(λMW+λWM) ;
1;pbusy
NMT (1)
where pbusy is derived by approximating each
MT as M/M/1/1 queuing system;
pbusy=
(λMW +λWM)=µ
1+(λMW+λWM)=µ
: (2)
When the MT having the active call moves into another cell, the MT generates the HO packet. Therefore, the arrival rate of HO packets is given by
λHO =hpbusyNMT: (3)
On the contrary, when the idle MT moves into another location area, it generates the LU packet. However, the arrival rates of LU packets at cells are different according to the cell’s position within the location area. Let us introduceck to
represent the fraction of the length of the bound-ary of thek–th cell whenk–th cell is located at the boundary of the location area. Ifk–th cell is not at the boundary of the location area, the MT in that cell does not generate the LU packets. The coefficientckcan be determined by the
po-sition of the k–th cell in the location area. For example, in the case of Figure 1,ck =0 for the
centered cell, andck =1=2 for other cells.
Thus, we can determine the arrival rate of LU packets atk–th(k =1:::Nc)cell in the
loca-tion area. We have
λk
LU =h(1;pbusy)NMT ck: (4)
Total packet arrival rate on the uplink is finally given as λCR +λHO +λ
k
LU. Since the
slot-ted ALOHA is considered for the multiple ac-cess method, collisions of the packets should
be taken into consideration. Let pkcol be the probability of the collision atk–th cell(its
de-termination is given later). By assuming that
the number of retransmissions until the packet is successfully admitted by FBS follows the geometric distribution, the average number of transmissions is given by 1=(1;p
k
col). We then
obtain the packet arrival rate including retrans-missions as
λupk =
1 1;p
k col
λCR+λHO+λ
k LU
: (5)
LetTf be the frame length, andnube the
num-ber of control slots of uplink in the frame. By considering that the packets having arrived in the previous frame compete for the control slots in the current frame, the packet collision prob-ability,pk
col, can be determined as
pkcol =1;e ;Tfλ
k up=nu
: (6)
Sincepkcoldepends onλk
up, we should deriveλupk
by an iterative calculation using Eqs.(5)and(6).
After BS receives the control packet, it returns ACK in the downlink part of the next frame. Thus, the MT not receiving the ACK immedi-ately retransmits the packet in the next control slots. Then we finally have the uplink delay
Dk
Ru()as follows: DkRu()=
pk col
1;p
k col
Tf + Tf
2 : (7)
The second term in the above equation repre-sents the average delay from the packet arrival to the control slots at the next frame.
3.2.2. Analysis of Downlink Transmission Delay
When the MT terminating call arrives at MSC, it broadcasts PG packets to all BSs within the lo-cation area. The PG arrival rate is thus obtained as
λPG =λWM(1;pbusy)NMTNc: (8)
Since MSC receiving CR, HO, and LU packets generates corresponding ACK packets, those ar-rival rates are obtained as
λCA =λCR λHA=λHO λ
k LA=λ
Furthermore, BS returns the ACK packet when it receives CR, LU, and HO correctly. The ar-rival rate of ACK packets is then given as
λk
ACK =λCR+λHO+λ
k
LU: (10)
We have the arrival rate of downlink atk–th cell as follows:
λdownk =λPG+λCA+λHA+λ
k LA+λ
k
ACK: (11)
Letnd be the number of control slots in
down-link. We approximately model the downlink queue as an M/D/1 queue where transmission
time of signaling packets isTf=nd. Then we
ob-tain the downlink delay atk–th cell as follows:
DkRd()=
Tfλdownk
2nd(nd;Tfλ
k down)
+ Tf
2 : (12)
3.2.3. Analysis of FBS Queue
The arrival rates of CR, HO, and LU packets at the FBS queue are given byλCR,λHO, andλLUk ,
respectively. The priority processing may be introduced to satisfy the different delay require-ments according to the kind of signaling packet. In that case, we can derive the processing de-lay at FBS by modeling it as a non-preemptive priority scheduling queuing system.
Consider the case where HO packets are given higher priority than other signaling packets. By assuming the exponential distribution for the processing time with identical means 1=µBSfor
all signaling packets, we can obtain the packet delay of HO packets as(see, e.g., 19])
DkBu(HO)=
1
µBS
+ Rk
1;ρ1
: (13)
CR and LU packet delays with lower priority are identically given by
DkBu(CR)= D
k Bu(LU) =
1 µBS +
Rk
(1;ρ1)(1;ρ1;ρ
k 2)
(14)
where
ρ1 =
λHO
µBS
ρ
k
2=
λCR+λ
k LU
µBS
and
Rk =
λCR+λHO+λ
k LU
µBS2
:
3.2.4. Analysis of BBS Queue
In the BBS queue, ACK packets should be considered in addition to CA, LA, HA, and PG packets. However, the delay analysis can be performed in a way similar to the analysis of the FBS queue. It is true, even in the case of introducing the priority processing.
3.2.5. Analysis of FMSC Queue
The total packet arrival rate at the FMSC queue from all BSs belonging to the same location area is given byNcλCR,NcλHO, and
PN
c
k=1λ
k LU. We
can also adopt the priority processing.
3.2.6. Analysis of BMSC Queue
CA, LA, HA, and PG packets arrive at BMSC. Priority processing is also allowed.
3.2.7. Analysis of Processing Delay at the Wired Network
According to our assumption, the average pro-cessing delay for each type of signaling packets at wired network is derived by using the analy-sis results of the M/M/1 queue. For example,
the call setup time at the wired network is given by
DMp(CR)=
1=µCR
1;NcλCR=µCR
: (15)
3.2.8. Analysis of Processing Delay at MT
The arrival rate of PG packets at the MT isλWM,
and therefore we obtain the average processing delay at MT as
DMT(PG)=
1=µMT
1;λWM=µMT
3.3. Derivation of Total Processing Delay
Based on the analysis of each component, we finally derive the total average processing delay for each type of signaling packets under consid-eration.
MT originating call setup delay
By simply summing up the delay at each component, we can obtain the total aver-age processing delay for MT originating call setup at the k–th cell in the location area as follows:
TMWk = DMu(CR)+DMp(CR)+DMd(CA) +D
k
Ru(CR)+D
k Bu(CR) +D
k
Bd(CA)+D
k
Rd(CA) (17)
MT terminating call setup delay
Similarly, we have the total average process-ing delay for the MT terminatprocess-ing call setup at thek–th cell in the location area as follows:
TWMk = DMd(PG)+DMT(PG)+DMu(CR) +D
k
Bd(PG)+D
k Rd(PG) +D
k
Ru(CR)+D
k
Bu(CR) (18)
Handoff processing delay
The handoff signaling packets are transferred via the same route as MT originating call setup packets. Then we have
THOk = DMu(HO)+DMp(HO)+DMd(HA) +D
k
Ru(HO)+D
k Bu(HO) +D
k
Bd(HA)+D
k
Rd(HA) (19)
Location update processing delay
Similarly, we can obtain the average delay
by applying CR ! LU and CA ! LA to
Eq.(17).
4. Numerical Examples and Discussions
In the previous section, we have presented ana-lytical techniques for deriving the total process-ing delay for each type of signalprocess-ing packets. Based on those results, we now present numer-ical examples. Parameters used for the numeri-cal examples are summarized in Table 1. Most parameters are drawn from 2, 8].
Frame length 20 ms
Control slots in uplink 2
Control slots in downlink 2
Ave. number of MTs per cell 100
MT terminating call rate 0.0013 calls/sec
MT originating call rate 0.002 calls/sec
Ave. call duration 180 sec
Ave. cell sojourn time 20 sec
Ave. processing time in MT 10 msec
Ave. processing time in BS 5 msec
Ave. processing time in MSC 10 msec
Ave. connection setup time 10 msec
Ave. location update time 10 msec
Ave. handoff processing time 10 msec
Table 1.Parameter settings.
4.1. Effect of Priority Processing
First, we show the case without priority pro-cessing. In this case, all kinds of signaling mes-sages are processed by the FIFO discipline at every component. In what follows, we present the overall average delay in the location area. For example, the overall average delay of MT originating call setup delay is given by
TMW =
1
Nc Nc
X
k=1
TMWk : (20)
Figure 6(a)shows how the location area size
(a) Without priority processing
(b) Higher priority is given to handoff packets at BS
(c) Higher priority is given to handoff packets at MSC
Fig. 6.Effect of priority processing on average processing delay.
Next, we investigated the effect of priority pro-cessing. First, we performed priority process-ing to the handoff and the ACK packet at base stations. That is, we applied the priority higher than CR and LU packets to HO packets in the FBS queue, and applied the priority higher than CA and LA packets to HA and an ACK pack-ets in the BBS queue. However, as shown in Figure 6(b), the priority processing at BS was
almost ineffective. The next example shown in Figure 6(c) clearly demonstrates the effect of
priority processing at MSC. In this case, HO packet is given higher priority than CR and LU at FMSC queue, and HA packet is given higher priority than CA and LA packets. The handoff delays can be much improved at the expense of increased processing delays of other packets. If the location area is small(Nc=1 to 7 in Figure
6(c)), however, we can see that the priority
pro-cessing is not so effective. This is because the delays of uplink and downlink are dominant in the total processing delays in this region. From these results, it became clear that the priority processing in MSC is effective, because all the packets in a location area concentrated on the MSC and the load of MSC increased.
4.2. Delay Difference Among Cells
In the previous subsection, we have evaluated the overall average delay in the location area. However, the processing delays are actually different, according to the position of the cell within the location area. It is because the loca-tion update signaling packets only arrive at the edge of the location area, which affects the pro-cessing delays of other signaling packets. We examine the differences of the processing delays at cells. Figure 8 shows the maximum, mini-mum, and average of handoff processing delays within the location area. It can be obtained by using Eq.(19). For given number of cells per
the location area, the structure illustrated in Fig-ure 7 was used.
The minimum delay is observed in the cell lo-cated in the center of the location area. In the figure, the minimum delay is almost linearly de-creased asNc becomes larger. Then, whenNc
Fig. 7.Structure of location areas.
Fig. 8.Delay differences due to the position of each cell in a location area.
seven, the larger size of the location area leads to decrease of the location update traffic load since all cells partly have the boundary of the loca-tion area. As the localoca-tion area size gets larger than seven, the location update packet does not arrive at the cell around the center of the area
(the hatched cell in Figure 7). Therefore, larger
location area leads to increase of the processing delays due to the increase of PG load and the bottleneck of MSC.
On the contrary, the maximum delay varies ir-regularly. This is because the structure of the location area leads to the various lengths of the boundary of the location area (see, e.g., the
meshed cell in Figure 7). Since the location
update load becomes heavy in such a cell, the average processing delays become large. In a regular structure(such as the case ofNc = 7),
on the other hand, the average processing delay is small. From the figure, we can observe that in designing the system, it is important to take ac-count of the structure of the location area since there exists an appropriate structure to minimize the location update traffic load.
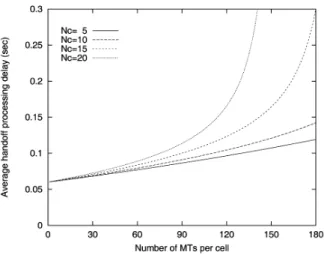
4.3. Influence of the Number of Terminals Upon Processing Delay
We last investigate the influence of the aver-age number of terminals upon processing delay. Figure 9(a)shows how the number of terminals
affects the average handoff delays for several location area sizes(Nc=5, 10, 15, and 20). In
this example, we do not apply priority process-ing at any component, and assume that the other parameters are same as in the previous case(
Ta-ble 1). As the number of terminals increases, the
load of signaling packets also increases and then the average processing delay becomes larger. The degradation of performance is more seri-ous at larger location areas. This is because all signaling packets are concentrated at MSC, and processing load of MSC becomes heavy as the location area size increases.
To keep the robustness against the increase of the number of terminals, we finally examine the effect of processing capability of MSC upon the total processing delay. Figure 9(b)shows the
average handoff processing delays where the processing delay of MSC, 1=µMSC, is reduced
to 5 msec. By comparing Figure 9(a) and(b),
(a) Average handoff processing delay vs. number of terminals (Mean processing time at MSC:1=µMSC=10 msec)
(b) Effects of processing capability of MSC (1=µMSC=5 msec)
Fig. 9.Influence of the average number of terminals upon handoff processing delay.
5. Conclusion
In this paper, we have presented an analytical model for evaluating a total processing delay of signaling packets of the wireless cellular net-works. By using our proposed model, we have derived the delays of call setup, location update, and handoff packets. Furthermore, we have in-troduced priority processing in the model to re-duce the handoff processing delay, and evalu-ated its effectiveness through numerical exam-ples. We have also evaluated the delay differ-ence among cells within the location area to show how the location area structure affects the
processing delays. Finally, we have shown the influence of the number of terminals upon pro-cessing delays.
For future research topics, we need to analyze the bottleneck under various system parameters, to find out the component which dominates the total processing delays. While in the current paper we have simply assigned higher priority to handoff signaling packets than to the others, it is important to investigate more appropriate priority assignment based on the practical delay requirements of signaling packets.
References
1] K.S. MEIER-HELLSTERN, E. ALONSO, AND D.R. O’NEIL, The use of SS7 and GSM to support
high density personal communications,Proceedins of the IEEE International Conference on Communi-cations,(1992)Chicago. pp. 1698–1702.
2] I. RUBIN ANDC.W. CHOI, Impact of the location area structure on the performance of signaling channels in wireless cellular networks, IEEE Communica-tions Magazine,35(1997), no. 2, pp. 108–115. 3] L.P. ARAUJO ANDJ.R.B.DEMARCA, Paging and
lo-cation update algorithms for cellular systems,IEEE Transactions on Vehicular Technology,49(2000), pp. 1606–1614.
4] A. MUKHERJEE, S. BANDYOPADHYAY,ANDD. SAHA, Location Management and Routing in Mobile Wire-less Networks, Artech House, 2003.
5] G.P. POLLINI, K.S. MEIER-HELLSTERN, AND D.J. GOODMAN, Signaling traffic volume generated by mobile and personal communications,IEEE Com-munications Magazine,33(1995), no. 6, pp. 60–65. 6] W. WANG ANDI.F. AKYILDIZ, Reducing the paging costs under delay bound for PCS networks, Pro-ceedings of the IEEE Wireless Communications and Networking Conference,(2000)Chicago, IL. 7] W. WANG, I.F. AKYILDIZ, G.L. STUBER¨ , AND
B.-Y. CHUNG, Effective paging schemes with delay
bounds as QoS constraints in wireless systems, Wireless Networks,7(2001), pp. 455–466.
8] M. VEERARAGHAVAN, T.F. LAPORTA,ANDR. RAM
-JEE, A distributed control strategy for wireless ATM
Networks, Proceedings of the IEEE International Conference on Communications, (1995) Seattle, WA.
10] R. YUAN, S.K. BISWAS, AND D. RAYCHAUDHURI, A signaling and control architecture for mobility support in wireless ATM networks,Proceedings of the IEEE International Conference on Communica-tions,(1996)Dallas, TX.
11] B.A. AKYOL,ANDD.C. COX, Signaling alternatives in a wireless ATM network,IEEE Journal on Se-lected Areas in Communications, 15 (1997), pp. 35–49.
12] N.H. LOUKAS, N.I. PASSAS, L.F. MERAKOS,ANDI.S. VENIERIS, Design of call control signaling in
wire-less ATM networks,Proceedings of the IEEE Inter-national Conference on Communications, (1997) Quebec, pp. 1554–1559.
13] I. RUBIN ANDC.W. CHOI, Delay analysis for for-ward signaling channels in wireless cellular net-work,Proceedings of the IEEE INFOCOM,(1996), San Francisco, CA.
14] D. RAYCHAUDHURI, Wireless ATM networks: ar-chitecture, system, design and prototyping, IEEE Personal Communications, 3 (1996), no. 4, pp. 42–49.
15] D. HONG ANDS.S. RAPPAPORT, Traffic model and performance analysis for cellular mobile radio tele-phone systems with prioritized and nonprioritized handoff procedures,IEEE Transactions on Vehicu-lar Technology,35(1986), no. 3, pp. 77–92. 16] G. FOSCHINI, B. GOPINATH, AND Z. MILJANIC,
Channel cost of mobility, IEEE Transactions on Vehicular Technology,42(1993), no. 4, pp. 414– 424.
17] M. NAGHSHINEH ANDA.S. ACAMPORA, Design and control of micro-cellular networks with QOS pro-visioning for real-time traffic,Jornal of High Speed Networks,5(1996), Issue 1, pp. 53–71.
18] S.C. AGRAWAL,Metamodeling, MIT Press, 1985. 19] D. BERTSEKAS ANDR. GALLAGER,Data Networks
Second Edition, Prentice-Hall, 1992.
Received:December, 2003
Revised:July, 2004
Accepted:July, 2004
Contact address:
Masashi Sugano Faculty of Comprehensive Rehabilitation Osaka Prefecture College of Nursing 3-7-30, Habikino, Habikino-shi Osaka, 583-8555 Japan e-mail:[email protected]
Web:http://www.osaka-hsu.ac. jp/ s ugan o
MASASHISUGANOreceived the B.E., M.E., and D.E. degrees in Infor-mation and Computer Sciences from Osaka University, Japan, in 1986, 1988, and 1993, respectively. In 1998, he joined Mita Industrial Co., Ltd.(currently, Kyocera Mita Corporation)as a Researcher. From 1996
to 2003, he was an Associate Professor in Osaka Prefecture College of Health Sciences. He moved to Faculty of Comprehensive Rehabilita-tion, Osaka Prefecture College of Nursing in April 2003. His research interests include design an performance evaluation of computer commu-nication networks, network reliability, and wireless network systems. He is a member of IEEE, ACM, IEICE and IPSJ.
DOO SEOP EOM received the B.S. and M.S. degrees in Electronics Engineering from Korea University, Seoul, Korea, in 1987 and 1989, respectively. In 1999, he received the Dr.E. degree in Information and Computer Science from Osaka University, Osaka, Japan. He joined the Communication Systems Division, Electronics and Telecommuni-cations Research Institute(ETRI), Korea, in 1989. From September
1999 to August 2000, he was an Associate Professor of Wonkwang University, Korea. From September 2000 to August 2002, he was an Assistant Professor in the School of Electrical Engineering, Korea Uni-versity, Seoul, Korea. Since September 2002, he has been an Associate Professor in the School of Electronics Engineering, Korea University, Seoul, Korea. His research interests include communication network design, wireless ATM, and Internet QoS.
MASAYUKIMURATAreceived the M.E. and D.E. degrees in Informa-tion and Computer Sciences from Osaka University, Japan, in 1984 and 1988, respectively. In April 1984, he joined Tokyo Research Labora-tory, IBM Japan, as a Researcher. From September 1987 to January 1989, he was an Assistant Professor with Computation Center, Osaka University. In February 1989, he moved to the Department of Infor-mation and Computer Sciences, Faculty of Engineering Science, Osaka University. From 1992 to 1999, he was an Associate Professor in the Graduate School of Engineering Science, Osaka University, and from April 1999, he has been a Professor at Osaka University. He moved to Graduate School of Information Science and Technology, Osaka University in April 2004. He has presented more than three hundred papers in international and domestic journals and conferences. His research interests include computer communication networks, perfor-mance modeling and evaluation. He is a member of IEEE, ACM, The Internet Society, IEICE and IPSJ.