Pathological mucus and impaired mucus
clearance in cystic fibrosis patients
result from increased concentration, not
altered pH
David B. Hill
1,2, Robert F. Long
2, William J. Kissner
2, Eyad Atieh
2,
Ian C. Garbarine
2, Matthew R. Markovetz
2, Nicholas C. Fontana
2,
Matthew Christy
2, Mehdi Habibpour
2, Robert Tarran
2,3, M. Gregory Forest
4,5,6,
Richard C. Boucher
2and Brian Button
2,6,7Affiliations:1Dept of Physics and Astronomy, The University of North Carolina at Chapel Hill, Chapel Hill, NC, USA.2Marsico Lung Institute/CF Center, The University of North Carolina at Chapel Hill, Chapel Hill, NC, USA. 3Dept of Cell Biology and Physiology, The University of North Carolina at Chapel Hill, Chapel Hill, NC, USA. 4Dept of Mathematics, The University of North Carolina at Chapel Hill, Chapel Hill, NC, USA.5Dept of Applied Physical Sciences, The University of North Carolina at Chapel Hill, Chapel Hill, NC, USA.6Dept of Biomedical Engineering, The University of North Carolina at Chapel Hill, Chapel Hill, NC, USA.7Dept of Biophysics and Biochemistry, The University of North Carolina at Chapel Hill, Chapel Hill, NC, USA.
Correspondence: David B. Hill, Dept of Physics and Astronomy, The University of North Carolina at Chapel Hill, 7109 Marsico Hall, 125 Mason Farms Drive, Chapel Hill, NC 27599, USA. E-mail: [email protected]
Over length scales greater than the mesh size of the mucin polymeric network of mucus, concentration, and not pH, dominates the physical properties of mucus that are associated with cystic fibrosis airways disease http://ow.ly/K92u30m2RDC
Cite this article as: HillDB,LongRF,KissnerWJ, et al.Pathologicalmucusandimpairedmucusclearance in cystic fibrosis patients result from increased concentration, not altered pH. Eur Respir J 2018; 52: 1801297[https://doi.org/10.1183/13993003.01297-2018].
ABSTRACT Cystic fibrosis (CF) is a recessive genetic disease that is characterised by airway mucus
plugging and reduced mucus clearance. There are currently alternative hypotheses that attempt to describe the abnormally viscous and elastic mucus that is a hallmark of CF airways disease, including: 1) loss of CF transmembrane regulator (CFTR)-dependent airway surface volume (water) secretion, producing mucus hyperconcentration-dependent increased viscosity, and 2) impaired bicarbonate secretion by CFTR, producing acidification of airway surfaces and increased mucus viscosity.
A series of experiments was conducted to determine the contributions of mucus concentration versus
pH to the rheological properties of airway mucus across length scales from the nanoscopic to macroscopic. For length scales greater than the nanoscopic,i.e.those relevant to mucociliary clearance, the effect of mucus concentration dominated over the effect of airway acidification.
Mucus hydration and chemical reduction of disulfide bonds that connect mucin monomers are more promising therapeutic approaches than alkalisation.
Thisarticlehassupplementarymaterialavailablefromerj.ersjournals.com
Introduction
Airway surface liquid (ASL) protects the lung from airborne environmental irritants and infections. The ASL consists of the periciliary layer (PCL) and mucus layer. The PCL is a grafted polymeric brush of tethered mucins and other high-molecular-weight glycoproteins that provides: 1) lubrication for ciliary beat and mucus layer transport, and 2) a size exclusion barrier [1]. The mucus layer is a viscoelastic fluid comprised of over 1000 different proteins [2], including two secreted mucins, MUC5B and MUC5AC [3], which give mucus its gel-like properties [3]. Collectively, the two layers of the ASL coordinate to trap and clear inhaled pathogens from the lungviamucociliary transport (MCT).
It is well established that cystic fibrosis (CF) airway mucus has abnormal rheological properties, including viscosities and elasticities orders of magnitude higher than normal mucus [1, 4–10]. There are currently alternative hypotheses that describe the genesis of the pathologically viscoelastic mucus in CF. One hypothesis predicts that impaired anion transport by the CF transmembrane regulator (CFTR), coupled to persistent sodium absorption, reduces airway surface ion content [5]. The reduction of sodium (Na+) and chloride (Cl−) ions on airway surfaces is coupled to reduced water flow to the airway lumen, dehydrating the ASL, concentrating the mucus layer, and producing abnormal mucus viscoelastic properties and osmotic pressures [1, 11]. A competing hypothesis posits that defective CFTR fails to transport bicarbonate (HCO3−) to the airway surface, acidifying the ASL. The resultant reduced mucus layer pH is
predicted to perturb the rheological properties of the mucus layer and impair clearance [12–14].
Mucus is a soft hydrogel composed of high-molecular-weight mucin polymers in an isotonic solvent. The concentration and molecular weight of mucins in the mucus layer define the average distance between adjacent mucin polymers in solution, i.e. the correlation length. The evidence that concentration profoundly affects airway mucus biophysical properties has emerged from recent measurements of mucus osmotic pressures and microbead rheology that employed probes with diameters between 200 nm and 2 µm [1, 8, 11, 15]. The evidence that pH has effects on CF mucus gel viscosity arose from fluorescence recovery after photobleaching (FRAP) mucus studies that employed probes <10 nm in diameter [13]. Due to the length scale-dependent rheological properties of mucus [16–18], it is impossible to compare mucus viscosity measurements directly with probes of differing size. The 5-nm nanoscopic probes employed in FRAP protocols [13] diffuse in the solvent space between mucin molecules, while the larger particles used in microbead rheology assays probe the polymeric mucin network. We hypothesised that the mucus macroscopic rheological properties would correlate better with MCT than nanoscopic measures.
Accordingly, studies were performed to measure the effects of mucus concentrationversuspH on mucus properties and transport at different length scales. Studies of the buffer capacity of mucus as a function of concentration were first performed (see supplementary material). Next, pH- and mucus concentration-dependent mucus viscosities were measured by FRAP. Biophysical measurements with length scales relevant to mucus gels, e.g. traditional microrheology and microbead rheology with particles larger than the mucus correlation lengths, were performed for comparison with FRAP measurements. Model porcine gastric mucin (PGM), bovine submaxillary mucin (BSM), and human bronchial epithelial (HBE) mucus from both normal and CF cultures were utilised for studies exploring: 1) pH ranges that exceeded those of normal and CF airway mucus, and 2) mucus concentrations that spanned normalversusCF mucus. The effects of changes in pH versus concentration on HBE MCT rates were directly compared. To test the relevance ofin vitromucus to disease samples, the concentrations, pHs and viscoelastic properties of CF sputum were measured and correlations analysed. Finally, the efficacy of three therapeutic strategies designed to restore mucus viscoelastic properties, e.g. mucus hydration, alkalisation and chemical reduction (i.e.mucolytics), were compared.
Methods
Results
Biophysical measurements
Fluorescence recovery after photobleaching
Biophysical measurements of complex fluids such as mucus must be tailored to the relevant biological questions (see supplementary material for more details). FRAP was measured using ∼5-nm dextran molecules in HBE mucus and CF sputum of varying concentrations to determine the nanoscopic, interstitial rheology of mucus (figure 1a). In both sample types, the diffusion of small molecules was linearly dependent on the concentration of the mucus gels at a constant pH of 7.2 (figure 1b). ANCOVA performed on the regression lines for τmucus/τsaline (which equates to the ratio of the viscosity of the sample divide by the viscosity of saline)versus% solids in HBE mucus and CF sputum revealed that each sample type exhibited significant ( p<0.01) and similar ( p=0.4, nonsignificant) correlations with mucus concentration (n=3 per concentration). These data indicate that HBE mucus is a reliable surrogate for the study of concentration-dependent FRAP-measured viscosity of CF sputum.
A second group of experiments examined the effect of pH on FRAP-measured viscosity in HBE mucus and CF sputum at a constant concentration. Little evidence for a carbon dioxide (CO2) tension-dependent
effect on FRAP-measured viscosity was observed in HBE mucus (n=14) (figure 1c). In raw CF sputum (9% solids), a trend towards an increase in FRAP recovery times ( proxy for increased viscosity on the nanometre length scale) was observed with acidification produced by 15% CO2( p=0.19; n=7) (figure 1d).
To distinguish whether the pH effect on FRAP reflected an effect of the solvent or the mucin polymer matrix, the sputum was filtered to remove the mucin polymer matrix (supplementary material). The filtered sputum supernatant exhibited a significant ( p=0.012; n=9) increase in FRAP recovery times at 15% CO2, similar in pattern to whole sputum (figure 1e). Thus, the 5-nm FRAP probe reported viscosity of
the solvent component of mucus, not of the polymeric gel. From the comparison of the composition of HBE mucus and CF sputum, our results indicate that inflammatory proteins generated in vivo in CF subjects, which are absent in HBE mucus [2], may be responsible for the observed pH-dependent changes in viscosity.
4 b) a)
3
2
1
0
τ
mucus
/
τ
saline
Concentration % solids 5
0 10 15
HBE mucus CF sputum
20
4 c)
3
2
1
0
τ
mucus
/
τ
saline
5% CO2 15% CO2
250 nm 1 µm
FRAP <5 nm
4 d)
3
2
1
0
τ
mucus
/
τ
saline
5% CO2 15% CO2
4 e)
3
2
1
0
τ
mucus
/
τ
saline
5% CO2 15% CO2 *
Microbead rheology
Microbead rheology is a well-established technique capable of probing length scales of polymer networks like mucus gels [18]. In PGM studies, a 2.5-fold increase in mucin concentration produced a 5-fold reduction in bead mean squared displacement (MSD) at 1 s at each designated pH (figure 2a). In contrast, changes in pH over a 100-fold range ( pH 6–8) produced only a modest (1.5-fold) effect on MSD at 1 s (figure 2a) at either mucin concentration. Parallel studies of the rheology of BSM showed similar results (figure 2b). Notably, HBE mucus exhibited the greatest dependence on concentration and the least on pH (figure 2c). The MSD of 1-μm beads embedded in normal HBE mucus exhibited a 10 times reduction in MSD in response to a 2.5-fold increase in concentration compared with a 1.5 times reduction in MSD in response to a 100-fold increase in proton concentration. A nearly identical result was observed in CF HBE mucus (figure 2d). Two-way ANOVA analysis of the MSD at 1 s revealed a highly significant relationship between microbead rheology with respect to concentration ( p<0.01 for all samples; n=3 per mucus type), while statistical significance was absent over the pH range investigated ( p>0.05).
Macroscopic rheology
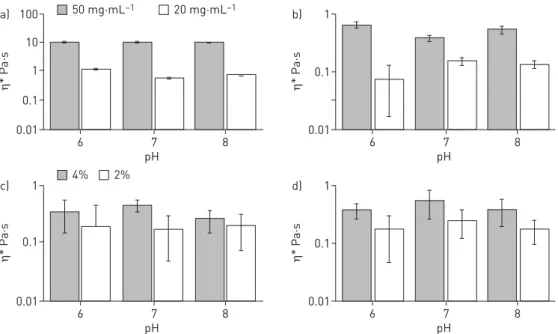
The macroscopic, or bulk, rheological properties of mucus are most often related to clearance of mucus from the lung [27–29]. Both concentration and pH have been shown to affect the rheological properties of mucus at these largest length scales [20, 30–32]. Figure 3 shows the relative effects of mucus concentration
versus pH on the complex viscosity of PGM, BSM and HBE mucus. PGM at 50 mg·mL−1 exhibited a viscosity that was >10-fold higher than at 20 mg·mL−1. In contrast, PGM at 20 mg·mL−1 exhibited a complex viscosity that did not vary systematically between pH 6 and 8 (figure 3a). BSM also exhibited large concentration-dependent viscosities,e.g.20versus50 mg·mL−1, with little pH dependence (figure 3b). With respect to airway mucus, the complex viscosity of 4% solids HBE mucus was 6- to 10-fold higher than 2% solids HBE mucus with again little systematic pH dependence (figure 3c). A similar pattern was also found in CF HBE mucus (figure 3d). Two-way ANOVA revealed that concentration significantly altered the macroscopic rheology of all mucus types ( p<0.05), while pH showed no effect ( p>>0.05; n=3 per mucus type, concentration and pH). Thus, the result across all mucus samples was that varying the concentration of mucus altered the complex viscosity dramatically, whereas variations in pH
10 20 mg·mL–1 pH 6 20 mg·mL–1 pH 7 20 mg·mL–1 pH 8 50 mg·mL–1 pH 6 50 mg·mL–1 pH 7 50 mg·mL–1 pH 8 a)
1
0.1
0.01
0.001
0.0001
MSD µm
2
Time s
0.01 0.1 1 10
10 b)
1
0.1
0.01
0.001
0.0001
MSD µm
2
Time s
0.01 0.1 1 10
0.1 10
10 c)
1
0.1
0.01
0.001
0.0001
MSD µm
2
Time s
0.01 0.1 1 10
10 d)
1
0.1
0.01
0.001
0.0001
MSD µm
2
Time s
0.01 1
2% pH 6 2% pH 7 2% pH 8 4% pH 6 4% pH 7 4% pH 8
did not. It is noteworthy that it is only at pH <5 that significant changes in the viscosity of 20 mg·mL−1 PGM mucus were observed, consistent with the previous findings of CELLI et al. [20] (supplementary
material).
Osmotic pressure and PCL height
The airway surface is lined by two apposing gel layers: 1) a mucus layer containing the secreted MUC5AC and MUC5B mucins, and 2) a brush-like PCL containing tethered mucin (e.g. MUC1, MUC4 and MUC16) and other glycoconjugates [1]. We have previously reported a HBE mucus concentration/osmotic pressure-dependent reduction in PCL height and MCT [24]. We selected a mucus concentration for study that produced a reduction in PCL height to test whether mucus osmotic pressure and PCL height reduction were modified by pH. Changing mucus pH over a range from pH 8 to 6 did not alter osmotic pressure of a concentrated (6.5% solids) mucus layer ( p⩾0.14 between each pH by paired t-test) (figure 4a). Consistent with the absence of a pH effect on osmotic pressure, PCL height was also not affected by varying pH over this range ( p⩾0.11 between each pH by paired t-test) (figure 4a). Note, PCL height with normal mucus concentrations is∼7 µm.
Mucociliary transport
MCT measures the integrated activities of cilia beat and mucus properties. Measurements of MCT in HBE cultures identified that the baseline rate of MCT in these cultures over the initial portion of the experiment was∼60 µm·s−1. A representative experiment demonstrated that increasing the concentration of CO2 from 5% to 15% in the luminal environment produced a decrease in the pH of the mucus layer
from 7.2 to 6.6 over 5 min (figure 4b). However, this reduction in pH did not produce a significant change in mucus transport velocity. In contrast, when the concentration of mucus was raised from 2.8% to 12.6% by removal of humidity from the environmental chamber, MCT ceased. The mean values for the effect of pH versus concentration on MCT (figure 4c) demonstrated, as with micro- and macrorheology measurements, mucus concentration ( p<<0.05), not pH ( p>>0.05; n=4–12), dominated MCT rates.
Relationships between mucus concentration, pH and viscoelastic properties in CF sputum
The concentration, pH and rheology of 11 CF sputum samples were measured (table 1). The average concentration of these samples was 5.6±2.5%, the average pH was 7.1±0.42 and the average complex viscosity was 2.5±1.5 Pa·s. A significant correlation was observed between concentration and complex
100 a)
10
1
0.1
0.01
η
* P
a·s
pH
6 7 8
1 b)
0.1
0.01
η
* P
a·s
pH
6 7 8
1 c)
0.1
0.01
η
* P
a·s
pH
6 7 8
1 d)
0.1
0.01
η
* P
a·s
pH
6 7 8
50 mg·mL–1 20 mg·mL–1
4% 2%
viscosity (p=0.006) (figure 5a). In contrast, no correlation was observed between pH and complex viscosity ( p=0.42) (figure 5b). Thus, our data from cultured normal and CF HBE mucus appear to predict data from CF sputum.
Testing therapeutic strategies to normalise CF sputum viscoelastic properties
To generate sufficient material for systematic studies of therapeutic agents, four sputum samples were pooled and homogenised in the presence of protease inhibitors to blunt proteolysis. This pooled stock was similar in concentration, pH and rheology to the sample group as a whole (supplementary material). The concentration of the pooled samples (5.2%) mimicked the average concentration of all CF sputum samples (5.6%). Aliquots of the pooled sputum were hydrated to 2.6% to mimic the effect of a mucus hydrator [33, 34], and then aliquots of sputum at both 2.6% and 5.2% concentrations were adjusted to pH 6, 7 and 8 to test the effects of modulating pH on CF sputum.
Diluting (hydrating) mucus by a factor of 2 from 5.2% to 2.6% decreased the complex viscosity by a factor of 8. In contrast, the effects of a 100-fold range in pH were small,i.e.∼2-fold change in complex viscosity (figure 5c). Importantly, increasing the pH of 5.2% CF sputum from pH 6 to 8 resulted in a complex viscosity greater than the most acidic 2.6% concentration sputum sample (figure 5c). Thus, therapies directed at hydration will likely produce more favourable changes in CF sputum viscosity than modulation of pH.
Finally, the effect of reduction of mucin disulfide bonds was tested. We chose to reduce mucus with dithiothreitol (DTT) rather than DNase as it has previously been shown to have a greater effect on sputum rheology [35]. Normal HBE mucus was prepared to 5% solids to mimic CF sputum and reduced with 1 and 10 mM DTTversusPBS control. These data (figure 5d) showed that reduction of the disulfide bonds that link mucin monomers into polymeric macromolecules had a greater effect on the rheological
1000 a)
7 6 5 4 3 2 1 0 900
800
700
600
Osmotic pr
es
sur
e
Pa
PCL height µm
6
pH 7
Osmotic pressure PCL height
8 9
100 c)
10
1
0.1
MC
T µm·s
–1
6.5
pH 7.0
12.6% 2.8%
7.5 8.0
80 pH 7.2 pH 6.6 Dehydrate b)
60
40
20
0
MC
T µm·s
–1
0
Time min
10 20 30
FIGURE 4Effect of pH on osmotic pressure, periciliary layer (PCL) height and mucociliary transport (MCT).a)Effect of pH on mucus osmotic pressure and PCL height of 6.5% solids mucus on human bronchial epithelial cell culture. Note that the PCL height is normally∼7 µm with a normal 2% solids (100 Pa) mucus layer apposed to it.b) Example trace of the effects of acidification (5% CO2, pH 7.2 to 15% CO2, pH 6.6) compared with changes in mucus concentration (by dehumidification) on MCT rate during a single experiment.c)Summary of the MCT rates comparing changes in concentration: 2.8% or 12.6% solidsversuspH 6.6, 7.2 and 7.9.
TABLE 1Demographics of cystic fibrosis patients from whom the 11 sputum samples were obtained
Patients 11
Sex
Male 4
Female 7
Ethnicity
Caucasian 10
African-American 1
Age years 28.5±9.6 (18–46)
FEV1% pred 48.8±22.0 (24–90)
FVC L 2.7±1.0 (1.7–4.3)
FEF25–75%L·s−1 0.96±0.82 (0.3–2.7)
pH 7.1±0.42 (6.3–7.7)
Mucus concentration % solids 5.6±2.5 (2.3–10.6)
Complex viscosityη* Pa·s 2.5±1.5 (0.65–4.5)
properties of mucus than pH, i.e. exhibiting an effect similar to reducing concentration. This result was mimicked by the reduction of 5% pooled CF sputum with 10 mM DTT (figure 5e).
Discussion
CF airways disease is characterised by highly viscous airway mucus that leads to mucus stasis, inflammation, chronic infection and damage to airway walls. To test the current hypotheses that may account for the increased viscosity of CF mucus,i.e. mucus acidification [13]versusconcentration [1, 8, 11, 15], the relative effects of each variable were measured in model mucus systems (PGM and BSM), both normal and CF HBE mucus, and CF sputum.
The pH ranges observed in human airway mucus [36, 37] are much narrower than in mucus in other organs that are typically studied to describe pH effects on mucus properties,e.g. the endocervix [32] or stomach [20]. The pH range of normal human airway mucus is pH∼7.0–7.2. It is not clear how much lower the pH of mucus in CF airways may be. CF airway epithelial cultures and CF animal models exhibit a pH that may be∼0.4 lower than normal airway mucus,i.e. ∼pH 6.8 [36, 38]. The lowest pH reported for CF airway mucus emanated from studies of pH of mucopurulent material contained in excised CF lungs and was pH 6.6 [37]. However, recentin vivodata have described little difference in large airway pH in CFversusnormal neonates [39]. Our strategy to address all possible CF mucus pHversusconcentration scenarios was to develop protocols that spanned: 1) pH ranges relevant to both CF ( pH 6–8) and mucus from other organs ( pH 4–8), and 2) mucus concentrations from normal (2% solids) and CF subjects (>5% solids) [11].
The mucus gel is composed of high-molecular-weight mucin polymers dissolved in an ASL solvent. In the concentrations reported for normal and diseased mucus, the mucin polymers are in “overlap” concentrations, meaning the mucin polymers interpenetrate. Mucin polymers in overlap conditions typically exhibit viscoelastic properties (e.g. viscosity, elasticity [40]) that scale geometrically with
10 c)
1
0.1
0.01
0.001
η
* P
a·s
pH
6 7 8
10 d)
1
0.1
0.01
0.001
η
* P
a·s
DTT mM
0 1 10
1 e)
0.1
0.01
0.001
η
* P
a·s
DTT mM
0 10
b)
η
* P
a·s
pH 7
6
2 3 4 5
1
0
0 3 6 9 12
7 a)
6
2 3 4 5
1
0
η
* P
a·s
Concentration % solids
6.0 6.5 7.0 7.5 8.0
2.6% CF sputum 5.2% CF sputum
concentration. The correlation lengthξ,i.e.mesh size produced by interpenetrating mucins, also scales to a higher-order power of concentration (ξ∼kT/[concentration]3) and has been reported to be∼100–500 nm in normal mucus [15, 41]. The ASL solvent for mucus gels on airway surfaces has been characterised as an isotonic liquid [42, 43].
The smallest nanoscopic rheological length scales of mucus scale to its solvent, which can be explored by FRAP. Recent FRAP studies by TANGet al. [13], employing FITC-labelled 70-kDa dextran (radius of gyration 6.6 nm [44]), demonstrated modest pH-dependent changes in the diffusion of these small molecules in mucus. Our experiments with CF sputum, but not HBE mucus, are in agreement with the FRAP data obtained by TANG et al. [13] in isolated CF piglet mucus (figures 3 and 5). We
interpret these data as indicating that the low-molecular-weight ( potentially inflammatory) proteins dissolved in the isotonic mucus solvent generated pH-dependent changes in viscosity that exceeded that of water. Notably, the FRAP viscosity values measured in this study (0.001–0.003 Pa·s) and those of TANGet al.[13] were orders of magnitude lower than the viscosity values of mucus (0.1–10 Pa·s) as
measured by macrorheology (see following paragraph and figure 3). The disparity in FRAP versus
macrorheology measurements, coupled with the mucin matrix–solvent separation studies (figure 2b), indicates that the small-molecule FITC-labelled dextrans utilised in FRAP studies measured the pH-sensitive properties of the low-viscosity mucus solvent and not the mucin structure/function that dominates mucus clearance.
Microrheology protocols were performed with 1-µm beads, which probe mucus at length scales relevant to the mucin mesh. Our microrheology studies of both PGM and BSM mucus showed a strong (geometric) dependence of mucus complex viscosity on mucus concentration. In contrast, pH effects on PGM complex viscosity were much smaller and only significant at pH <5 (supplementary material). These findings are in agreement with the data of WANGet al.[32] in MUC5B-dominated endocervical mucus. Importantly, the
effects of pH on HBE mucus complex viscosity over pH ranges that span those of airway mucus in health or disease (i.e. pH 6–8) were minimal compared with the effects of concentration on mucus harvested from both normal and CF cultures.
Conventional cone-and-plate studies probe mucus rheology at macroscopic length scales. With this approach, similar directional and quantitative data were observed as for microrheology (figure 3),i.e.pH had little effect on complex viscosity over airway pH-relevant ranges. In contrast, strong concentration-dependent relationships were observed, consistent with data of GEORGIADES et al. [31]. Although it has typically been difficult to reconcile findings probing mucus rheological properties at different length scales, our findings at all length scales are consistent with mucus concentration, not pH, dominating mucus mesh-dependent rheological properties relevant to MCT.
Studies of CF sputum were performed for comparison with our mucus model systems. In raw sputum from CF patients, like our model systems, a strong correlation between mucus concentration ( p<0.05), but not pH ( p>0.3), and rheology was observed (figure 5a and b).
The water-drawing power of a polymer gel is described by its osmotic pressure. As with rheological properties, osmotic pressures of polymer gels scale to higher-order powers of polymer (mucus) concentration. Under normal conditions, the PCL is the more concentrated gel and is fully hydrated, permitting the cilia to beat in a well-lubricated PCL environment. However, our data have shown that even minor osmotic compression of the PCL by a modestly hyperconcentrated mucus layer (i.e.4–5% solids) produces sufficient compression of the cilia to slow mucus transport. Data presented in figure 4a demonstrate that altering the pH across acidicversusalkaline ranges did not affect the osmotic properties of the concentrated mucus layer. In contrast, modest mucus hyperconcentration produced the predicted modest PCL compression (figure 4a).
To directly compare the effects of pHversusconcentration on MCT rates, the effects of mucus pH versus
concentration on MCT were measured in HBE cultures (figure 4b and c). Consistent with the micro- and macrorheology, MCT was governed by mucus concentration and not pH. These findings are consistent with previous reports that showed MCT is dependent on mucus concentration, with MCT slowing at 4–5% solids and ceasing at 8–10% solids [24, 45].
The importance of concentration for the biophysical properties of mucus is rooted in the polymeric nature of the mucin macromolecules that are the key gel-forming molecules in mucus. Increasing the concentration of mucus and mucins in disease states [8, 11, 24] geometrically alters the viscoelastic and osmotic properties of mucus [40], leading to a collapsed PCL [1], decreased mucociliary clearance [24], reduced neutrophil penetration and bacteria killing [45], biofilm formation [15], and decreased pulmonary function [24, 41, 46]. Collectively, increased mucus concentration can generate much of the muco-obstructive pathophysiology typical of CF [8, 11, 24, 41].
The role of pH in airway disease states is less clear, with studies differing on the magnitude of the change in pH across nasal models [47], newborn piglets [13], human cell cultures [36, 38, 39] and early in CF patients in vivo [39]. Our data strongly argue that pH has little effect on the biophysical properties of mucus relevant to basal mucus transport. It is possible that there is a role for acidification in bacterial killing [48] that may add to failed mucus clearance in CF disease pathogenesis. We speculate, though, that pathophysiologically relevant CF defects in airway pH regulation may be more important during gastric aspiration. After aspiration, the pH of the airway surface is acutely acidified and takes longer to return to baseline in CF than normal cultures [38]. Previous macro- and microscopic rheology studies found that a reduction to pH 1–3 was required to produce the magnitude of mucus rheological abnormalities produced by CF-relevant increases in mucus concentration [20, 30–32]. Thus, gastric aspiration may be combined with increased mucus concentration to trigger early CF events and/or spread of CF lung disease.
Conclusions
Over the micrometre to millimetre length scales that probe the micro- and macrorheological properties of mucin structure, mucus concentration, not pH, governed the biophysical properties of mucus important for clearance from the lung. In contrast, FRAP studies that probe the solvent properties of the gel are not relevant to the mucus mesh. Data from the larger length scale biophysical assays, but not FRAP, were congruent with data from HBE MCT assays that also demonstrated the dominance of concentration in controlling MCT. Mucus pH may have effects on antimicrobial killing in the CF lung. However, our findings indicate that therapies designed to restore transport properties of mucus should focus on reducing mucus concentration and/or mucolytic reduction rather than raising pH.
Acknowledgements: The authors wish to thank Erik Perou, Matthew Combs and Jessica Malachowski (all at The University of North Carolina at Chapel Hill, Chapel Hill, NC, USA) for their experimental efforts on this project. The authors would also like to thank Scott Randell and the UNC Tissue Core (The University of North Carolina at Chapel Hill) for HBE cells, and Eric Roe (The University of North Carolina at Chapel Hill) for editorial assistance.
Author contributions: D.B. Hill and B. Button conceived the experiments. D.B. Hill, R.F. Long, R. Tarran, M.G. Forest and B. Button designed the experiments, which were carried out by D.B. Hill, R.F. Long, E. Atieh, I.C. Garbarine, M. Habibpour, N.C. Fontana, W.J. Kissner, M. Christy and B. Button. Data interpretation was performed by D.B. Hill, R.F. Long, M.R. Markovetz, M.G. Forest, R.C. Boucher and B. Button. The manuscript was primarily written by D.B. Hill, R.C. Boucher and B. Button. All authors provided critical feedback that helped shape the manuscript.
Conflict of interest: D.B. Hill reports grants from Cystic Fibrosis Foundation, National Science Foundation and National Institutes of Health, during the conduct of the study. R.F. Long has nothing to disclose. W.J. Kissner reports grants from NIH National Institute of Diabetes, Digestive, and Kidney Diseases (federal), National Science Foundation (federal), KNOW Bio, LLC (business and industry), NIH National Heart, Lung, and Blood Institute (federal), Cystic Fibrosis Foundation (foundation) and Cystic Fibrosis Foundation Therapeutics (foundation), during the conduct of the study. E. Atieh has nothing to disclose. I.C. Garbarine reports grants from Cystic Fibrosis Foundation, during the conduct of the study. M.R. Markovetz has nothing to disclose. N.C. Fontana has nothing to disclose. M. Christy has nothing to disclose. M. Habibpour has nothing to disclose. R. Tarran has nothing to disclose. M.G. Forest has nothing to disclose. R.C. Boucher is chairman of the board of Parion Sciences, a privately held UNC spin-out company focused on developing therapies for CF, and has equity in the company and received monetary compensation as board chair. B. Button has nothing to disclose.
Support statement: This work was funding by the National Science Foundation (DMS 1462992), the National Institutes of Health (R01HL125280, 5P30DK065988 and 4P50HL120100) and the Cystic Fibrosis Foundation (Hill16XX0, Ramsey16I0, Bouche15R0 and Button07XX0). Funding information for this article has been deposited with the Crossref Funder Registry.
References
1 Button B, Cai LH, Ehre C,et al.A periciliary brush promotes the lung health by separating the mucus layer from airway epithelia.Science2012; 337: 937–941.
2 Kesimer M, Kirkham S, Pickles RJ,et al. Tracheobronchial air-liquid interface cell culture: a model for innate mucosal defense of the upper airways?Am J Physiol Lung Cell Mol Physiol2009; 296: L92–L100.
3 Thornton DJ, Rousseau K, McGuckin MA. Structure and function of the polymeric mucins in airways mucus.
Annu Rev Physiol2008; 70: 459–486.
5 Boucher RC. New concepts of the pathogenesis of cystic fibrosis lung disease.Eur Respir J2004; 23: 146–158. 6 Dawson M, Wirtz D, Hanes J. Enhanced viscoelasticity of human cystic fibrotic sputum correlates with increasing
microheterogeneity in particle transport.J Biol Chem2003; 278: 50393–50401.
7 Hill DB, Button B. Establishment of respiratory air–liquid interface cultures and their use in studying mucin production, secretion, and function.Methods Mol Biol2012; 842: 245–258.
8 Hill DB, Vasquez PA, Mellnik J, et al. A biophysical basis for mucus solids concentration as a candidate biomarker for airways disease.PLoS One2014; 9: e87681.
9 Rubin BK. Mucus structure and properties in cystic fibrosis.Paediatr Respir Rev2007; 8: 4–7.
10 Williams HD, Behrends V, Bundy JG,et al.Hypertonic saline therapy in cystic fibrosis: do population shifts caused by the osmotic sensitivity of infecting bacteria explain the effectiveness of this treatment?Front Microbiol
2010; 1: 120.
11 Henderson AG, Ehre C, Button B,et al.Cystic fibrosis airway secretions exhibit mucin hyperconcentration and increased osmotic pressure.J Clin Invest2014; 124: 3047–3060.
12 Birket SE, Davis JM, Fernandez CM,et al.Development of an airway mucus defect in the cystic fibrosis rat.JCI Insight2018; 3: e97199.
13 Tang XX, Ostedgaard LS, Hoegger MJ,et al.Acidic pH increases airway surface liquid viscosity in cystic fibrosis.
J Clin Invest2016; 126: 879–891.
14 Fischer H, Widdicombe JH. Mechanisms of acid and base secretion by the airway epithelium.J Membr Biol2006; 211: 139–150.
15 Matsui H, Wagner VE, Hill DB,et al.A physical linkage between cystic fibrosis airway surface dehydration and
Pseudomonas aeruginosabiofilms.Proc Natl Acad Sci USA2006; 103: 18131–18136.
16 Witten J, Ribbeck K. The particle in the spider’s web: transport through biological hydrogels.Nanoscale2017; 9: 8080–8095.
17 Newby JM, Seim I, Lysy M,et al.Technological strategies to estimate and control diffusive passage times through the mucus barrier in mucosal drug delivery.Adv Drug Deliv Rev2018; 124: 64–81.
18 Lai SK, Wang YY, Wirtz D,et al.Micro- and macrorheology of mucus.Adv Drug Deliv Rev2009; 61: 86–100. 19 Fulcher ML, Randell SH. Human nasal and tracheo-bronchial respiratory epithelial cell culture.Methods Mol Biol
2013; 945: 109–121.
20 Celli JP, Turner BS, Afdhal NH,et al. Rheology of gastric mucin exhibits a pH-dependent sol–gel transition.
Biomacromolecules2007; 8: 1580–1586.
21 Holma B. Influence of buffer capacity and pH-dependent rheological properties of respiratory mucus on health effects due to acidic pollution.Sci Total Environ1985; 41: 101–123.
22 Holma B, Hegg PO. pH- and protein-dependent buffer capacity and viscosity of respiratory mucus. Their interrelationships and influence on health.Sci Total Environ1989; 84: 71–82.
23 Kim D, Liao J, Hanrahan JW. The buffer capacity of airway epithelial secretions.Front Physiol2014; 5: 188. 24 Anderson WH, Coakley RD, Button B,et al.The relationship of mucus concentration (hydration) to mucus
osmotic pressure and transport in chronic bronchitis.Am J Respir Crit Care Med2015; 192: 182–190.
25 Seagrave J, Albrecht HH, Hill DB,et al.Effects of guaifenesin,N-acetylcysteine, and ambroxol on MUC5AC and mucociliary transport in primary differentiated human tracheal-bronchial cells.Respir Res2012; 13: 98.
26 Button B, Okada SF, Frederick CB,et al. Mechanosensitive ATP release maintains proper mucus hydration of airways.Sci Signal2013; 6: ra46.
27 Shih CK, Litt M, Khan MA,et al. Effect of nondialyzable solids concentration and viscoelasticity on ciliary transport of tracheal mucus.Am Rev Respir Dis1977; 115: 989–995.
28 Winet H. The role of the periciliary fluid in mucociliary flows: flow velocity profiles in frog palate mucus.
Biorheology1987; 24: 635–642.
29 Winet H, Yates GT, Wu TY,et al.On the mechanics of mucociliary flows. III. Flow-velocity profiles in frog palate mucus.J Appl Physiol1984; 56: 785–794.
30 Wagner CE, Turner BS, Rubinstein M,et al.A rheological study of the association and dynamics of MUC5AC gels.Biomacromolecules2017; 18: 3654–3664.
31 Georgiades P, Pudney PD, Thornton DJ,et al.Particle tracking microrheology of purified gastrointestinal mucins.
Biopolymers2014; 101: 366–377.
32 Wang YY, Lai SK, Ensign LM,et al.The microstructure and bulk rheology of human cervicovaginal mucus are remarkably resistant to changes in pH.Biomacromolecules2013; 14: 4429–4435.
33 Goralski JL, Wu D, Thelin WR,et al. Thein vitro effect of nebulised hypertonic saline on human bronchial epithelium.Eur Respir J2018; 51: 1702652.
34 Donaldson SH. Hydrator therapies for cystic fibrosis lung disease.Pediatr Pulmonol2008; 43: S18–S23.
35 Horsley A, Rousseau K, Ridley C, et al. Reassessment of the importance of mucins in determining sputum properties in cystic fibrosis.J Cyst Fibros2014; 13: 260–266.
36 Coakley RD, Boucher RC. Regulation and functional significance of airway surface liquid pH.JOP2001; 2: Suppl., 294–300.
37 Garland AL, Walton WG, Coakley RD,et al.Molecular basis for pH-dependent mucosal dehydration in cystic fibrosis airways.Proc Natl Acad Sci USA2013; 110: 15973–15978.
38 Coakley RD, Grubb BR, Paradiso AM,et al.Abnormal surface liquid pH regulation by cultured cystic fibrosis bronchial epithelium.Proc Natl Acad Sci USA2003; 100: 16083–16088.
39 Schultz A, Puvvadi R, Borisov SM,et al.Airway surface liquid pH is not acidic in children with cystic fibrosis.Nat Commun2017; 8: 1409.
40 Rubinstein M, Colby RH. Polymer Physics. Oxford, Oxford University Press, 2003.
41 Duncan GA, Jung J, Joseph A,et al. Microstructural alterations of sputum in cystic fibrosis lung disease.JCI Insight2016; 1: e88198.
42 Matsui H, Davis CW, Tarran R,et al.Osmotic water permeabilities of cultured, well-differentiated normal and cystic fibrosis airway epithelia.J Clin Invest2000; 105: 1419–1427.
44 Armstrong J, Wenby R, Meiselman H,et al.The hydrodynamic radii of macromolecules and their effect on red blood cell aggregation.Biophys J2004; 87: 4259–4270.
45 Matsui H, Verghese MW, Kesimer M,et al. Reduced three-dimensional motility in dehydrated airway mucus prevents neutrophil capture and killing bacteria on airway epithelial surfaces.J Immunol2005; 175: 1090–1099. 46 Ma JT, Tang C, Kang L,et al.Cystic fibrosis sputum rheology correlates with both acute and longitudinal changes
in lung function.Chest2018; 154: 370–377.
47 Song Y, Salinas D, Nielson DW, et al.Hyperacidity of secreted fluid from submucosal glands in early cystic fibrosis.Am J Physiol Cell Physiol2006; 290: C741–C749.