The ONE Simulator for DTN Protocol Evaluation
Ari Keränen, Jörg Ott, Teemu Kärkkäinen
Helsinki University of Technology (TKK) Department of Communications and Networking
{
akeranen,jo,teemuk
}@netlab.tkk.fi
ABSTRACT
Delay-tolerant Networking (DTN) enables communication in sparse mobile ad-hoc networks and other challenged environments where traditional networking fails and new routing and application pro-tocols are required. Past experience with DTN routing and appli-cation protocols has shown that their performance is highly depen-dent on the underlying mobility and node characteristics. Evalu-ating DTN protocols across many scenarios requires suitable sim-ulation tools. This paper presents the Opportunistic Networking Environment (ONE) simulator specifically designed for evaluat-ing DTN routevaluat-ing and application protocols. It allows users to cre-ate scenarios based upon different synthetic movement models and real-world traces and offers a framework for implementing routing and application protocols (already including six well-known rout-ing protocols). Interactive visualization and post-processrout-ing tools support evaluating experiments and an emulation mode allows the ONE simulator to become part of a real-world DTN testbed. We show sample simulations to demonstrate the simulator’s flexible support for DTN protocol evaluation.
Categories and Subject Descriptors
C.2.2 [Computer Communication Networks]: Network Proto-cols; I.6.7 [Simulation and Modeling]: Simulation Support Sys-tems
General Terms
Performance, Experimentation
Keywords
Delay-tolerant Networking, Simulations, Routing
1.
INTRODUCTION
Personal communication devices, such as cellular phones, have enabled voice and data communications to mobile users, achieving global connectivity via infrastructure networks (cellular, WLAN). Local connectivity among the devices may additionally be obtained
Permission to make digital or hard copies of all or part of this work for personal or classroom use is granted without fee provided that copies are not made or distributed for profit or commercial advantage and that copies bear this notice and the full citation on the first page. To copy otherwise, to republish, to post on servers or to redistribute to lists, requires prior specific permission and/or a fee.
SIMUTools 2009,Rome, Italy.
Copyright 2009 ICST ISBN 978-963-9799-45-5.
by forming ad-hoc networks since the mobile devices are virtually always turned on and have the necessary radio interfaces, process-ing power, storage capacity, and battery lifetime to act as routers. However, such usually sparse ad-hoc networks generally cannot support the type of end-to-end connectivity required by the classic TCP/IP-based communications due to frequent topology changes, disruptions, and network partitions caused by the node movement. Instead, asynchronous message passing (also referred to as store-carry-forwardnetworking) has been suggested to enable commu-nication over the space-time paths that exist in these types of net-works (e.g., Delay-tolerant Networking, DTN [10], Haggle [24]).
The performance of suchopportunistic networksmay vary sig-nificantly, depending on how the mobile nodes move, how dense the node population is, and how far apart the sender and the receiver are. Delivery latency may vary from a few minutes to hours or days, and a significant fraction of the messages may not be delivered at all. The key factors are the routing and forwarding algorithms used and how well their design assumptions match the actual mobility patterns. No ideal routing scheme has been found so far.
Simulations play an important role in analyzing the behavior of DTN routing and application protocols. With typically sparsely distributed nodes, DTN simulations abstract from the details of the wireless link characteristics and simply assume that two nodes can communicate when they are in range of one another. This allows focusing on the evaluation of the DTN protocols—an approach we follow in this paper. Instead of fully modeling the lower layers we make simplifying assumptions about the data rates, the radio ranges, and thus the resulting transfer volumes.
In sparse node populations, the space-time paths, which are ex-ploited by the store-carry-forward communications, are composed of the encounters between the nodes. The frequency, duration, and other characteristics of these encounters are largely dependent on the underlying mobility patterns. Evaluations of DTN protocols have used a large variety of synthetic mobility models as well as real-world mobility traces (which we review in section 2). While synthetically generated node mobility allows for fine-tuning in many respects, this usually covers only limited mobility characteristics. In contrast, real-world traces often have only coarse temporal (e.g., scanning intervals in the order of several minutes) or spatial reso-lution (e.g., location determined from WLAN access point attach-ment) and coverage (e.g., only covering a campus area) and may exhibit biases due to the user group chosen for sampling.
All these approaches may provide complementary data points when assessing the performance of DTN protocols. What is im-portant is that protocols are evaluated under different settings and that these settings can be fine-tuned to match the intended applica-tion scenario(s) as closely as possible. In this paper, we present the
Java-based tool offering a broad set of DTN protocol simulation capa-bilities in a single framework, designed based upon our experience from analyzing numerous DTN routing and application protocols.1 Our contributions are twofold: 1) The ONE simulator offers an ex-tensible simulation framework itself supporting mobility and event generation, message exchange, DTN routing and application proto-cols, a basic notion of energy consumption, visualization and anal-ysis, interfaces for importing and exporting mobility traces, events, and entire messages. 2) Using this framework, we implemented an extensive set of ready-to-use modules: six synthetic mobility models that can be parameterized and combined to approximate real-world mobility scenarios, six configurable well-known DTN routing schemes, a set of base primitives to design application pro-tocols, a basic battery and energy consumption model, several in-put/output filters for interacting with other simulators, and a mech-anism for the integration with real-world testbeds. The ONE simu-lator is designed in a modular fashion, allowing extensions of virtu-ally all functions to be implemented using well-defined interfaces.
This paper is structured as follows: In section 2, we review re-lated work on DTNs and (rere-lated) simulations for mobility. We introduce the architecture and different features of the ONE simu-lator in depth in section 3 and describe how ONE is used in emu-lation setups in section 4. We show example simuemu-lation results and comment on the simulator’s performance in section 5. Section 6 concludes this paper with a summary and points out future work.
2.
RELATED WORK
In this paper, we focus on communication performance in delay-tolerant ad-hoc networks comprising mobile nodes. Delay-delay-tolerant Networking [10] is increasingly applied to enable communication in challenging networking environments, including sparse sensor-nets and opportunistic mobile ad-hoc networks. The DTNRG ar-chitecture [5] proposes abundlelayer as an overlay to bridge dif-ferent (inter)networks. Nodes communicate via asynchronous mes-sages of arbitrary size that are exchanged using the store-carry-and-forward paradigm. Messages have a finite TTL and are discarded when the TTL expires. They may also get dropped by a node due to congestion, yielding a best-effort service. Application protocols need to tolerate the delays resulting from the challenged environ-ment and the risk that messages are not delivered in time or not at all. Typical performance metrics for evaluating DTN protocol performance are hence message delivery probability and latency.
Numerous routing and forwarding schemes have been proposed over the past years (refer to [32] and [21] for overviews). Different mechanisms are usually applied depending on whether the network is primarily of mobile ad-hoc nature (e.g., mobile devices carried by humans) or is based upon a (fixed or mobile) infrastructure (e.g., space networks, bus networks). Obviously, mixed networks exist as well (e.g., mobile users supported by infrastructure nodes).
The primary difference between various DTN routing protocols is the amount of information they have available to make forward-ing decisions [13]. Ad-hoc DTNs usually apply variants of reactive protocols. Flooding protocols such as epidemic routing [30] do not use any information. Predictive protocols such as PRoPHET [19] use past encounters of nodes to predict their future suitability to deliver messages to a certain target whereas other protocols also exploit further (explicitly configured) schedule and context infor-mation per node [18]. Furthermore, they differ in theirreplication strategies, i.e., how many copies of a message they create which, in turn, has a direct impact on the load incurred on the network. Some protocols generate just a single copy [27] (e.g., First Contact
1
This paper is based upon and extends our technical report [17].
[13], Direct Transmission/Delivery [27]), others a fixed number limited by the sender [28] [26] while epidemic [30] and probabilis-tic [19] routing potentially create an “infinite” number of messages. Scheduling strategies govern in which order messages are passed when a communication opportunity occurs between two nodes. Fi-nally, queue management strategies define when and which mes-sages are deleted, e.g., if congestion occurs.
For evaluating the performance of DTN routing protocols, man-ifold settings have been used, mostly including some type of node mobility. Mobility has been created (a) from synthetic mobility models, (b) taken from traces obtained from real-world measure-ments, and (c) by evaluating code in the real-world. While a few testbeds for (c) exist (such as DieselNet [3]) their flexibility is usu-ally limited, large-scale operation “expensive”, and their use is typ-ically limited to those running the testbed. Such testbeds may also be used to obtain real-world traces (b) which can then be made available to other researchers.
Various projects have collected traces of contacts (peers, times, durations, and possibly positions) between Bluetooth devices [11], between users and/or wireless access points [8], among others. The CRAWDAD project2provides a repository where numerous
real-world traces are available.3 These traces offer insights into real-world interactions between mobile users from different angles and constitute a valuable data source for validating the mobility and connectivity characteristics obtained from synthetic models.
But also real-world traces have their limitations as—so far—the population analyzed in these traces is naturally very limited and may thus bias the results. Furthermore, the time granularity is of-ten limited in order not to drain mobile device batteries too quickly: e.g., the Haggle iMotes uses sensing intervals of 5 min so that many contact opportunities may easily go undetected and contact dura-tions can only be assessed equally coarsely. While this can be seen to reflect energy constraints, the scanning interval cannot be ad-justed afterwards. Finally, the results cannot be arbitrarily scaled, thus limiting what can be evaluated.
The only option for flexible and scalable simulations is thus (a) model-based synthetic mobility generation.4Mobility models range
from simple entity models such asRandom Waypointto complex ones such as Random Trip[2] to group mobility to community models with major points of interest [4] to vehicular ones taking street maps into account (e.g., [6]). Node velocity and pause times may be adjusted to match pedestrians, vehicles, or other node types and smooth turns, acceleration and deceleration may be added to obtain more realistic behavior [1]. Specific models for vehicular networking furthermore consider additional constraints from sim-ple road setups to real-world maps on one hand and simsim-ple non-interfering vehicles to vehicular interaction (distance, speed) based upon traffic flow models on the other. Approximations for foot-path construction in and around buildings are used to make motion more realistic and transmission range and performance is adapted to model walls between mobile nodes [14].
In other areas (e.g., for epidemic spreading studies or traffic plan-ning), more complex simulation models have been created mimick-ing the behavior of the population of an entire city [20]. Dependmimick-ing on the precise setting, the latter may not have the proper focus for evaluating ad-hoc interpersonal communications: TRANSIMS, for example, allows modeling a population and their interactionat cer-tain locations orinvehicles, but does not include details on the way
betweensuch locations, which limits the suitability of the generated
2http://crawdad.cs.dartmouth.edu/ 3
The DieselNet traces are available at http://traces.cs.umass.edu.
4
mobility data of pedestrians. In the case of TRANSIMS, detailed vehicle information could be made available and has been used for investigating MANET protocols [20].
Mobility generators for simple models are available for ns-2 and ns-3, as part of their respective toolsets or as specific extensions (e.g., [2]); both ns-2 and ns-3 accept suitably converted traces as input.5The latter also holds for various openly available DTN sim-ulators (dtnsim[13] anddtnsim26) and numerous ones tailored to
specific research needs, based upon OMNet++, OPNET, or entirely newly developed7, all of which have rather limited support for DTN routing protocols readily available. While ns-2 (and now ns-3) and OMNet++ offer sound generic open simulation platforms for packet-based communications and tools such as JANE [7] provide specific support for MANETs, generic support for DTN simulation is overall fairly limited. The ONE simulator contributes an environ-ment for DTN protocol evaluation, embedding internal and external mobility models, different DTN routing schemes, and interactive inspection (similar tonsnamfor ns-2) as well as post-processing.
3.
THE ONE SIMULATOR
At its core, ONE is an agent-based discrete event simulation en-gine. At each simulation step the engine updates a number of mod-ules that implement the main simulation functions.
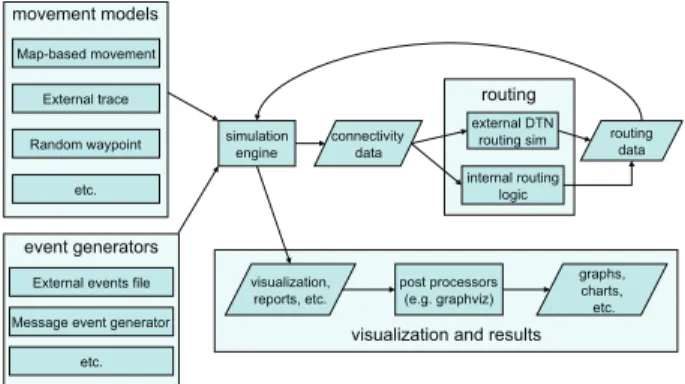
The main functions of the ONE simulator are the modeling of
node movement, inter-node contacts, routing and message han-dling. Result collection and analysis are done through visualiza-tion, reports and post-processing tools. The elements and their interactions are shown in figure 1. A detailed description of the simulator is available in [16] and the ONE simulator project page [29] where the source code is also available.
Node movement is implemented by movement models. These are either synthetic models or existing movement traces. Connec-tivity between the nodes is based on their location, communication range and the bit-rate. The routing function is implemented by rout-ing modules that decide which messages to forward over existrout-ing contacts. Finally, the messages themselves are generated through event generators. The messages are always unicast, having a single source and destination host inside the simulation world.
Simulation results are collected primarily through reports gener-ated by report modules during the simulation run. Report modules receive events (e.g., message or connectivity events) from the sim-ulation engine and generate results based on them. The results gen-erated may be logs of events that are then further processed by the external post-processing tools, or they may be aggregate statistics calculated in the simulator. Secondarily, the graphical user inter-face (GUI) displays a visualization of the simulation state showing the locations, active contacts and messages carried by the nodes.
3.1
Node Capabilities
The basic agents in the simulator are called nodes. A node mod-els a mobile endpoint capable of acting as a store-carry-forward router (e.g., a pedestrian, car or tram with the required hardware). Simulation scenarios are built from groups of nodes in a simulation world. Each group is configured with different capabilities.
Each node has a set of basic capabilities that are modeled. These areradio interface,persistent storage,movement,energy consump-tionandmessage routing. Node capabilities such as the radio in-terface and persistent storage that involve only simple modeling are
5
http://www.nsnam.org
6
http://watwire.uwaterloo.ca/DTN/sim/
7E.g., Pydtn at http://www.umiacs.umd.edu/˜mmarsh/pydtn/ and
http://www-net.cs.umass.edu/˜ellenz/software.html.
routing
visualization and results simulation
engine connectivity data
external DTN routing sim internal routing
logic
routing data
visualization,
reports, etc. post processors (e.g. graphviz)
graphs, charts, etc. event generators
External events file Message event generator
etc. movement models
Random waypoint External trace Map-based movement
etc.
Figure 1: Overview of the ONE simulation environment
configured through parametrization (e.g., communication range, bit-rate, peer scanning interval and storage capacity). More complex capabilities such as movement and routing are configured through specialized modules that implement a particular behavior for the capability (e.g., different mobility models).
Modules in each node have access to the node’s basic simula-tion parameters and state, including the posisimula-tion, current movement path, and current neighbors. This allows implementing, e.g., geo-graphic routing and other context-specific algorithms. In addition, modules can make any of their parameters available for other mod-ules in the same node through an intermodule communication bus. This way, for example, a movement module can change its behav-ior depending on the router module’s state or a router module can adjust the radio parameters based on the node intercontact times.
The focus of the simulator is on modeling the behavior of store-carry-forward networking, and hence we deliberately refrain from detailed modeling of the lower layer mechanisms such as signal at-tenuation and congestion of the physical medium. Instead, the radio link is abstracted to a communication range and bit-rate. These are statically configured and typically assumed to remain constant over the simulation. However, the context awareness and dynamic link configuration mechanisms can be used to adjust both range and bit-rate depending on the surroundings, the distance between peers and the number of (active) nodes nearby as suggested, e.g., in [14].
The node energy consumption model is based on an energy bud-get approach. Each node is given an energy budbud-get which is spent by energy consuming activities such as transmission or scanning and can be filled by charging in certain locations (e.g., at home). An inquiry mechanism allows other modules to obtain energy level readings and adjust their actions (e.g., scanning frequency as in [31], forwarding activity, or transmission power) accordingly.
Node movement capabilities are explained below in section 3.2 and the message routing capabilities in section 3.3.
3.2
Mobility Modeling
Node movement capabilities are implemented through mobility models. Mobility models define the algorithms and rules that gen-erate the node movement paths. Three types of synthetic movement models are included: 1) random movement, 2) map-constrained random movement, and 3) human behavior based movement.
The simulator includes a framework for creating movement mod-els as well as interfaces for loading external movement data (see 3.5). Implementations of popularRandom Walk (RW)andRandom Waypoint (RWP)are included. While these models are popular due to their simplicity, they have various known shortcomings [4].
con-strains node movement to predefined paths and routes derived from real map data. Further realism is added by theWorking Day Move-ment (WDM)model [9] that attempts to model typical human move-ment patters during working weeks.
3.2.1
Map-Based Mobility
Map-based movement models constrain the node movement to paths defined in map data. The ONE simulator release includes three map-based movement models: 1) Random Map-Based Move-ment (MBM), 2) Shortest Path Map-Based MoveMove-ment (SPMBM), and 3) Routed Map-Based Movement (RMBM). Furthermore, the release contains map data of the Helsinki downtown area (roads and pedestrian walkways) that the map-based movement models can use. However, the movement models understand arbitrary map data defined in (a subset of) Well Known Text (WKT). Such data is typically converted from real-world map data or created manu-ally using Geographic Information System (GIS) programs such as OpenJUMP.8
In the simplest map-based model,MBM, nodes move randomly but always follow the paths defined by the map data. This results in a random walk of the network defined by the map data and thus may not be a very accurate approximation of real human mobility. A more realistic model is theSPMBMwhere, instead of a com-pletely random walk, the nodes choose a random point on the map and then follow the shortest route to that point from their current lo-cation. The points may be chosen completely randomly or from a list of Points of Interest (POI). These POIs may be chosen to match popular real-world destinations such as tourist attractions, shops or restaurants. Finally, nodes may have pre-determined routes that they follow, resulting in theRMBMmodel. Such routes may be constructed to match, e.g., bus, tram or train routes.
3.2.2
Working Day Movement Model (WDM)
While high-level movement models such as RWP, MBM, and SPMBM are simple to understand and efficient to use in simula-tions they do not generate inter-contact time and contact time dis-tributions that match real-world traces, especially when the number of nodes in the simulation is small. In order to increase the reality of (human) node mobility, we have developed the Working Day Movement (WDM) model [9] for ONE.
The WDM model brings more reality to the node movement by modeling three major activities typically performed by humans dur-ing a workdur-ing week: 1) sleepdur-ing at home, 2) workdur-ing at the office, and 3) going out with friends in the evening. These three activi-ties are divided into corresponding sub-models between which the simulated nodes transition depending on the time of the day.
Beyond the activities themselves, the WDM model includes three different transport models. The nodes can move alone or in groups by walking, driving or riding a bus. The ability to move alone or in groups at different speeds increases the heterogeneity of movement which has impact on the performance of, e.g., routing protocols.
Finally, WDM introduces communities and social relationships which are not captured by simpler models such as RWP. The com-munities are composed from nodes which work in the same office, spend time in the same evening activity spots or live together.
We have shown that the inter-contact time and contact time dis-tributions generated by the WDM model follow closely the ones found in the traces from real-world measurements [9].
3.3
Routing
The message routing capability is implemented similarly to the movement capability: the simulator includes a framework for
defin-8
http://openjump.org
ing the algorithms and rules used in routing and comes with ready implementations of well known DTN routing protocols.
There are six included routing protocols: 1)Direct Delivery (DD), 2)First Contact (FC), 3)Spray-and-Wait, 4)PRoPHET, 5) Max-Prop, and 6) Epidemic. This selection covers the most impor-tant classes of DTN routing protocols: single-copy, n-copy and unlimited-copy protocols, as well as estimation based protocols.
Direct Delivery and First Contact are single-copy routing proto-cols where only one copy of each message exists in the network. In Direct Delivery, the node carries messages until it meets their final destination. In First Contact routing the nodes forward messages to the first node they encounter, which results in a “random walk” search for the destination node.
Spray-and-Wait[28] is an n-copy routing protocol that limits the number of message copies created to a configurable maximum and distributes (“sprays”) these copies to contacts until the number of copies is exhausted. Both variants of Spray-and-Wait suggested by its authors are included: in normal mode, a node gives one copy to a contact, in binary mode half of the copies are forwarded. Once only a single copy is left, it is forwarded only to the final recipient. Three routing protocols perform variants of flooding.Epidemic
[30] replicates messages to all encountered peers, whilePRoPHET
[19] tries to estimate which node has the highest “likelihood” of being able to deliver a message to the final destination based on node encounter history. MaxProp[3] floods the messages but ex-plicitly clears them once a copy gets delivered to the destination. In addition, MaxProp sends messages to other hosts in specific order that takes into account message hop counts and message delivery probabilities based on previous encounters.
Routing capabilities of simulators such as ns-2 ordtnsim2can also be used in conjunction with ONE. Report modules can export mobility and connectivity data to other programs (modules for ns-2 and dtnsimns-2 are included) and external scripts are then used to import the results of routing simulation back into ONE (script for dtnsim2 is included).
If the external routing simulation was run with a contact sched-ule created by the ONE simulator, as described in section 3.6, the whole process from node movement to external simulator’s routing decisions can be visualized and inspected using ONE.
Adding Routing Protocols
To evaluate new routing protocols in the ONE simulator, a new routing module needs to be created for the respective protocol. All routing modules inherit basic functionality, such as simple buffer management and callbacks for various message-related events, from the MessageRoutermodule. These callbacks are invoked by the simulator engine for all kinds of events, e.g., when a new message is created or a message is sent to the node. A router module needs to handle these events and also define actions to be carried out at every time step and the behavior when a new node comes into or leaves the node’s radio range.
The basic functionality for all these events is common for the all currently implemented routing modules with internal routing logic. It is simply re-used for new routing protocols by extending the Ac-tiveRoutermodule. This module provides functions for checking if any of the currently buffered messages are destined to a neigh-boring node, offering sets of messages to neighneigh-boring nodes, and dealing with successfully transferred and aborted message trans-fers, and it implements FIFO and random-ordering buffer manage-ment. For Epidemic, DD and FC routers no functionality beyond this is needed, making their implementations straightforward.
More advanced routing modules may need to track node con-tacts and therefore implement the node discovery callback; e.g.,
PRoPHET and MaxProp perform their own book-keeping on past encounters. State may also be attached to messages using a tagging mechanism and thereby routing information may be forwarded across the network. For example, the Spray-and-Wait router uses this mechanism to include a copy count in every message.
When a simulation is run with the new routing module, the report modules gather the same performance data of the routing process as they do with the existing modules, so that comparing the perfor-mance of the new module to the existing ones is straightforward.
3.4
Application Support
The ONE simulator provides two ways to generate application messages inside the simulation: 1) message generators, and 2) ex-ternal event files. Messages may be unidirectional or generate replies when they are received, approximating a request-response type ap-plication. Furthermore, the messages may include application spe-cific information through generic (name, value) pairs attached to them.
The built-in message generator creates messages with a random or fixed source, destination, size, and interval. A separate tool for generating message event files is also included. Any number of such message event sources may be used concurrently in simula-tions. Messages are either unidirectional or tagged to expect a re-sponse, with separate control of the response size.
Application-specific headers and payloads may be attached to the messages and nodes may be extended to support inspecting message headers and contents along the way so that application-aware forwarding can be realized, e.g., for content distribution.
3.5
Interfaces
An important feature of ONE is its ability to interact with other programs and data sources. The simulator has interfaces, e.g., for node movement, connectivity and message routing traces.
It is possible to generate node movement using an external pro-gram, such as TRANSIMS or BonnMotion9, or from a real-world GPS trace such as the ones available from CRAWDAD. Such a trace file needs to be converted to a suitable form for the Exter-nal Movement module. The distribution package contains a simple script that can convert TRANSIMS output to this format.
Instead of node locations, many real-world traces contain only information about connections between nodes. This kind of traces can also be imported to ONE and used for routing simulations. For this purpose we have created conversion scripts, e.g., for the Diesel-Net traces.10 We have also generated connectivity traces from the real-time location data of trams in the Helsinki area.11
Like node movement and connection traces, also message traces can be imported to ONE. These may include message creation and deletion events, and starting and cancellation of message transfers. This functionality is especially useful if ONE is used for analyz-ing traces generated by other DTN routanalyz-ing simulators or even real-world traces.
In addition to reading output of other programs, ONE can also generate input traces for them. It has report modules whose output is compatible with dtnsim and dtnsim2 connectivity trace input. In a similar fashion, it is also possible to create mobility traces using a mobility report module. If properly formatted, these traces are us-able in, e.g., ns-2. This way ONE can function as a general purpose mobility simulator.
While report files are an easy way to interact with other pro-grams, a report module can also communicate in real time with
9www.cs.uni-bonn.de/IV/BonnMotion 10
http:// traces.cs.umass.edu/index.php/Network/Network
11
http://netlab.hut.fi/tutkimus/dtn/theone/trace_1week_30m.txt.zip
them. This approach was used with real world DTN integration, described in section 4.
3.6
Reporting and Visualization
ONE is able to visualize results of the simulation in two ways: via an interactive Graphical User Interface (GUI) and by generating images from the information gathered during the simulation.
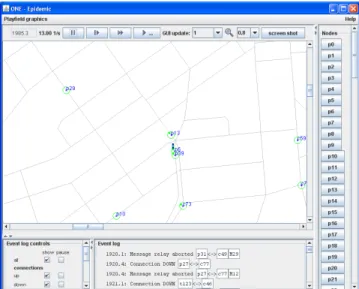
Figure 2 shows the GUI displaying the simulation in real-time. Node locations, current paths, connections between nodes, number of messages carried by a node, etc. are all visualized in the main window. If a map-based movement model is used, also all the map paths are shown. An additional background image (e.g., a raster map or a satellite image of the simulation area) is shown below the map paths if available. The view allows zooming and interactive adjusting of the simulation speed.
Figure 2: Screenshot of the ONE simulator’s GUI
The GUI produces a filtered log of simulation events, such as contacts and message transfers. Filters are used to show only inter-esting events, or to pause the simulation when a particular type of event occurs. Selecting a node from a list or a log message opens it for closer inspection. This allows retrieving further information about the messages a node is carrying and about the routing mod-ule’s state.
While the GUI is good for getting an intuitive overall picture of what is happening during the simulation, more rigorous ways to vi-sualize node relations, message paths and performance summaries are provided by post processed report files.
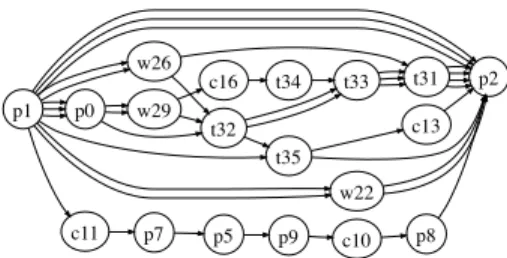
ONE includes report modules that can create Graphviz12 com-patible graph files. Figure 3 shows how these graphs visualize node connections and the paths that the messages have traveled in the network. Likewise, for visualizing how messages are spread in the network as a function of time, a message location report module can provide this data and an animator script will turn the data into a GIF animation.
The simulator includes a message statistics report module that gathers statistics of overall performance (amount of created mes-sages, message delivery ratio, how long messages stay in node buffers, etc.). A post processing script that plots the report mod-ule’s output is also included.
12
p1
p2
t35 p0
w26
w22 c11
c13 w29
t32
c16 t34 t33 t31
p7 p5 p9 c10 p8
Figure 3: Example message paths from node p1 to p2
3.7
Creating Simulation Scenarios
Simulation scenarios are built by defining the simulated nodes and their capabilities. This includes defining the basic parameters such as storage capacity, transmit range and bit-rates, as well as selecting and parameterizing the specific movement and routing models to use. Some simulation settings such as simulation du-ration and time granularity also need to be defined.
The simulator is configured using simple text-based configura-tion files that contain the simulaconfigura-tion, user interface, event genera-tion, and reporting parameters. All modules have their high-level behavior defined by their Java code implementation, but their the details of their behavior is adjustable using the configuration sub-system. Many of the simulation parameters are configurable sepa-rately for each node group but groups can also share a set of param-eters and only alter the paramparam-eters that are specific for the group. The configuration system also allows defining of an array of val-ues for each parameter hence enabling easy sensitivity analysis: in batch runs, a different value is chosen for each run so that large amounts of permutations are explored.
If configuring existing implementations of different modules is insufficient for creating a specific scenario, ONE can also be tended with new code. We have introduced several hooks for ex-tensions without a need for any changes in other parts of the simu-lator code. This allows sharing new modules as plugins and using them with different versions without needing to patch rest of the simulator. Routing modules, movement models, event generators and report modules are all dynamically loaded when the simulator is started. Hence, when creating a new module, user only needs to create and compile a new class, define its name in the configuration file, and the simulator automatically loads it when the scenario is started. All these modules can also have any number of settings defined in the configuration files and these settings are accessible to the module when it is loaded.
4.
REAL-WORLD DTN INTEGRATION
The ONE simulator has been designed to be used in conjunction with DTN213in order to provide a realistic environment for testing
and evaluating real-world DTN applications. The DTN2 bundle router (dtnd) is the reference implementation of the DTNRG bun-dle protocol [25]. DTN2 implementsconvergence layerssuch as TCP, UDP and Bluetooth,routing algorithmssuch as epidemic and PRoPHET, andneighborhood discoverymechanisms such as Bon-jour. Applications can use the DTN2 API to take advantage of the bundle delivery services provided by the bundle router.
There are two interaction models between ONE and the DTN2 reference implementation: 1) Controllingdtndsthrough their con-sole interface based upon connectivity data exported by the ONE simulator, and 2) real-time integration using the simulator to
emu-13
http://www.dtnrg.org/wiki/Code
late all or parts of a DTN. In the first approach, ONE is only used for providing realistic, mobility model based connectivity charac-teristics to a network of DTN2 nodes. In the second approach, ONE is used to emulate all aspects of a DTN network including mobil-ity, routing, radio link characteristics and node storage constraints while DTN2 is used mainly for providing the application interface.
4.1
DTN Controller
Traces generated by ONE’s connectivity report modules are suit-able to control the link status betweendtndinstances. This requires an external DTN Controller that reads the contact trace files pro-duced by the ONE simulator and controls thedtndsthrough their console interfaces. The connectivity traces report each event of a link between two nodes going up or down and the time instance when it occurred. The controller reads these events sequentially and instructs the correspondingdtndinstances to open or close the specified link. Real-time operation is achieved by scheduling issu-ing the control commands accordissu-ing to the trace file’s timestamps. This approach allows the network of bundle routers to run in-dependently if the ONE simulator instance. This is practical for creating long lived, robust testbeds. We have experimented with a DTN Controller (not part of the ONE release) to create a testbed network that simulates buses running between Ruoholahti in down-town Helsinki and the Helsinki University of Technology in Espoo roughly eight kilometers away. This was done by generating a sim-ulation scenario for ONE which modeled buses traveling between the two locations over a 24 hour period and then running a simu-lation to produce the connectivity trace. Our DTN2 controller uses the trace to open and close links betweendtndinstances resulting in a connectivity pattern that resembles having real bundle routers in the buses. The testbed is used for experimenting with various ap-plications, such as a DTN camera application that takes and returns pictures upon receiving a corresponding request.
4.2
DTN Emulation Support
In order to take advantage of all of the ONE simulator’s features when creating an emulated environment for real DTN applications, real-time integration with the DTN2 reference implementation is required. For this purpose ONE implements the External Conver-gence Layer Interface of DTN2. This allows the simulator to con-nect todtndinstances as an external convergence layer adapter, ap-pearing as a link in the DTN2 link table. Any bundles passed onto this link by DTN2 will appear as new messages in ONE. The sim-ulator also controlsdtndsvia the console interface to automatically set up the routing to pass bundles to and from the link.
It is possible to connect any number of DTN2 instances at the same time. Each instance is configured to match a specific node inside the simulation with a mapping from the Endpoint Identi-fiers (EIDs) used in the bundle protocol to the node IDs used by the ONE simulator. The EID mapping uses regular expressions al-lowing one node to have any number of matching EIDs as well as allowing one EID to match any number of nodes. When a bun-dle arrives fromdtndONE matches the destination EID against the configured EID to node ID mappings and generates a bundle mes-sage to each matching destination. After this the bundle mesmes-sages are treated identically to all other messages inside the simulation. Once a bundle message reaches its destination inside the simula-tion it is delivered to thedtndinstance connected to the destination node.
The DTN Emulation Support has been used to provide a realistic scenario for demonstrating an implementation of mail over DTN [12]. A simple scenario for the ONE simulator was constructed that mimicked the layout of an exhibition hall with a number of
DTN-capable nodes moving around the area. Multiple devices, such as Internet tablets, runningdtndand DTN email applications were connected to the simulator. As messages were sent from these devices they appeared in the ONE simulation, traveled around until they found their destination, and then appeared in the real device they were destined to. ONE was run in the GUI mode showing in real-time the messages as they traveled between the nodes.
5.
SAMPLE SIMULATIONS
We have carried out specific simulations to assess the impact of selected aspects of mobility modeling on the simulation results. These simulations are exemplary in nature to demonstrate the capa-bilities of the ONE simulator and not intended to compare or oth-erwise assess the performance of different protocols for the given scenario. They complement the findings from our technical report [17] which we refer to as appropriate to limit our scope here.
For our simulations, we assume interpersonal communication between mobile users in a city using modern mobile phones or sim-ilar devices, using Bluetooth at 2 Mbit/s net data rate with 10 m ra-dio range. We observed that WLAN rara-dios with 100 m rara-dio range have only a minor impact and do not change the elementary inter-action characteristics [17] so that we limit our discussion here to the Bluetooth case. The mobile devices have up to 100 MB of free buffer space for storing and forwarding messages (flash memory may mostly be occupied by music or photos.)
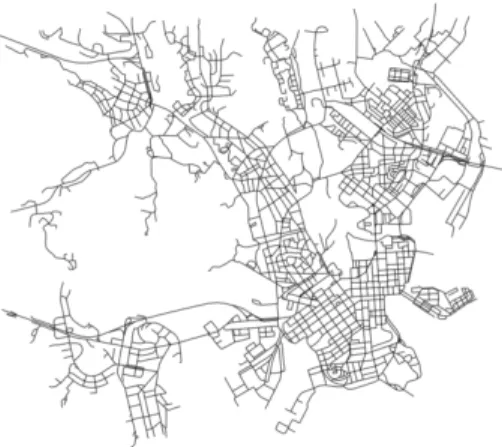
We have 544 and 1029 mobile nodes (humans, cars and trams)— referred to assmallandlargescenario, respectively—which move in a terrain of 8300×7300 m. The area is either an open space (for simple mobility models) or a part of the Helsinki city area as de-picted in figure 4 (for map-based movement). In addition to normal roads, we have added several tram routes to the map. We choose three different scanning intervals: 0 s which means that nodes are always on, 60 s and 300 s which mean that a node sleeps for the respective interval after losing contact with other nodes. We use three mobility models from section 3.2:
RWP. As a baseline, we use theRandom Waypoint Modelwith all nodes modeled as pedestrians moving at random speeds of 0.5– 1.5 m/s with pause times of 0–120 s (both uniformly distributed) in an open space. With RWP, the space is slightly larger than for the other models because the rectangular shape includes those map sections which are covered by the Baltic Sea.
HCS. A simple map-based movement model is theHelsinki City Scenariodescribed above: we use six trams following predefined routes; two thirds of the remaining nodes are pedestrians and one third are cars. Cars run at 10–50 km/h and trams at 25–36 km/h with pause times of of 10–120 s and 10–30 s, respectively (all uniformly distributed). The pedestrians and cars choose random destinations in their reach on the map and move there following the shortest path. As our earlier results [17] showed that varying the numbers of trams and cars has some impact but does not change the basic communication characteristics, we stick to a single scenario.
WDM. To approach realistic movement, we use theWorking Day Movement modelwith the settings from [9] for thelargeand from [15] for thesmallscenario. Both follow the default scenario from section 5 in [9]. The reduced number of nodes is achieved by shrinking all the group sizes proportionally leaving the basic con-tact characteristics unchanged.
5.1
Mobility and Connectivity
Since WDM models daily routines of working days, we choose a simulation duration of five days plus one day for mobility warmup and one day for routing/messaging warmup and use this across all mobility scenarios. For each of the three mobility scenarios
in-Figure 4: Helsinki simulation area (map data provided by Maanmittauslaitos, 2007)
troduced above, we conducted ten simulation runs using different random seeds and present the mean values as results.
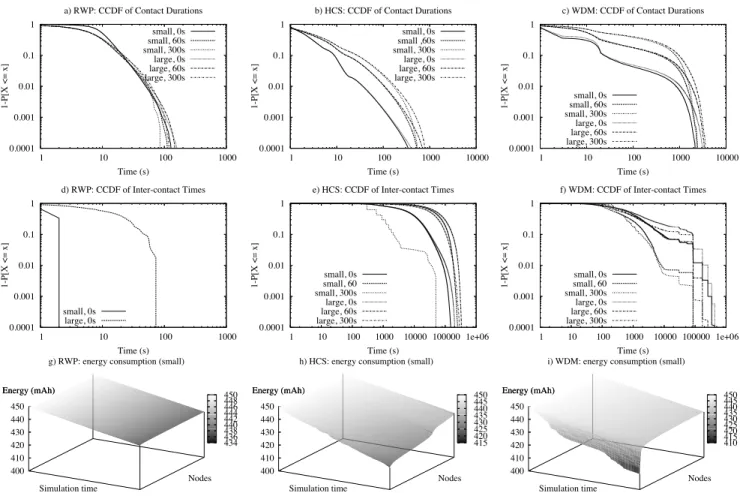
To characterize the impact of the mobility models, we have ana-lyzed the inter-contact times and the contact durations, and the to-tal connectivity time between any two nodes. We observe that the node density does not fundamentally affect the connectivity distri-bution: when doubling the number of nodes, the contact frequency increases expectedly (leading to slightly reduced inter-contact times) as does the contact duration.
The differences between the three scenarios are more interesting: We plot the complementary cumulative distribution (CCDF) of the inter-contact times and the contact durations in figures 5a–f) for all mobility models and scanning intervals. The different shapes of the curves show the impact of the mobility models on connectiv-ity: RWP leads to shorter contact durations (a–c) because nodes move into arbitrary directions rather than along roads (as in HCS and WDM); they do not meet in offices either. The more realis-tic mobility becomes, the longer the contact durations get. HCS and even more so WDM have “bumps” in their contact durations around 10 s, coinciding with two people move into opposite direc-tions at a mean walking speed of 1 m/s and a connectivity range of 10 m. With increasing reality, inter-contact times (d–f) get shorter and follow a distribution found from real-world traces [9]. Scan-ning intervals significantly influence the frequency of contact and thus the overall connectivity (see next subsection), which is also reflected in figure 5: since the radio remains active while in con-tact and nodes may miss many opportunities while sleeping, the relative duration per contact is shifted towards longer periods and relative inter-contact times get shorter. For RWP, the unrestricted motion paired with scanning intervals of 60 s or 300 s does not yield reportable inter-contact times as nodes rarely find each other (d).
Figures 5g–i) show the energy level of individual nodes based upon a 450 mAh battery, using the energy consumption for Blue-tooth as derived in [31] and the motion of one day with messages generated every 20–30 min as an example (see next subsection). While RWP exhibits a fairly uniform energy usage over the simu-lation time, HCS and WDM show an increasing stress on a subset of nodes: those which are more central or exhibit the most social interactions with others. Note that this includes buses and trams which would not run on battery power.
Figure 6 shows the differences in the total contact durations. RWP yields a significantly lower total contact duration than HCS and WDM. WDM and HCS are in the same order of magnitude;
0.0001 0.001 0.01 0.1 1
1 10 100 1000
1-P[X <= x]
Time (s)
a) RWP: CCDF of Contact Durations small, 0s small, 60s small, 300s large, 0s large, 60s large, 300s 0.0001 0.001 0.01 0.1 1
1 10 100 1000 10000
1-P[X <= x]
Time (s)
b) HCS: CCDF of Contact Durations small, 0s small ,60s small, 300s large, 0s large, 60s large, 300s 0.0001 0.001 0.01 0.1 1
1 10 100 1000 10000
1-P[X <= x]
Time (s)
c) WDM: CCDF of Contact Durations
small, 0s small, 60s small, 300s large, 0s large, 60s large, 300s 0.0001 0.001 0.01 0.1 1
1 10 100 1000
1-P[X <= x]
Time (s)
d) RWP: CCDF of Inter-contact Times
small, 0s large, 0s 0.0001 0.001 0.01 0.1 1
1 10 100 1000 10000 100000 1e+06
1-P[X <= x]
Time (s)
e) HCS: CCDF of Inter-contact Times
small, 0s small, 60 small, 300s large, 0s large, 60s large, 300s 0.0001 0.001 0.01 0.1 1
1 10 100 1000 10000 100000 1e+06
1-P[X <= x]
Time (s)
f) WDM: CCDF of Inter-contact Times
small, 0s small, 60 small, 300s large, 0s large, 60s large, 300s 434 436 438 440 442 444 446 448 450 400 410 420 430 440 450 Energy (mAh)
g) RWP: energy consumption (small)
Simulation time Nodes Energy (mAh) 415 420 425 430 435 440 445 450 400 410 420 430 440 450 Energy (mAh)
h) HCS: energy consumption (small)
Simulation time Nodes Energy (mAh) 410 415 420 425 430 435 440 445 450 400 410 420 430 440 450 Energy (mAh)
i) WDM: energy consumption (small)
Simulation time
Nodes Energy (mAh)
Figure 5: Mobile node contact characteristics as a function of the mobility model
note, however, that WDM nodes sleep at night while nodes in HCS move permanently. WDM is less susceptible to scanning intervals as nodes exhibit more continuous co-location so that a) they may remain in contact while in the office for longer periods and b) oc-casional scans are less likely to miss other nodes when they are around all the time. Comparing the total contact times between the small and the large scenarios, the total contact duration grows by a factor of roughly two for the two map-based movement models and by about 1.3 for RWP, irrespective of the scanning interval settings.
5.2
DTN Messaging
In this subsection, we provide an example for DTN messaging simulations. For the DTN messaging simulations, we use a shorter simulation interval as we are not interested in the longer-term con-tact characteristics, but rather in the opportunities to exchange mes-sages during a single day. We assume that all users have Internet access at home or hotel so that messages would get delivered over night. We define a day to last for 18 hours (from 6:00 to 24:00) and are interested in message delivery during such a day. Hence, we choose a message lifetime (TTL) of 16 hours.
We use all routing protocols implemented in the ONE simula-tor: FirstContact (FC), DirectDelivery (DD), Epidemic, PRoPHET (withβ = 0.25), Binary Spray and Wait (SnW) with 6 message copies, and MaxProp.14We use the node configuration of thesmall
scenario (544 nodes) defined above. Random source nodes
gener-14We limit the parameter settings for PRoPHET and Spray and Wait
based upon our earlier experience [17].
1 10 100 1000 10000 100000
RWP, small, 0s RWP, small, 60s RWP, small, 300s RWP, large, 0s RWP, large, 60s RWP, large, 300s HCS, small, 0s HCS, small, 60s HCS, small, 300s HCS, large, 0s HCS, large, 60s HCS, large, 300s WDM, small, 0s WDM, small, 60s WDM, small, 300s WDM, large, 0s WDM, large, 60s WDM, large, 300s
Mean total contact duration per node (s)
Figure 6: Mean total contact duration per node
ate messages to a random destination on average once per 20–30 minutes (uniformly distributed). We use message sizes uniformly distributed between 500 KB and 1 MB. We run the simulations for the mobility models investigated above using the five different ran-dom seeds and report the mean one-way message delivery charac-teristics for a subset of these permutations.
The above observations and particularly the impact of the mo-bility models on the protocol performance become apparent from
0 0.1 0.2 0.3 0.4 0.5 0.6 0.7 0.8 0.9 1
0s 60s RWP
300s 0s 60s HCS
300s 0s 60s WDM
300s
Message Delivery Probability
FC DD SnW Epidemic Prophet Maxprop
Figure 7: Message delivery probability
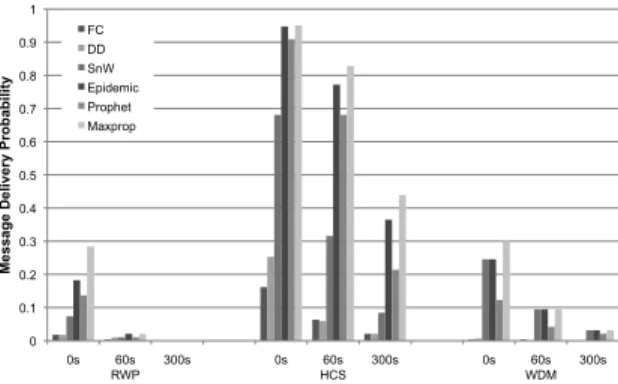
figure 7 which shows the message delivery probability within 18 hours.15 We observe significant differences that, again, show the relevance of the mobility model for protocol performance—and they show the strong effect of increased scanning intervals.
Without fragmentation, node contacts are not long enough for RWP for effective message passing, which explains the low deliv-ery rate for RWP. HCS shows better delivdeliv-ery rates than WDM be-cause nodes move continuously and across a wider range and have thus better chances of successful message delivery; note that for the messages, the choice of source and destination does not follow the social structure of groups underlying the mobility model.
We also investigated simple application interactions, e.g., request-response protocols with different message size characteristics, con-firming that node contact durations are one important factor since large messages are less likely to be delivered in non-congested sce-narios [17]. We implemented different fragmentation schemes in the ONE simulator (not included in the current open source distri-bution) and studied their impact on message delivery performance for all routing protocols protocols discussed above. We found that conservative on-demand fragmentation with pre-defined fragmen-tation boundaries improves the delivery rate for large messages in the simulated scenarios (RWP and HCS) [23].
5.3
Performance Observations
The ONE simulator offers a framework for evaluating DTN pro-tocols and, as such, its performance primarily depends on the evalu-ated protocols and their computational and memory requirements. Naturally, the performance depends on the size of the simulation area, the number of nodes, their communication range, the mobil-ity model, and the scanning intervals which together govern the frequency of connection events.
Simulations usually run much faster than real-time, but complex simulation setups and large state space may cause significant slow-down. The simulator continuously reports the ratio of simulation time per second of real-time elapsed, which gives some perfor-mance indication. For the simulations presented above, we used three rack-mounted Linux PCs with multi-core Intel x86 CPUs (2.9–3.7 GHz) and 8–128 GB of RAM (but most simulations also run on commodity PCs or laptops). For thelargescenario, we ob-served mean simulation speeds ranging from 40:1 to well beyond 1000:1 depending on the PC, the mobility model, and the routing protocols; only MaxProp was notably slower (as low as 10:1 and less). The mobility models primarily affect the number of node encounters and influence simulation speed indirectly so that RWP
15The message delivery latency and the CDF of the fraction of
de-livered messages over time did not yield further insights.
runs faster than WDM which is again faster than HCS; HCS and particularly WDM also require more computations than RWP. In-creasing the scanning intervals impacts the number of encounters; using 60 s reduced the simulation time by up to one fourth in HCS and WDM. Finally, increasing the radio range leads to more en-counters and thus generates more events to process, slowing down simulations depending on the scenario (we observed a factor of 5– 10 when moving from 10 m to 100 m radio range).
The routing protocols influence performance by the number of message copies they create and thus FC, DD, and SnW run faster than epidemic and PRoPHET. Sophisticated routing protocols, such as MaxProp, that require a lot of state information per node and connection and perform complex processing, may slow down sim-ulations with a large number of nodes and frequent encounters, also requiring a lot of RAM for the Java Virtual Machine.
The simulation speed also depends on the simulation time reso-lution, i.e., the intervals at which the simulation time is advanced. This interval is adjustable and doubling the interval may often make the simulation run almost two times faster. We ran the above sim-ulations with a time resolution of 1.0 s, noting that earlier exper-iments yielded similar simulation results for 1.0 s and 0.1 s [17]. For scenarios with larger radio ranges and/or slowly moving nodes, even coarser granularity may be sufficient.
All in all, the present version of the ONE simulator is capable of supporting sizeable simulation setups of some thousand nodes. In our experiments, simulation durations ranged from between five and tens of minutes for the simulations of section 5.2 (except for MaxProp which took several hours in some cases) to some three hours for those of section 5.1.
6.
CONCLUSION
In this paper, we have presented the ONE simulator, an oppor-tunistic networking evaluation system that offers a variety of tools to create complex mobility scenarios that come closer to reality than many other synthetic mobility models. GPS map data pro-vides the scenario setting and node groups with numerous different parameters are used to model a wide variety of independent node activities and capabilities. The Working Day Movement model al-lows recreating complex social structures and features such as scan-ning intervals add further aspects of reality and heterogeneity to the modeling. All these aspects may matter as our simple examples have shown. With its flexible input and output interfaces, the ONE simulator can incorporate real-world traces and feeds from other mobility generators as well as generate mobility traces for use by other simulators. Its DTN framework currently includes six pa-rameterizable DTN routing protocols and two types of application messaging. Its visualization component is used for instant sanity checks, deeper inspection, or simply to observe node movements in real-time—which broadens its applicability beyond DTN stud-ies. Particularly the integration with the DTN reference implemen-tation allows creating testbeds and emulations.
The ONE simulator still has numerous limitations and will hardly ever be complete. Our short-term interest is in better modeling the node-to-node communication characteristics by learning from real-world measurements and other simulation models and deriving a sensible abstraction. Furthermore, message generation activity will need to take into account group relationships and context infor-mation. Finally, further refinements to the Working Day Mobil-ity model are needed to provide better modeling of buildings and of traffic; we are interested in learning and importing from other simulation environments.
We are using and continuously advancing the ONE simulator in our ongoing DTN research, as a mobility generator and as a full
simulator, e.g., for our work on opportunistic content caching in DTNs [22] and we apply it in our DTN graduate course.16 We
maintain an open source distribution of the simulator; the current release (1.3.0) includes all the features described in this paper [29].
7.
REFERENCES
[1] BETTSTETTER, C. Smooth is better than sharp: A random mobility model for simulation of wireless networks. InProc.
of ACM MSWiM(July 2001).
[2] BOUDEC, J.-Y. L.,ANDVOJNOVIC, M. Perfect Simulation and Stationarity of a Class of Mobility Models. InProc. of IEEE Infocom(2005).
[3] BURGESS, J., GALLAGHER, B., JENSEN, D.,AND
LEVINE, B. N. MaxProp: Routing for Vehicle-Based Disruption-Tolerant Networks. InProceedings of IEEE Infocom(April 2006).
[4] CAMP, T., BOLENG, J.,ANDDAVIES, V. A Survey of Mobility Models for Ad Hoc Network Research.Wireless Communications & Mobile Computing (WCMC): Special issue on Mobile Ad Hoc Networking: Research, Trends and Applications 2, 5 (2002), 483–502.
[5] CERF, V., BURLEIGH, S., HOOKE, A., TORGERSON, L., DURST, R., SCOTT, K., FALL, K.,ANDH.WEISS. Delay-Tolerant Network Architecture. RFC 4838, 2007. [6] CHOFFNES, D. R.,ANDBUSTAMANTE, F. E. An integrated
mobility and traffic model for vehicular wireless networks. InProc. of the 2nd ACM International Workshop on Vehicular Ad-hoc Networks(2005).
[7] DANIELGÖRGEN, H. F.,ANDHIEDELS, C. JANE – The Java Ad Hoc Network Development Environment. InProc. of the 40th Annual Simulation Symposium (ANSS)(2007). [8] EAGLE, N.,ANDPENTLAND, A. S. Reality mining:
sensing complex social systems.Personal Ubiquitous Computing 10, 4 (2006), 255–268.
[9] EKMAN, F., KERÄNEN, A., KARVO, J.,ANDOTT, J. Working day movement model. InProc. 1st
ACM/SIGMOBILE Workshop on Mobility Models for Networking Research(May 2008).
[10] FALL, K. A Delay-Tolerant Network Architecture for Challenged Internets. InProc. of ACM SIGCOMM(2003). [11] HUI, P., CHAINTREAU, A., SCOTT, J., GASS, R.,
CROWCROFT, J.,ANDDIOT, C. Pocket Switched Networks and Human Mobility in Conference Environments. InProf. of the ACM SIGCOMM Workshop on Delay-Tolerant
Networking (WDTN)(2005).
[12] HYYRYLÄINEN, T., KÄRKKÄINEN, T., LUO, C., JASPERTAS, V., KARVO, J.,ANDOTT, J. Opportunistic email distribution and access in challenged heterogeneous environments (demo. InProc. of the ACM MobiCom
Workshop on Challenged Networks (CHANTS)(2007).
[13] JAIN, S., FALL, K.,ANDPATRA, R. Routing in a Delay Tolerant Network. InProc. of ACM SIGCOMM(2004). [14] JARDOSH, A. P., BELDING-ROYER, E. M., ALMEROTH,
K. C.,ANDSURI, S. Real-world environment models for mobile network evaluation.IEEE Journal on Selected Areas in Communications 23, 3 (March 2005), 99–105.
[15] KARVO, J.,ANDOTT, J. Time scales and delay-tolerant routing protocols. InProc.c of the ACM MobiCom Workshop on Challenged Networks (CHANTS)(2008).
16
TKK S-38.3151, https://noppa.tkk.fi/noppa/kurssi/s-38.3151/
[16] KERÄNEN, A. Opportunistic Network Environment Simulator. Special Assignment report, Helsinki University of Technology, Department of Communications and
Networking, May 2008.
[17] KERÄNEN, A.,ANDOTT, J. Increasing Reality for DTN Protocol Simulations. Tech. rep., Helsinki University of Technology, Networking Laboratory, July 2007.
[18] LEGUAY, J., FRIEDMAN, T.,ANDCONAN, V. Evaluating Mobility Pattern Space Routing for DTNs. InProc. of IEEE Infocom(2006).
[19] LINDGREN, A., DORIA, A.,ANDSCHELEN, O.
Probabilistic routing in intermittently connected networks. In
The First International Workshop on Service Assurance with Partial and Intermittent Resources (SAPIR)(2004). [20] MARFIA, G., PAU, G., SENA, E. D., GIORDANO, E.,AND
GERLA, M. Evaluating vehicle network strategies for downtown Portland: opportunistic infrastructure and the importance of realistic mobility models. InProc. of the 1st International MobiSys Workshop on Mobile Opportunistic Networking(2007).
[21] PELUSI, L., PASSARELLA, A.,ANDCONTI, M.
Opportunistic networking: Data forwarding in disconnected mobile ad hoc networks.IEEE Comm. Magazine(Nov 2006). [22] PITKÄNEN, M.,ANDOTT, J. Enabling Opportunistic
Storage for Mobile DTNs.Journal on Pervasive and Mobile Computing 4, 5 (Oct 2008), 579–594.
[23] PITKÄNEN, M. J., KERÄNEN, A.,ANDOTT, J. Message Fragmentation in Opportunistic DTNs. InProc. of the 2nd WoWMoM Workshop on Autonomic and Opportunistic
Communications (AOC)(2008).
[24] SCOTT, J., HUI, P., CROWCROFT, J.,ANDDIOT, C. Haggle: A Networking Architecture Designed Around Mobile Users. InProceedings of IFIP WONS(2006). [25] SCOTT, K.,ANDBURLEIGH, S. Bundle Protocol
Specification. RFC 5050, November 2007.
[26] SPYROPOULOS, T., PSOUNIS, K.,ANDRAGHAVENDRA, C. Efficient Routing in Intermittently Connected Mobile Networks: The Multiple-copy Case.ACM/IEEE Transactions on Networking(Feb. 2008).
[27] SPYROPOULOS, T., PSOUNIS, K.,ANDRAGHAVENDRA, C. S. Single-copy routing in intermittently connected mobile networks. InProc. Sensor and Ad Hoc Communications and Networks SECON(October 2004), pp. 235–244.
[28] SPYROPOULOS, T., PSOUNIS, K.,ANDRAGHAVENDRA, C. S. Spray and Wait: An Efficient Routing Scheme for Intermittently Connected Mobile Networks. InProc. of the ACM SIGCOMM Workshop on Delay-Tolerant Networking
(WDTN)(2005).
[29] TKK/COMNET. Project page of the ONE simulator. http://www.netlab.tkk.fi/tutkimus/dtn/theone, 2008. [30] VAHDAT, A.,ANDBECKER, D. Epidemic routing for
partially connected ad hoc networks. Technical Report CS-200006, Duke University, April 2000.
[31] WANG, W., SRINIVASAN, V.,ANDMOTANI, M. Adaptive contact probing mechanisms for delay tolerant applications. InProc. of ACM MobiCom(September 2007).
[32] ZHANG, Z. Routing in intermittently connected mobile ad hoc networks and delay tolerant networks: Overview and challenges.IEEE Communications Surveys and Tutorials 8, 4 (January 2006), 24–37.