but not approved in detail
Frequently Asked Questions
FAQ Citation:
These Frequently Asked Questions have been taken directly from the chapters of the underlying report and are collected here. When referencing specific FAQs, please reference the corresponding chapter in the report from whence the FAQ originated.
When referencing the group of FAQs, please cite as:
IPCC, 2007: Climate Change 2007: The Physical Science Basis. Contribution of Working Group I to the Fourth Assessment
Report of the Intergovernmental Panel on Climate Change [Solomon, S., D. Qin, M. Manning, Z. Chen, M. Marquis, K.B. Averyt,
Frequently Asked Question 1.1
What Factors Determine Earth’s Climate?
The climate system is a complex, interactive system consistingof the atmosphere, land surface, snow and ice, oceans and other bodies of water, and living things. The atmospheric component of the climate system most obviously characterises climate; climate is often defined as ‘average weather’. Climate is usually described in terms of the mean and variability of temperature, precipitation and wind over a period of time, ranging from months to millions of years (the classical period is 30 years). The climate system evolves in time under the influence of its own internal dynamics and due to changes in external factors that affect climate (called ‘forcings’). External forcings include natural phenomena such as volcanic eruptions and solar variations, as well as human-induced changes in atmospheric composition. Solar radiation powers the climate system. There are three fundamental ways to change the radiation balance of the Earth: 1) by changing the incoming solar radiation (e.g., by changes in Earth’s orbit or in the Sun itself); 2) by changing the fraction of solar radiation that is reflected (called
‘albedo’; e.g., by changes in cloud cover, atmospheric particles or vegetation); and 3) by altering the longwave radiation from Earth back towards space (e.g., by changing greenhouse gas concentra-tions). Climate, in turn, responds directly to such changes, as well as indirectly, through a variety of feedback mechanisms.
The amount of energy reaching the top of Earth’s atmosphere each second on a surface area of one square metre facing the Sun during daytime is about 1,370 Watts, and the amount of en-ergy per square metre per second averaged over the entire planet is one-quarter of this (see Figure 1). About 30% of the sunlight that reaches the top of the atmosphere is reflected back to space. Roughly two-thirds of this reflectivity is due to clouds and small particles in the atmosphere known as ‘aerosols’. Light-coloured areas of Earth’s surface – mainly snow, ice and deserts – reflect the remaining one-third of the sunlight. The most dramatic change in aerosol-produced reflectivity comes when major volcanic erup-tions eject material very high into the atmosphere. Rain typically
FAQ 1.1, Figure 1. Estimate of the Earth’s annual and global mean energy balance. Over the long term, the amount of incoming solar radiation absorbed by the Earth and atmosphere is balanced by the Earth and atmosphere releasing the same amount of outgoing longwave radiation. About half of the incoming solar radiation is absorbed by the Earth’s surface. This energy is transferred to the atmosphere by warming the air in contact with the surface (thermals), by evapotranspiration and by longwave radiation that is absorbed by clouds and greenhouse gases. The atmosphere in turn radiates longwave energy back to Earth as well as out to space. Source: Kiehl and Trenberth (1997).
clears aerosols out of the atmosphere in a week or two, but when material from a violent volcanic eruption is projected far above the highest cloud, these aerosols typically influence the climate for about a year or two before falling into the troposphere and being carried to the surface by precipitation. Major volcanic erup-tions can thus cause a drop in mean global surface temperature of about half a degree celsius that can last for months or even years. Some man-made aerosols also significantly reflect sunlight.
The energy that is not reflected back to space is absorbed by the Earth’s surface and atmosphere. This amount is approximately 240 Watts per square metre (W m–2). To balance the incoming en-ergy, the Earth itself must radiate, on average, the same amount of energy back to space. The Earth does this by emitting outgoing longwave radiation. Everything on Earth emits longwave radia-tion continuously. That is the heat energy one feels radiating out from a fire; the warmer an object, the more heat energy it radi-ates. To emit 240 W m–2, a surface would have to have a tem-perature of around –19°C. This is much colder than the conditions that actually exist at the Earth’s surface (the global mean surface temperature is about 14°C). Instead, the necessary –19°C is found at an altitude about 5 km above the surface.
The reason the Earth’s surface is this warm is the presence of greenhouse gases, which act as a partial blanket for the longwave radiation coming from the surface. This blanketing is known as the natural greenhouse effect. The most important greenhouse gases are water vapour and carbon dioxide. The two most abun-dant constituents of the atmosphere – nitrogen and oxygen – have no such effect. Clouds, on the other hand, do exert a blanketing effect similar to that of the greenhouse gases; however, this effect is offset by their reflectivity, such that on average, clouds tend to have a cooling effect on climate (although locally one can feel the warming effect: cloudy nights tend to remain warmer than clear nights because the clouds radiate longwave energy back down to the surface). Human activities intensify the blanketing effect through the release of greenhouse gases. For instance, the amount of carbon dioxide in the atmosphere has increased by about 35% in the industrial era, and this increase is known to be due to hu-man activities, primarily the combustion of fossil fuels and re-moval of forests. Thus, humankind has dramatically altered the chemical composition of the global atmosphere with substantial implications for climate.
Because the Earth is a sphere, more solar energy arrives for a given surface area in the tropics than at higher latitudes, where
sunlight strikes the atmosphere at a lower angle. Energy is trans-ported from the equatorial areas to higher latitudes via atmo-spheric and oceanic circulations, including storm systems. Energy is also required to evaporate water from the sea or land surface, and this energy, called latent heat, is released when water vapour condenses in clouds (see Figure 1). Atmospheric circulation is pri-marily driven by the release of this latent heat. Atmospheric cir-culation in turn drives much of the ocean circir-culation through the action of winds on the surface waters of the ocean, and through changes in the ocean’s surface temperature and salinity through precipitation and evaporation.
Due to the rotation of the Earth, the atmospheric circulation patterns tend to be more east-west than north-south. Embedded in the mid-latitude westerly winds are large-scale weather sys-tems that act to transport heat toward the poles. These weather systems are the familiar migrating low- and high-pressure sys-tems and their associated cold and warm fronts. Because of land-ocean temperature contrasts and obstacles such as mountain ranges and ice sheets, the circulation system’s planetary-scale atmospheric waves tend to be geographically anchored by conti-nents and mountains although their amplitude can change with time. Because of the wave patterns, a particularly cold winter over North America may be associated with a particularly warm winter elsewhere in the hemisphere. Changes in various aspects of the climate system, such as the size of ice sheets, the type and distribution of vegetation or the temperature of the atmosphere or ocean will influence the large-scale circulation features of the atmosphere and oceans.
There are many feedback mechanisms in the climate system that can either amplify (‘positive feedback’) or diminish (‘negative feedback’) the effects of a change in climate forcing. For example, as rising concentrations of greenhouse gases warm Earth’s cli-mate, snow and ice begin to melt. This melting reveals darker land and water surfaces that were beneath the snow and ice, and these darker surfaces absorb more of the Sun’s heat, causing more warming, which causes more melting, and so on, in a self-reinforcing cycle. This feedback loop, known as the ‘ice-albedo feedback’, amplifies the initial warming caused by rising levels of greenhouse gases. Detecting, understanding and accurately quantifying climate feedbacks have been the focus of a great deal of research by scientists unravelling the complexities of Earth’s climate.
Frequently Asked Question 1.2
What is the Relationship between Climate Change
and Weather?
Climate is generally defined as average weather, and as such, climate change and weather are intertwined. Observations can show that there have been changes in weather, and it is the statis-tics of changes in weather over time that identify climate change. While weather and climate are closely related, there are important differences. A common confusion between weather and climate arises when scientists are asked how they can predict climate 50 years from now when they cannot predict the weather a few weeks from now. The chaotic nature of weather makes it unpredictable beyond a few days. Projecting changes in climate (i.e., long-term average weather) due to changes in atmospheric composition or other factors is a very different and much more manageable issue. As an analogy, while it is impossible to predict the age at which any particular man will die, we can say with high confidence that the average age of death for men in industrialised countries is about 75. Another common confusion of these issues is thinking
that a cold winter or a cooling spot on the globe is evidence against global warming. There are always extremes of hot and cold, al-though their frequency and intensity change as climate changes. But when weather is averaged over space and time, the fact that the globe is warming emerges clearly from the data.
Meteorologists put a great deal of effort into observing, un-derstanding and predicting the day-to-day evolution of weath-er systems. Using physics-based concepts that govweath-ern how the atmosphere moves, warms, cools, rains, snows, and evaporates water, meteorologists are typically able to predict the weather successfully several days into the future. A major limiting factor to the predictability of weather beyond several days is a funda-mental dynamical property of the atmosphere. In the 1960s, me-teorologist Edward Lorenz discovered that very slight differences in initial conditions can produce very different forecast results.
FAQ 1.2, Figure 1. Schematic view of the components of the climate system, their processes and interactions.
This is the so-called butterfly effect: a butterfly flapping its wings (or some other small phenomenon) in one place can, in principle, alter the subsequent weather pattern in a distant place. At the core of this effect is chaos theory, which deals with how small changes in certain variables can cause apparent randomness in complex systems.
Nevertheless, chaos theory does not imply a total lack of or-der. For example, slightly different conditions early in its history might alter the day a storm system would arrive or the exact path it would take, but the average temperature and precipitation (that is, climate) would still be about the same for that region and that period of time. Because a significant problem facing weather fore-casting is knowing all the conditions at the start of the forecast period, it can be useful to think of climate as dealing with the background conditions for weather. More precisely, climate can be viewed as concerning the status of the entire Earth system, in-cluding the atmosphere, land, oceans, snow, ice and living things (see Figure 1) that serve as the global background conditions that determine weather patterns. An example of this would be an El Niño affecting the weather in coastal Peru. The El Niño sets limits on the probable evolution of weather patterns that random effects can produce. A La Niña would set different limits.
Another example is found in the familiar contrast between summer and winter. The march of the seasons is due to changes in the geographical patterns of energy absorbed and radiated away by the Earth system. Likewise, projections of future climate are
shaped by fundamental changes in heat energy in the Earth sys-tem, in particular the increasing intensity of the greenhouse effect that traps heat near Earth’s surface, determined by the amount of carbon dioxide and other greenhouse gases in the atmosphere. Projecting changes in climate due to changes in greenhouse gas-es 50 years from now is a very different and much more easily solved problem than forecasting weather patterns just weeks from now. To put it another way, long-term variations brought about by changes in the composition of the atmosphere are much more predictable than individual weather events. As an example, while we cannot predict the outcome of a single coin toss or roll of the dice, we can predict the statistical behaviour of a large number of such trials.
While many factors continue to influence climate, scientists have determined that human activities have become a dominant force, and are responsible for most of the warming observed over the past 50 years. Human-caused climate change has resulted pri-marily from changes in the amounts of greenhouse gases in the atmosphere, but also from changes in small particles (aerosols), as well as from changes in land use, for example. As climate changes, the probabilities of certain types of weather events are affected. For example, as Earth’s average temperature has increased, some weather phenomena have become more frequent and intense (e.g., heat waves and heavy downpours), while others have become less frequent and intense (e.g., extreme cold events).
Frequently Asked Question 1.3
What is the Greenhouse Effect?
The Sun powers Earth’s climate, radiating energy at very shortwavelengths, predominately in the visible or near-visible (e.g., ul-traviolet) part of the spectrum. Roughly one-third of the solar energy that reaches the top of Earth’s atmosphere is reflected di-rectly back to space. The remaining two-thirds is absorbed by the surface and, to a lesser extent, by the atmosphere. To balance the absorbed incoming energy, the Earth must, on average, radiate the same amount of energy back to space. Because the Earth is much colder than the Sun, it radiates at much longer wavelengths, pri-marily in the infrared part of the spectrum (see Figure 1). Much of this thermal radiation emitted by the land and ocean is ab-sorbed by the atmosphere, including clouds, and reradiated back to Earth. This is called the greenhouse effect. The glass walls in a greenhouse reduce airflow and increase the temperature of the air inside. Analogously, but through a different physical process, the Earth’s greenhouse effect warms the surface of the planet. Without the natural greenhouse effect, the average temperature at Earth’s surface would be below the freezing point of water. Thus,
Earth’s natural greenhouse effect makes life as we know it pos-sible. However, human activities, primarily the burning of fossil fuels and clearing of forests, have greatly intensified the natural greenhouse effect, causing global warming.
The two most abundant gases in the atmosphere, nitrogen (comprising 78% of the dry atmosphere) and oxygen (comprising 21%), exert almost no greenhouse effect. Instead, the greenhouse effect comes from molecules that are more complex and much less common. Water vapour is the most important greenhouse gas, and carbon dioxide (CO2) is the second-most important one. Methane, nitrous oxide, ozone and several other gases present in the atmo-sphere in small amounts also contribute to the greenhouse effect. In the humid equatorial regions, where there is so much water vapour in the air that the greenhouse effect is very large, add-ing a small additional amount of CO2 or water vapour has only a small direct impact on downward infrared radiation. However, in the cold, dry polar regions, the effect of a small increase in CO2 or
FAQ 1.3, Figure 1. An idealised model of the natural greenhouse effect. See text for explanation.
water vapour is much greater. The same is true for the cold, dry upper atmosphere where a small increase in water vapour has a greater influence on the greenhouse effect than the same change in water vapour would have near the surface.
Several components of the climate system, notably the oceans and living things, affect atmospheric concentrations of green-house gases. A prime example of this is plants taking CO2 out of the atmosphere and converting it (and water) into carbohydrates via photosynthesis. In the industrial era, human activities have added greenhouse gases to the atmosphere, primarily through the burning of fossil fuels and clearing of forests.
Adding more of a greenhouse gas, such as CO2, to the at-mosphere intensifies the greenhouse effect, thus warming Earth’s climate. The amount of warming depends on various feedback mechanisms. For example, as the atmosphere warms due to rising levels of greenhouse gases, its concentration of water vapour
increases, further intensifying the greenhouse effect. This in turn causes more warming, which causes an additional increase in water vapour, in a self-reinforcing cycle. This water vapour feed-back may be strong enough to approximately double the increase in the greenhouse effect due to the added CO2 alone.
Additional important feedback mechanisms involve clouds. Clouds are effective at absorbing infrared radiation and therefore exert a large greenhouse effect, thus warming the Earth. Clouds are also effective at reflecting away incoming solar radiation, thus cooling the Earth. A change in almost any aspect of clouds, such as their type, location, water content, cloud altitude, particle size and shape, or lifetimes, affects the degree to which clouds warm or cool the Earth. Some changes amplify warming while others diminish it. Much research is in progress to better understand how clouds change in response to climate warming, and how these changes affect climate through various feedback mechanisms.
Frequently Asked Question 2.1
How do Human Activities Contribute to Climate Change
and How do They Compare with Natural Influences?
Human activities contribute to climate change by causing changes in Earth’s atmosphere in the amounts of greenhouse gas-es, aerosols (small particles), and cloudiness. The largest known contribution comes from the burning of fossil fuels, which releases carbon dioxide gas to the atmosphere. Greenhouse gases and aero-sols affect climate by altering incoming solar radiation and out- going infrared (thermal) radiation that are part of Earth’s energy balance. Changing the atmospheric abundance or properties of these gases and particles can lead to a warming or cooling of the climate system. Since the start of the industrial era (about 1750), the overall effect of human activities on climate has been a warm-ing influence. The human impact on climate durwarm-ing this era greatly exceeds that due to known changes in natural processes, such as solar changes and volcanic eruptions.
Greenhouse Gases
Human activities result in emissions of four principal green-house gases: carbon dioxide (CO2), methane (CH4), nitrous oxide (N2O) and the halocarbons (a group of gases containing fluorine, chlorine and bromine). These gases accumulate in the atmosphere, causing concentrations to increase with time. Significant increases in all of these gases have occurred in the industrial era (see Figure 1). All of these increases are attributable to human activities.
• Carbon dioxide has increased from fossil fuel use in transpor-tation, building heating and cooling and the manufacture of cement and other goods. Deforestation releases CO2 and re-duces its uptake by plants. Carbon dioxide is also released in natural processes such as the decay of plant matter.
• Methane has increased as a result of human activities related to agriculture, natural gas distribution and landfills. Methane is also released from natural processes that occur, for example, in wetlands. Methane concentrations are not currently increas-ing in the atmosphere because growth rates decreased over the last two decades.
• Nitrous oxide is also emitted by human activities such as fertil-izer use and fossil fuel burning. Natural processes in soils and the oceans also release N2O.
• Halocarbon gas concentrations have increased primarily due to human activities. Natural processes are also a small source. Principal halocarbons include the chlorofluorocarbons (e.g., CFC-11 and CFC-12), which were used extensively as refrig-eration agents and in other industrial processes before their presence in the atmosphere was found to cause stratospheric ozone depletion. The abundance of chlorofluorocarbon gases is decreasing as a result of international regulations designed to protect the ozone layer.
• Ozone is a greenhouse gas that is continually produced and destroyed in the atmosphere by chemical reactions. In the tro-posphere, human activities have increased ozone through the release of gases such as carbon monoxide, hydrocarbons and nitrogen oxide, which chemically react to produce ozone. As mentioned above, halocarbons released by human activities destroy ozone in the stratosphere and have caused the ozone hole over Antarctica.
• Water vapour is the most abundant and important greenhouse gas in the atmosphere. However, human activities have only a small direct influence on the amount of atmospheric wa-ter vapour. Indirectly, humans have the potential to affect water vapour substantially by changing climate. For example, a warmer atmosphere contains more water vapour. Human activities also influence water vapour through CH4 emissions, because CH4 undergoes chemical destruction in the strato-sphere, producing a small amount of water vapour.
• Aerosols are small particles present in the atmosphere with widely varying size, concentration and chemical composition. Some aerosols are emitted directly into the atmosphere while others are formed from emitted compounds. Aerosols contain both naturally occurring compounds and those emitted as a re-sult of human activities. Fossil fuel and biomass burning have increased aerosols containing sulphur compounds, organic compounds and black carbon (soot). Human activities such as
FAQ 2.1, Figure 1. Atmospheric concentrations of important long-lived green-house gases over the last 2,000 years. Increases since about 1750 are attributed to human activities in the industrial era. Concentration units are parts per million (ppm) or parts per billion (ppb), indicating the number of molecules of the greenhouse gas per million or billion air molecules, respectively, in an atmospheric sample. (Data combined and simplified from Chapters 6 and 2 of this report.)
FAQ 2.1, Box 1: What is Radiative Forcing?
What is radiative forcing? The influence of a factor that can cause climate change, such as a greenhouse gas, is often evaluated in terms of its radiative forcing. Radiative forcing is a measure of how the energy balance of the Earth-atmosphere system is influenced when factors that affect climate are altered. The word radiative arises because these factors change the balance between incoming solar radiation and outgoing infrared radiation within the Earth’s atmosphere. This radiative balance controls the Earth’s surface temperature. The term forcing is used to indicate that Earth’s radiative balance is being pushed away from its normal state.
Radiative forcing is usually quantified as the ‘rate of energy change per unit area of the globe as measured at the top of the atmo-sphere’, and is expressed in units of ‘Watts per square metre’ (see Figure 2). When radiative forcing from a factor or group of factors is evaluated as positive, the energy of the Earth-atmosphere system will ultimately increase, leading to a warming of the system. In contrast, for a negative radiative forcing, the energy will ultimately decrease, leading to a cooling of the system. Important challenges for climate scientists are to identify all the factors that affect climate and the mechanisms by which they exert a forcing, to quantify the radiative forcing of each factor and to evaluate the total radiative forcing from the group of factors.
FAQ 2.1, Figure 2. Summary of the principal components of the radiative forcing of climate change. All these radiative forcings result from one or more factors that affect climate and are associated with human activities or natural processes as discussed in the text. The values represent the forcings in 2005 relative to the start of the industrial era (about 1750). Human activities cause significant changes in long-lived gases, ozone, water vapour, surface albedo, aerosols and contrails. The only increase in natural forcing of any significance between 1750 and 2005 occurred in solar irradiance. Positive forcings lead to warming of climate and negative forcings lead to a cooling. The thin black line attached to each coloured bar represents the range of uncertainty for the respective value. (Figure adapted from Figure 2.20 of this report.)
surface mining and industrial processes have increased dust in the atmosphere. Natural aerosols include mineral dust re-leased from the surface, sea salt aerosols, biogenic emissions from the land and oceans and sulphate and dust aerosols produced by volcanic eruptions.
Radiative Forcing of Factors Affected by Human Activities
The contributions to radiative forcing from some of the factors influenced by hu-man activities are shown in Figure 2. The values reflect the total forcing relative to the start of the industrial era (about 1750). The forcings for all greenhouse gas increases, which are the best understood of those due to human activities, are positive because each gas absorbs outgoing infrared radiation in the atmosphere. Among the greenhouse gases, CO2 increases have caused the largest forcing over this period. Tropospheric ozone increas-es have also contributed to warming, while stratospheric ozone decreases have contrib-uted to cooling.
Aerosol particles influence radiative forc-ing directly through reflection and absorption of solar and infrared radiation in the atmo-sphere. Some aerosols cause a positive forcing while others cause a negative forcing. The di-rect radiative forcing summed over all aerosol types is negative. Aerosols also cause a nega-tive radianega-tive forcing indirectly through the changes they cause in cloud properties.
Human activities since the industrial era have altered the nature of land cover over the globe, principally through changes in (continued)
croplands, pastures and forests. They have also modified the reflec-tive properties of ice and snow. Overall, it is likely that more solar radiation is now being reflected from Earth’s surface as a result of human activities. This change results in a negative forcing.
Aircraft produce persistent linear trails of condensation (‘con-trails’) in regions that have suitably low temperatures and high humidity. Contrails are a form of cirrus cloud that reflect solar ra-diation and absorb infrared rara-diation. Linear contrails from global aircraft operations have increased Earth’s cloudiness and are esti-mated to cause a small positive radiative forcing.
Radiative Forcing from Natural Changes
Natural forcings arise due to solar changes and explosive volcanic eruptions. Solar output has increased gradually in the industrial era, causing a small positive radiative forcing (see Figure 2). This is in addition to the cyclic changes in solar radiation that
follow an 11-year cycle. Solar energy directly heats the climate system and can also affect the atmospheric abundance of some greenhouse gases, such as stratospheric ozone. Explosive volcanic eruptions can create a short-lived (2 to 3 years) negative forcing through the temporary increases that occur in sulphate aerosol in the stratosphere. The stratosphere is currently free of volcanic aerosol, since the last major eruption was in 1991 (Mt. Pinatubo).
The differences in radiative forcing estimates between the present day and the start of the industrial era for solar irradiance changes and volcanoes are both very small compared to the differ-ences in radiative forcing estimated to have resulted from human activities. As a result, in today’s atmosphere, the radiative forcing from human activities is much more important for current and future climate change than the estimated radiative forcing from changes in natural processes.
Instrumental observations over the past 157 years show that temperatures at the surface have risen globally, with important regional variations. For the global average, warming in the last century has occurred in two phases, from the 1910s to the 1940s (0.35°C), and more strongly from the 1970s to the present (0.55°C). An increasing rate of warming has taken place over the last 25 years, and 11 of the 12 warmest years on record have occurred in the past 12 years. Above the surface, global observations since the late 1950s show that the troposphere (up to about 10 km) has warmed at a slightly greater rate than the surface, while the strato-sphere (about 10–30 km) has cooled markedly since 1979. This is in accord with physical expectations and most model results. Confirmation of global warming comes from warming of the oceans, rising sea levels, glaciers melting, sea ice retreating in the Arctic and diminished snow cover in the Northern Hemisphere.
There is no single thermometer measuring the global tempera-ture. Instead, individual thermometer measurements taken every day at several thousand stations over the land areas of the world are combined with thousands more measurements of sea surface temperature taken from ships moving over the oceans to produce an estimate of global average temperature every month. To ob-tain consistent changes over time, the main analysis is actually of anomalies (departures from the climatological mean at each site) as these are more robust to changes in data availability. It is now possible to use these measurements from 1850 to the present, although coverage is much less than global in the second half of the 19th century, is much better after 1957 when measurements began in Antarctica, and best after about 1980, when satellite measurements began.
Expressed as a global average, surface temperatures have in-creased by about 0.74°C over the past hundred years (between 1906 and 2005; see Figure 1). However, the warming has been neither steady nor the same in different seasons or in different locations. There was not much overall change from 1850 to about 1915, aside from ups and downs associated with natural variabil-ity but which may have also partly arisen from poor sampling. An increase (0.35°C) occurred in the global average temperature from the 1910s to the 1940s, followed by a slight cooling (0.1°C), and then a rapid warming (0.55°C) up to the end of 2006 (Figure 1). The warmest years of the series are 1998 and 2005 (which are sta-tistically indistinguishable), and 11 of the 12 warmest years have occurred in the last 12 years (1995 to 2006). Warming, particu-larly since the 1970s, has generally been greater over land than over the oceans. Seasonally, warming has been slightly greater in the winter hemisphere. Additional warming occurs in cities and urban areas (often referred to as the urban heat island effect), but is confined in spatial extent, and its effects are allowed for both by excluding as many of the affected sites as possible from the global temperature data and by increasing the error range (the blue band in the figure).
Frequently Asked Question 3.1
How are Temperatures on Earth Changing?
A few areas have cooled since 1901, most notably the north-ern North Atlantic near southnorth-ern Greenland. Warming during this time has been strongest over the continental interiors of Asia and northern North America. However, as these are areas with large year-to-year variability, the most evident warming signal has oc-curred in parts of the middle and lower latitudes, particularly the tropical oceans. In the lower left panel of Figure 1, which shows temperature trends since 1979, the pattern in the Pacific Ocean features warming and cooling regions related to El Niño.
Analysis of long-term changes in daily temperature extremes has recently become possible for many regions of the world (parts of North America and southern South America, Europe, north-ern and eastnorth-ern Asia, southnorth-ern Africa and Australasia). Especially since the 1950s, these records show a decrease in the number of very cold days and nights and an increase in the number of extremely hot days and warm nights (see FAQ 3.3). The length of the frost-free season has increased in most mid- and high-latitude regions of both hemispheres. In the Northern Hemisphere, this is mostly manifest as an earlier start to spring.
In addition to the surface data described above, measurements of temperature above the surface have been made with weather balloons, with reasonable coverage over land since 1958, and from satellite data since 1979. All data are adjusted for changes in instruments and observing practices where necessary. Microwave satellite data have been used to create a ‘satellite temperature re-cord’ for thick layers of the atmosphere including the troposphere (from the surface up to about 10 km) and the lower stratosphere (about 10 to 30 km). Despite several new analyses with improved cross-calibration of the 13 instruments on different satellites used since 1979 and compensation for changes in observing time and satellite altitude, some uncertainties remain in trends.
For global observations since the late 1950s, the most re-cent versions of all available data sets show that the troposphere has warmed at a slightly greater rate than the surface, while the stratosphere has cooled markedly since 1979. This is in accord with physical expectations and most model results, which dem-onstrate the role of increasing greenhouse gases in tropospheric warming and stratospheric cooling; ozone depletion also contrib-utes substantially to stratospheric cooling.
Consistent with observed increases in surface temperature, there have been decreases in the length of river and lake ice sea-sons. Further, there has been an almost worldwide reduction in glacial mass and extent in the 20th century; melting of the Green-land Ice Sheet has recently become apparent; snow cover has de-creased in many Northern Hemisphere regions; sea ice thickness and extent have decreased in the Arctic in all seasons, most dra-matically in spring and summer; the oceans are warming; and sea level is rising due to thermal expansion of the oceans and melting of land ice.
FAQ 3.1, Figure 1. (Top) Annual global mean observed temperatures1 (black dots) along with simple fits to the data. The left hand axis shows anomalies relative to the 1961
to 1990 average and the right hand axis shows the estimated actual temperature (°C). Linear trend fits to the last 25 (yellow), 50 (orange), 100 (purple) and 150 years (red) are shown, and correspond to 1981 to 2005, 1956 to 2005, 1906 to 2005, and 1856 to 2005, respectively. Note that for shorter recent periods, the slope is greater, indicating accel-erated warming. The blue curve is a smoothed depiction to capture the decadal variations. To give an idea of whether the fluctuations are meaningful, decadal 5% to 95% (light blue) error ranges about that line are given (accordingly, annual values do exceed those limits). Results from climate models driven by estimated radiative forcings for the 20th century (Chapter 9) suggest that there was little change prior to about 1915, and that a substantial fraction of the early 20th-century change was contributed by naturally oc-curring influences including solar radiation changes, volcanism and natural variability. From about 1940 to 1970 the increasing industrialisation following World War II increased pollution in the Northern Hemisphere, contributing to cooling, and increases in carbon dioxide and other greenhouse gases dominate the observed warming after the mid-1970s. (Bottom) Patterns of linear global temperature trends from 1979 to 2005 estimated at the surface (left), and for the troposphere (right) from the surface to about 10 km altitude, from satellite records. Grey areas indicate incomplete data. Note the more spatially uniform warming in the satellite tropospheric record while the surface temperature changes
more clearly relate to land and ocean. 1
Observations show that changes are occurring in the amount, intensity, frequency and type of precipitation. These aspects of pre-cipitation generally exhibit large natural variability, and El Niño and changes in atmospheric circulation patterns such as the North Atlantic Oscillation have a substantial influence. Pronounced long-term trends from 1900 to 2005 have been observed in precipitation amount in some places: significantly wetter in eastern North and South America, northern Europe and northern and central Asia, but drier in the Sahel, southern Africa, the Mediterranean and south-ern Asia. More precipitation now falls as rain rather than snow in northern regions. Widespread increases in heavy precipitation events have been observed, even in places where total amounts have decreased. These changes are associated with increased water va-pour in the atmosphere arising from the warming of the world’s oceans, especially at lower latitudes. There are also increases in some regions in the occurrences of both droughts and floods.
Precipitation is the general term for rainfall, snowfall and other forms of frozen or liquid water falling from clouds. Pre-cipitation is intermittent, and the character of the prePre-cipitation when it occurs depends greatly on temperature and the weather situation. The latter determines the supply of moisture through winds and surface evaporation, and how it is gathered together in storms as clouds. Precipitation forms as water vapour con-denses, usually in rising air that expands and hence cools. The upward motion comes from air rising over mountains, warm air riding over cooler air (warm front), colder air pushing under warmer air (cold front), convection from local heating of the surface, and other weather and cloud systems. Hence, changes in any of these aspects alter precipitation. As precipitation maps tend to be spotty, overall trends in precipitation are indicated by the Palmer Drought Severity Index (see Figure 1), which is a measure of soil moisture using precipitation and crude estimates of changes in evaporation.
A consequence of increased heating from the human-induced enhanced greenhouse effect is increased evaporation, provided that adequate surface moisture is available (as it always is over the oceans and other wet surfaces). Hence, surface moisture ef-fectively acts as an ‘air conditioner’, as heat used for evapora-tion acts to moisten the air rather than warm it. An observed consequence of this is that summers often tend to be either warm and dry or cool and wet. In the areas of eastern North and South America where it has become wetter (Figure 1), temperatures have therefore increased less than elsewhere (see FAQ 3.3, Figure 1 for changes in warm days). Over northern continents in winter, how-ever, more precipitation is associated with higher temperatures, as the water holding capacity of the atmosphere increases in the warmer conditions. However, in these regions, where precipitation has generally increased somewhat, increases in temperatures (FAQ 3.1) have increased drying, making the precipitation changes less evident in Figure 1.
Frequently Asked Question 3.2
How is Precipitation Changing?
As climate changes, several direct influences alter precipita-tion amount, intensity, frequency and type. Warming accelerates land surface drying and increases the potential incidence and severity of droughts, which has been observed in many places worldwide (Figure 1). However, a well-established physical law (the Clausius-Clapeyron relation) determines that the water-hold-ing capacity of the atmosphere increases by about 7% for every 1°C rise in temperature. Observations of trends in relative humid-ity are uncertain but suggest that it has remained about the same overall, from the surface throughout the troposphere, and hence increased temperatures will have resulted in increased water va-pour. Over the 20th century, based on changes in sea surface tem-peratures, it is estimated that atmospheric water vapour increased by about 5% in the atmosphere over the oceans. Because precipi-tation comes mainly from weather systems that feed on the water vapour stored in the atmosphere, this has generally increased pre-cipitation intensity and the risk of heavy rain and snow events. Basic theory, climate model simulations and empirical evidence all confirm that warmer climates, owing to increased water vapour, lead to more intense precipitation events even when the total an-nual precipitation is reduced slightly, and with prospects for even stronger events when the overall precipitation amounts increase. The warmer climate therefore increases risks of both drought − where it is not raining − and floods − where it is − but at different times and/or places. For instance, the summer of 2002 in Europe brought widespread floods but was followed a year later in 2003 by record-breaking heat waves and drought. The distribution and timing of floods and droughts is most profoundly affected by the cycle of El Niño events, particularly in the tropics and over much of the mid-latitudes of Pacific-rim countries.
In areas where aerosol pollution masks the ground from direct sunlight, decreases in evaporation reduce the overall moisture supply to the atmosphere. Hence, even as the potential for heavier precipitation results from increased water vapour amounts, the duration and frequency of events may be curtailed, as it takes longer to recharge the atmosphere with water vapour.
Local and regional changes in the character of precipitation also depend a great deal on atmospheric circulation patterns determined by El Niño, the North Atlantic Oscillation (NAO; a measure of westerly wind strength over the North Atlantic in winter) and other patterns of variability. Some of these observed circulation changes are associated with climate change. An as-sociated shift in the storm track makes some regions wetter and some − often nearby − drier, making for complex patterns of change. For instance, in the European sector a more positive NAO in the 1990s led to wetter conditions in northern Europe and drier conditions over the Mediterranean and northern African regions (Figure 1). The prolonged drought in the Sahel (see Figure 1), which was pronounced from the late 1960s to the late 1980s, (continued)
continues although it is not quite as intense as it was; it has been linked, through changes in atmospheric circulation, to changes in tropical sea surface temperature patterns in the Pacific, Indian and Atlantic Basins. Drought has become widespread throughout much of Africa and more common in the tropics and subtropics.
As temperatures rise, the likelihood of precipitation falling as rain rather than snow increases, especially in autumn and spring at the beginning and end of the snow season, and in areas where temperatures are near freezing. Such changes are observed in many places, especially over land in middle and high latitudes of
FAQ 3.2, Figure 1. The most important spatial pattern (top) of the monthly Palmer Drought Severity Index (PDSI) for 1900 to 2002. The PDSI is a prominent index of drought and measures the cumulative deficit (relative to local mean conditions) in surface land moisture by incorporating previous precipitation and estimates of moisture drawn into the atmosphere (based on atmospheric temperatures) into a hydrological accounting system. The lower panel shows how the sign and strength of this pattern has changed since 1900. Red and orange areas are drier (wetter) than average and blue and green areas are wetter (drier) than average when the values shown in the lower plot are positive (nega-tive). The smooth black curve shows decadal variations. The time series approximately corresponds to a trend, and this pattern and its variations account for 67% of the linear trend of PDSI from 1900 to 2002 over the global land area. It therefore features widespread increasing African drought, especially in the Sahel, for instance. Note also the wetter areas, especially in eastern North and South America and northern Eurasia. Adapted from Dai et al. (2004b).
the Northern Hemisphere, leading to increased rains but reduced snowpacks, and consequently diminished water resources in sum-mer, when they are most needed. Nevertheless, the often spotty and intermittent nature of precipitation means observed patterns of change are complex. The long-term record emphasizes that patterns of precipitation vary somewhat from year to year, and even prolonged multi-year droughts are usually punctuated by a year of heavy rains; for instance as El Niño influences are felt. An example may be the wet winter of 2004-2005 in the southwestern USA following a six-year drought and below-normal snowpack.
Since 1950, the number of heat waves has increased and wide-spread increases have occurred in the numbers of warm nights. The extent of regions affected by droughts has also increased as precipitation over land has marginally decreased while evapora-tion has increased due to warmer condievapora-tions. Generally, numbers of heavy daily precipitation events that lead to flooding have in-creased, but not everywhere. Tropical storm and hurricane fre-quencies vary considerably from year to year, but evidence suggests substantial increases in intensity and duration since the 1970s. In the extratropics, variations in tracks and intensity of storms reflect variations in major features of the atmospheric circulation, such as the North Atlantic Oscillation.
In several regions of the world, indications of changes in vari-ous types of extreme climate events have been found. The extremes are commonly considered to be the values exceeded 1, 5 and 10% of the time (at one extreme) or 90, 95 and 99% of the time (at the other extreme). The warm nights or hot days (discussed below) are those exceeding the 90th percentile of temperature, while cold nights or days are those falling below the 10th percentile. Heavy precipitation is defined as daily amounts greater than the 95th (or for ‘very heavy’, the 99th) percentile.
In the last 50 years for the land areas sampled, there has been a significant decrease in the annual occurrence of cold nights and a significant increase in the annual occurrence of warm nights (Figure 1). Decreases in the occurrence of cold days and increases in hot days, while widespread, are generally less marked. The dis-tributions of minimum and maximum temperatures have not only shifted to higher values, consistent with overall warming, but the cold extremes have warmed more than the warm extremes over the last 50 years (Figure 1). More warm extremes imply an in-creased frequency of heat waves. Further supporting indications include the observed trend towards fewer frost days associated with the average warming in most mid-latitude regions.
A prominent indication of a change in extremes is the ob-served evidence of increases in heavy precipitation events over the mid-latitudes in the last 50 years, even in places where mean precipitation amounts are not increasing (see also FAQ 3.2). For very heavy precipitation events, increasing trends are reported as well, but results are available for few areas.
Drought is easier to measure because of its long duration. While there are numerous indices and metrics of drought, many studies use monthly precipitation totals and temperature averages combined into a measure called the Palmer Drought Severity In-dex (PDSI). The PDSI calculated from the middle of the 20th cen-tury shows a large drying trend over many Northern Hemisphere land areas since the mid-1950s, with widespread drying over much of southern Eurasia, northern Africa, Canada and Alaska
Frequently Asked Question 3.3
Has there been a Change in Extreme Events like Heat
Waves, Droughts, Floods and Hurricanes?
(FAQ 3.2, Figure 1), and an opposite trend in eastern North and South America. In the Southern Hemisphere, land surfaces were wet in the 1970s and relatively dry in the 1960s and 1990s, and there was a drying trend from 1974 to 1998. Longer-duration records for Europe for the whole of the 20th century indicate few significant trends. Decreases in precipitation over land since the 1950s are the likely main cause for the drying trends, although large surface warming during the last two to three decades has also likely contributed to the drying. One study shows that very dry land areas across the globe (defined as areas with a PDSI of less than –3.0) have more than doubled in extent since the 1970s, associated with an initial precipitation decrease over land related to the El Niño-Southern Oscillation and with subsequent increases primarily due to surface warming.
Changes in tropical storm and hurricane frequency and in-tensity are masked by large natural variability. The El Niño- Southern Oscillation greatly affects the location and activity of tropical storms around the world. Globally, estimates of the po-tential destructiveness of hurricanes show a substantial upward trend since the mid-1970s, with a trend towards longer storm duration and greater storm intensity, and the activity is strongly correlated with tropical sea surface temperature. These relation-ships have been reinforced by findings of a large increase in num-bers and proportion of strong hurricanes globally since 1970 even as total numbers of cyclones and cyclone days decreased slightly in most basins. Specifically, the number of category 4 and 5 hur-ricanes increased by about 75% since 1970. The largest increases were in the North Pacific, Indian and Southwest Pacific Oceans. However, numbers of hurricanes in the North Atlantic have also been above normal in 9 of the last 11 years, culminating in the record-breaking 2005 season.
Based on a variety of measures at the surface and in the upper troposphere, it is likely that there has been a poleward shift as well as an increase in Northern Hemisphere winter storm track ac-tivity over the second half of the 20th century. These changes are part of variations that have occurred related to the North Atlantic Oscillation. Observations from 1979 to the mid-1990s reveal a tendency towards a stronger December to February circumpolar westerly atmospheric circulation throughout the troposphere and lower stratosphere, together with poleward displacements of jet streams and increased storm track activity. Observational evidence for changes in small-scale severe weather phenomena (such as tornadoes, hail and thunderstorms) is mostly local and too scat-tered to draw general conclusions; increases in many areas arise because of increased public awareness and improved efforts to collect reports of these phenomena.
FAQ 3.3, Figure 1. Observed trends (days per decade) for 1951 to 2003 in the frequency of extreme temperatures, defined based on 1961 to 1990 values, as maps for the 10th percentile: (a) cold nights and (b) cold days; and 90th percentile: (c) warm nights and (d) warm days. Trends were calcu-lated only for grid boxes that had at least 40 years of data during this period and had data until at least 1999. Black lines enclose regions where trends are significant at the 5% level. Below each map are the global annual time series of anomalies (with respect to 1961 to 1990). The orange line shows decadal variations. Trends are significant at the 5% level for all the global indices shown. Adapted from Alexander et al. (2006).
Frequently Asked Question 4.1
Is the Amount of Snow and Ice on the Earth Decreasing?
coastal regions of Greenland and West Antarctica in response to increased ice outflow and increased Greenland surface melting.
Ice interacts with the surrounding climate in complex ways, so the causes of specific changes are not always clear. Nonetheless, it is an unavoidable fact that ice melts when the local temperature is
FAQ 4.1, Figure 1. Anomaly time series (departure from the long-term mean) of polar surface air temperature (A, G), arctic and antarctic sea ice ex-tent (B, F), Northern Hemisphere (NH) frozen ground exex-tent (C), NH snow cover extent (D) and global glacier mass balance (E). The solid red line in E denotes the cumulative global glacier mass balance; in the other panels it shows decadal variations (see Appendix 3.A).
Yes. Observations show a global-scale decline of snow and ice over many years, especially since 1980 and increasing dur-ing the past decade, despite growth in some places and little change in others (Figure 1). Most mountain glaciers are getting smaller. Snow cover is retreating earlier in the spring. Sea ice in the Arctic is shrinking in all seasons, most dramatically in summer. Reductions are reported in permafrost, seasonally frozen ground and river and lake ice. Important coastal regions of the ice sheets on Greenland and West Antarctica, and the glaciers of the Antarctic Peninsula, are thinning and contribut-ing to sea level rise. The total contribution of glacier, ice cap and ice sheet melt to sea level rise is estimated as 1.2 ± 0.4 mm yr–1
for the period 1993 to 2003.
Continuous satellite measurements capture most of the Earth’s seasonal snow cover on land, and reveal that Northern Hemisphere spring snow cover has declined by about 2% per decade since 1966, although there is little change in autumn or early winter. In many places, the spring decrease has occurred despite increases in precipitation.
Satellite data do not yet allow similarly reliable measurement of ice conditions on lakes and rivers, or in seasonally or perma-nently frozen ground. However, numerous local and regional reports have been published, and generally seem to indicate warming of permafrost, an increase in thickness of the summer thawed layer over permafrost, a decrease in winter freeze depth in seasonally frozen areas, a decrease in areal extent of perma-frost and a decrease in duration of seasonal river and lake ice.
Since 1978, satellite data have provided continuous coverage of sea ice extent in both polar regions. For the Arctic, average annual sea ice extent has decreased by 2.7 ± 0.6% per decade, while summer sea ice extent has decreased by 7.4 ± 2.4% per decade. The antarctic sea ice extent exhibits no significant trend. Thickness data, especially from submarines, are available but re-stricted to the central Arctic, where they indicate thinning of approximately 40% between the period 1958 to 1977 and the 1990s. This is likely an overestimate of the thinning over the entire arctic region however.
Most mountain glaciers and ice caps have been shrinking, with the retreat probably having started about 1850. Although many Northern Hemisphere glaciers had a few years of near-balance around 1970, this was followed by increased shrinkage. Melting of glaciers and ice caps contributed 0.77 ± 0.22 mm yr–1 to sea level rise between 1991 and 2004
Taken together, the ice sheets of Greenland and Antarctica are very likely shrinking, with Greenland contributing about 0.2 ± 0.1 mm yr–1 and Antarctica contributing 0.2 ± 0.35 mm yr–1 to sea level rise over the period 1993 to 2003. There is evidence of accelerated loss through 2005. Thickening of high-altitude, cold regions of Greenland and East Antarctica, perhaps from increased snowfall, has been more than offset by thinning in
above the freezing point. Reductions in snow cover and in mountain glaciers have occurred despite increased snowfall in many cases, implicating increased air temperatures. Similarly, although snow cover changes affect frozen ground and lake and river ice, this does not seem sufficient to explain the observed changes, sug-gesting that increased local air temperatures have been important. Observed arctic sea ice reductions can be simulated fairly well in
models driven by historical circulation and temperature changes. The observed increases in snowfall on ice sheets in some cold cen-tral regions, surface melting in coastal regions and sub-ice-shelf melting along many coasts are all consistent with warming. The geographically widespread nature of these snow and ice changes suggests that widespread warming is the cause of the Earth’s over-all loss of ice.
Frequently Asked Question 5.1
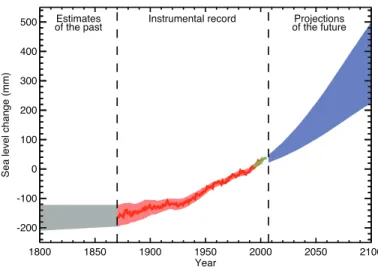
Is Sea Level Rising?
Yes, there is strong evidence that global sea level gradually rose in the 20th century and is currently rising at an increased rate, after a period of little change between AD 0 and AD 1900. Sea level is projected to rise at an even greater rate in this century. The two major causes of global sea level rise are thermal expan-sion of the oceans (water expands as it warms) and the loss of land-based ice due to increased melting.
Global sea level rose by about 120 m during the several mil-lennia that followed the end of the last ice age (approximately 21,000 years ago), and stabilised between 3,000 and 2,000 years ago. Sea level indicators suggest that global sea level did not change significantly from then until the late 19th century. The instrumental record of modern sea level change shows evidence for onset of sea level rise during the 19th century. Estimates for the 20th century show that global average sea level rose at a rate of about 1.7 mm yr–1.
Satellite observations available since the early 1990s provide more accurate sea level data with nearly global coverage. This decade-long satellite altimetry data set shows that since 1993, sea level has been rising at a rate of around 3 mm yr–1, significantly higher than the average during the previous half century. Coastal tide gauge measurements confirm this observation, and indicate that similar rates have occurred in some earlier decades.
In agreement with climate models, satellite data and hydro-graphic observations show that sea level is not rising uniformly around the world. In some regions, rates are up to several times the global mean rise, while in other regions sea level is falling. Sub-stantial spatial variation in rates of sea level change is also inferred from hydrographic observations. Spatial variability of the rates of sea level rise is mostly due to non-uniform changes in temperature and salinity and related to changes in the ocean circulation.
Near-global ocean temperature data sets made available in recent years allow a direct calculation of thermal expansion. It is believed that on average, over the period from 1961 to 2003, thermal expansion contributed about one-quarter of the observed sea level rise, while melting of land ice accounted for less than half. Thus, the full magnitude of the observed sea level rise during that period was not satisfactorily explained by those data sets, as reported in the IPCC Third Assessment Report.
During recent years (1993–2003), for which the observing system is much better, thermal expansion and melting of land ice each account for about half of the observed sea level rise, although there is some uncertainty in the estimates.
The reasonable agreement in recent years between the observed rate of sea level rise and the sum of thermal expansion and loss of land ice suggests an upper limit for the magnitude of change in land-based water storage, which is relatively poorly known. Mod-el results suggest no net trend in the storage of water over land due to climate-driven changes but there are large interannual and decadal fluctuations. However, for the recent period 1993 to 2003,
the small discrepancy between observed sea level rise and the sum of known contributions might be due to unquantified human- induced processes (e.g., groundwater extraction, impoundment in reservoirs, wetland drainage and deforestation).
Global sea level is projected to rise during the 21st century at a greater rate than during 1961 to 2003. Under the IPCC Special Report on Emission Scenarios (SRES) A1B scenario by the mid-2090s, for instance, global sea level reaches 0.22 to 0.44 m above 1990 levels, and is rising at about 4 mm yr–1. As in the past, sea level change in the future will not be geographically uniform, with regional sea level change varying within about ±0.15 m of the mean in a typical model projection. Thermal expansion is pro-jected to contribute more than half of the average rise, but land ice will lose mass increasingly rapidly as the century progresses. An important uncertainty relates to whether discharge of ice from the ice sheets will continue to increase as a consequence of accel-erated ice flow, as has been observed in recent years. This would add to the amount of sea level rise, but quantitative projections of how much it would add cannot be made with confidence, owing to limited understanding of the relevant processes.
Figure 1 shows the evolution of global mean sea level in the past and as projected for the 21st century for the SRES A1B scenario.
FAQ 5.1, Figure 1. Time series of global mean sea level (deviation from the 1980-1999 mean) in the past and as projected for the future. For the period before 1870, global measurements of sea level are not available. The grey shading shows the uncertainty in the estimated long-term rate of sea level change (Section 6.4.3). The red line is a reconstruction of global mean sea level from tide gauges (Section 5.5.2.1), and the red shading denotes the range of variations from a smooth curve. The green line shows global mean sea level observed from satellite altimetry. The blue shading represents the range of model projections for the SRES A1B scenario for the 21st century, relative to the 1980 to 1999 mean, and has been calculated independently from the observations. Beyond 2100, the projections are increasingly dependent on the emissions scenario (see Chapter 10 for a discussion of sea level rise projections for other scenarios considered in this report). Over many centuries or millennia, sea level could rise by several metres (Section 10.7.4).
Frequently Asked Question 6.1
What Caused the Ice Ages and Other Important Climate
Changes Before the Industrial Era?
Climate on Earth has changed on all time scales, including long before human activity could have played a role. Great prog-ress has been made in understanding the causes and mechanisms of these climate changes. Changes in Earth’s radiation balance were the principal driver of past climate changes, but the causes of such changes are varied. For each case – be it the Ice Ages, the warmth at the time of the dinosaurs or the fluctuations of the past millennium – the specific causes must be established individually. In many cases, this can now be done with good confidence, and many past climate changes can be reproduced with quantitative models.
Global climate is determined by the radiation balance of the planet (see FAQ 1.1). There are three fundamental ways the Earth’s radiation balance can change, thereby causing a climate change: (1) changing the incoming solar radiation (e.g., by changes in the Earth’s orbit or in the Sun itself), (2) changing the fraction of solar radiation that is reflected (this fraction is called the albedo – it can be changed, for example, by changes in cloud cover, small particles called aerosols or land cover), and (3) altering the long-wave energy radiated back to space (e.g., by changes in green-house gas concentrations). In addition, local climate also depends on how heat is distributed by winds and ocean currents. All of these factors have played a role in past climate changes.
Starting with the ice ages that have come and gone in regu-lar cycles for the past nearly three million years, there is strong evidence that these are linked to regular variations in the Earth’s orbit around the Sun, the so-called Milankovitch cycles (Figure 1). These cycles change the amount of solar radiation received at each latitude in each season (but hardly affect the global annual mean), and they can be calculated with astronomical precision. There is still some discussion about how exactly this starts and ends ice ages, but many studies suggest that the amount of sum-mer sunshine on northern continents is crucial: if it drops below a critical value, snow from the past winter does not melt away in summer and an ice sheet starts to grow as more and more snow accumulates. Climate model simulations confirm that an Ice Age can indeed be started in this way, while simple conceptual models have been used to successfully ‘hindcast’ the onset of past glacia-tions based on the orbital changes. The next large reduction in northern summer insolation, similar to those that started past Ice Ages, is due to begin in 30,000 years.
Although it is not their primary cause, atmospheric carbon di-oxide (CO2) also plays an important role in the ice ages. Antarctic ice core data show that CO2 concentration is low in the cold gla-cial times (~190 ppm), and high in the warm interglagla-cials (~280 ppm); atmospheric CO2 follows temperature changes in Antarctica with a lag of some hundreds of years. Because the climate changes at the beginning and end of ice ages take several thousand years,
most of these changes are affected by a positive CO2 feedback; that is, a small initial cooling due to the Milankovitch cycles is subsequently amplified as the CO2 concentration falls. Model sim-ulations of ice age climate (see discussion in Section 6.4.1) yield realistic results only if the role of CO2 is accounted for.
During the last ice age, over 20 abrupt and dramatic climate shifts occurred that are particularly prominent in records around the northern Atlantic (see Section 6.4). These differ from the gla-cial-interglacial cycles in that they probably do not involve large changes in global mean temperature: changes are not synchro-nous in Greenland and Antarctica, and they are in the opposite direction in the South and North Atlantic. This means that a major change in global radiation balance would not have been needed to cause these shifts; a redistribution of heat within the climate system would have sufficed. There is indeed strong evidence that changes in ocean circulation and heat transport can explain many features of these abrupt events; sediment data and model simula-tions show that some of these changes could have been triggered by instabilities in the ice sheets surrounding the Atlantic at the time, and the associated freshwater release into the ocean.
Much warmer times have also occurred in climate history – during most of the past 500 million years, Earth was probably completely free of ice sheets (geologists can tell from the marks ice leaves on rock), unlike today, when Greenland and Antarc-tica are ice-covered. Data on greenhouse gas abundances going back beyond a million years, that is, beyond the reach of antarc-tic ice cores, are still rather uncertain, but analysis of geological
FAQ 6.1, Figure 1. Schematic of the Earth’s orbital changes (Milankovitch cycles) that drive the ice age cycles. ‘T’ denotes changes in the tilt (or obliquity) of the Earth’s axis, ‘E’ denotes changes in the eccentricity of the orbit (due to variations in the minor axis of the ellipse), and ‘P’ denotes precession, that is, changes in the direction of the axis tilt at a given point of the orbit. Source: Rahmstorf and Schellnhuber (2006).
samples suggests that the warm ice-free periods coincide with high atmospheric CO2 levels. On million-year time scales, CO2 levels change due to tectonic activity, which affects the rates of CO2 exchange of ocean and atmosphere with the solid Earth. See Section 6.3 for more about these ancient climates.
Another likely cause of past climatic changes is variations in the energy output of the Sun. Measurements over recent decades show that the solar output varies slightly (by close to 0.1%) in an 11-year cycle. Sunspot observations (going back to the 17th cen-tury), as well as data from isotopes generated by cosmic radiation, provide evidence for longer-term changes in solar activity. Data correlation and model simulations indicate that solar variability
and volcanic activity are likely to be leading reasons for climate variations during the past millennium, before the start of the in-dustrial era.
These examples illustrate that different climate changes in the past had different causes. The fact that natural factors caused climate changes in the past does not mean that the current cli-mate change is natural. By analogy, the fact that forest fires have long been caused naturally by lightning strikes does not mean that fires cannot also be caused by a careless camper. FAQ 2.1 addresses the question of how human influences compare with natural ones in their contributions to recent climate change.