Debt and Growth: Is There a Magic Threshold?
© 2014 International Monetary Fund WP/14/34
IMF Working Paper Research Department
Debt and Growth: Is There a Magic Threshold?1
Andrea Pescatori, Damiano Sandri, and John Simon2
Authorized for distribution by Thomas Helbling
February 2014
Abstract
Using a novel empirical approach and an extensive dataset developed by the Fiscal Affairs Department of the IMF, we find no evidence of any particular debt threshold above which medium-term growth prospects are dramatically compromised. Furthermore, we find the debt trajectory can be as important as the debt level in understanding future growth prospects, since countries with high but declining debt appear to grow equally as fast as countries with lower debt. Notwithstanding this, we find some evidence that higher debt is associated with a higher degree of output volatility.
JEL Classification Numbers: H63, O40 Keywords: Sovereign debt, growth
Author’s E-Mail Address: [email protected], [email protected], [email protected]
1 This working paper is based on, but expands upon, work originally contained in Chapter 3 of the October 2012 World Economic Outlook.
2 Research Department, International Monetary Fund.
This Working Paper should not be reported as representing the views of the IMF. The views expressed in this Working Paper are those of the author(s) and do not necessarily represent those of the IMF or IMF policy. Working Papers describe research in progress by the author(s) and are published to elicit comments and to further debate.
Contents Page
I. Introduction ... 4
II. Literature Review and Background... 5
III. Data and Methodology ... 6
IV. Empirical Results ... 7
V. Robustness Checks ... 11
VI. Debt and Volatility ... 13
VII. Conclusions ... 14
VIII. Data Appendix ... 16
References ... 18
Figures 1. Debt and Growth in the Short Run ... 8
2. Debt and Growth over the Medium Run... 9
3. Debt Dynamics over the Medium Term ... 10
4. Debt and Growth Depend on the Debt Trajectory ... 11
5. Relative Growth Performance ... 12
6. Growth Performance from 5 to 15 Years after Crossing Debt Thresholds... 13
I. INTRODUCTION
Is there a particular threshold in the level government debt above which the medium-term growth prospects are dramatically compromised? The answer to this question is of critical importance given the historically high level of public debt in most advanced economies. Yet there is currently no agreement on the answer and it is the subject of heated academic and political debate. One camp has argued that high levels of debt are associated with particularly large negative effects on growth. For example, an influential series of papers by Reinhart and Rogoff (2010, 2012) argues that there is a threshold effect whereby debt above 90 percent of GDP is associated with dramatically worse growth outcomes. An opposing perspective is advanced by those who dispute the notion that there is a clear debt threshold above which debt sharply reduces growth and raise endogeneity concerns whereby weak growth is the cause of particularly high levels of debt. Thus, according to this view, the priority should be increasing growth rather than reducing debt and, consequently, that much less short-term fiscal austerity is appropriate.
This paper makes a contribution to the debate by presenting new empirical evidence based on a different way of analyzing the data and a sizeable dataset. Our methodology is based on the analysis of the relation between debt and growth over longer periods of time that has the potential to attenuate the concerns of reverse causality from growth to debt. Our results do not identify any clear debt threshold above which medium-term growth prospects are dramatically compromised. On the contrary, the association between debt and medium-term growth becomes rather weak at high levels of debt, especially when controlling for the average growth performance of country peers.
We also find evidence that the debt trajectory can be just as important, and possibly more important, than the level of debt in understanding future growth prospects. Indeed, countries with high but declining levels of debt have historically grown just as fast as their peers. We also find, however, that high levels of debt are weakly associated with higher output
volatility. This suggests that high levels of debt may still be associated with market pressure or fiscal and monetary policy actions that, even if they do not have particularly large negative effects on medium-term growth, destabilize it.
As with previous empirical studies, however, caution should be used in the interpretation of our empirical results. While our methodology may attenuate problems of reverse causality from growth to debt, our methodology is still unable to formally establish a firm causality. The remainder of this paper discusses the existing literature in more depth before presenting our analytical approach and empirical results. We then offer some short conclusions.
II. LITERATURE REVIEW AND BACKGROUND
The debate about the relation between debt and growth has been animated by a growing series of empirical papers. One of the most influential analyses on the topic is the one of Reinhart and Rogoff (2010) (henceforth R&R). The key claim of the paper is that there is a particular threshold effect such that countries having debt above 90 percent of GDP have a growth performance dramatically lower than others. While the findings of R&R (2010) have been recently challenged by Herdon, Ash, and Pollin (2013), which show that the threshold effect seems to vanish after correcting for a coding error and using a different weighting of the data, the debate is still very much open. Kumar and Woo (2010), for example, claim to have found “some evidence of nonlinearity with higher levels of initial debt having a proportionately larger negative effect on subsequent growth”.3 Similarly, Cecchetti et al
(2011) find that beyond 96 percent of GDP, public debt becomes a drag on growth—leading them to conclude that “countries with high debt must act quickly and decisively to address their fiscal problems.”4 Focusing on the Euro Area alone, Baum, Checherita and Rother
(2013) also find that debt has a non-linear effect on growth, leading to lower growth when it exceeds 95 percent.
In addition to the threshold effect there is the issue of causality: high debt may be the result of sluggish growth or it could reflect a third factor, an omitted variable, that simultaneously increases debt and reduces growth. Obvious examples are wars or financial crises. This concern is particularly relevant when considering the short-term correlation between growth and debt, which has been the focus of segments of the literature, since temporary recessions naturally lead to an immediate increase in the debt ratio. To partially address this issue, R&R (2012) have complemented their analysis of the relation between debt and growth by considering prolonged periods of high debt. Their results suggest that, during periods of debt overhangs, growth tends to be considerably lower.
Other papers have tackled the issue of causality by using on instrumental techniques. Among these, Panizza and Presbitero (2012) reject the hypothesis that high debt causes lower
growth. Once they instrument debt with a variable that captures valuation effects brought about by the interaction between foreign currency debt and exchange rate volatility, they find no effect
3 Kumar and Woo (2010) runs a growth regression at 5 year frequency from 1970 to 2007 and find that a 10 percentage point increase in the initial debt-to-GDP ratio is associated with a slowdown in annual real per capita GDP growth of 0.15 percentage points per year in AEs. They test for nonlinearities by introducing 3 interaction terms between initial debt and dummy variables for three ranges of initial debt, 30, 60, and 90, respectively.
4
Cecchetti et al (2011) using data on 18 OECD countries from 1980 to 2010 find that a 10 percent increase in government debt reduces real per capita GDP growth by 0.17 percent per year. To evaluate the presence of threshold, they introduce two dummies, above and below a generic threshold,
, in the growth equation. They find that the 96 percent threshold minimizes the sum of squared residuals conditional on no crisis.of debt on growth. Finally, the existence of a threshold bears on the question of causality. If low growth causes high debt it is less likely that one would observe a distinct threshold in the debt and growth relationship. Thus, if such a threshold exists, it is much more likely to be driven by a causal effect of debt on growth.
III. DATA AND METHODOLOGY
The IMF Fiscal Affairs Department recently compiled a comprehensive database on gross government debt to GDP ratios covering nearly the entire IMF membership back to 1875.5
The use of gross debt data reflects the difficulty of collecting net debt data on a consistent basis across countries and over time. Nonetheless, even gross debt data may not be immune to measurement issues (see Dippelsman and others 2012). We augment this data with supplementary data on interest payments and primary deficits for 19 advanced economies from Abbas and others (2011) as well as real GDP data from Maddison (2003) and other data from R&R (2010) (see Data Appendix for further details). Reflecting the availability and coverage of the supplementary data, we focus on the advanced economies in this paper. The average debt-to-GDP level in the sample is 55 percent while the average real output per capita growth rate is 2¼ percent. Given that the sample encompasses two world wars and the Great Depression, there are numerous outliers.
Differently from the analysis by R&R (2010), and closer in spirit to a growth regression, we focus on the long-term relationship between today’s stock of debt over GDP, bt, and GDP growth in the next h-yearsg hit( )yt h / yt. By taking a longer-term perspective we try to
mitigate the reverse causality effects that temporary recessions or bursts of growth can have on the debt-to-GDP ratio in the short run.
We start with a sample of all advanced economy episodes where gross public debt rose above a threshold .6
We then look at the real GDP growth per capita over the following h years, whereh[1,5,10,15]. We allow countries to have multiple, but not overlapping, episodes— i.e., a new episode cannot begin earlier than h years after the previous one begins. More precisely, for a country iand a given threshold , the beginning of an episode has to satisfy following conditions
5
See Abbas and others (2010) for a detailed description of the database which is available online on www.imf.org/external/datamapper/index.php?db=DEBT.
6 The starting date of a raising (declining) debt episode is the first year in which the debt-to-GDP ratio exceeds x percent, conditional on the ratio being below (above) x percent in the previous year. In a few instances, missing data prevent us from identifying the exact year in which the debt-to-GDP ratio crossed the x percent threshold. In these cases, we interpolate the data linearly and date the episode when the interpolated data shows the x percent threshold is crossed. Furthermore, given our focus on the 15 years after the threshold is crossed, we only consider episodes that begin by 1997 and, thus, end by 2012. We have experimented with different windows (e.g., 10 years and 20 years) and the results are essentially unchanged
1
, it it
b b and ∄ j[1,..., ]h s.t. bitj ,bit j 1.
A similar methodology has been followed by R&R (2012) who have traced the growth performance of countries during periods with debt above 90 percent of GDP. Our approach, however, differs from theirs along two important aspects. First, we consider a broad range of debt thresholds, not just 90 percent. Second, instead of considering only the period when debt remains above a certain level, we analyze the growth performance of the episodes over a given period of time regardless of the debt outcome. The advantage of this approach is that it avoids a particular truncation problem that arises when the end of an episode is defined based on the level of debt. Focusing on outcomes when debt is above a certain threshold implies selecting ‘failures’. In our case, we include countries that successfully reduce debt after rising above a given threshold as well as the ‘failures’ that are included in studies that only look at time periods when debt is above a certain threshold.
Before discussing the analytical results, we also note two important features of our methodology. First, by ruling out overlapping episodes and requiring that each episode begins with debt crossing a given threshold from below, each country is allowed to have only a relatively small number of episodes. These episodes are pooled together and weighted equally when computing averages. The approach followed by R&R (2010), based on the contemporaneous association between debt and growth, led to some countries having a vastly higher number of observations than others. Different weighting of these observations can potentially lead to significantly different conclusions as pointed out by Herdon, Ash, and Pollin (2013). Second, relative to the growth regressions used in some papers, our approach has the flexibility of not imposing a linear (or some arbitrary polynomial) relation between debt and growth.
IV. EMPIRICAL RESULTS
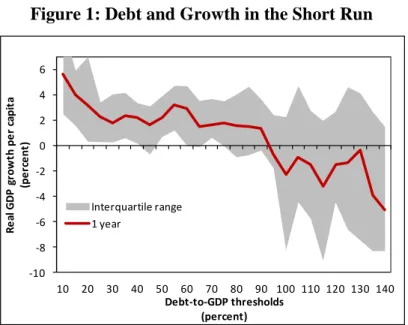
We begin the empirical analysis by focusing on the short run association between debt and growth, similarly to the approach followed by R&R (2010). Figure 1 shows the average real GDP growth rate per capita in the year after the debt-to-GDP ratio crosses a given threshold, that is, where h1.7
Consistent with R&R (2010), we observe that GDP growth is particularly low in the year after the debt-to-GDP ratio reaches levels above 90 percent. Indeed, this chart shows that GDP growth averages around 2 percent in countries with debt below 90 percent, and tumbles to about -2 percent in countries whose debt ratio increases above that level. At the same time, the inter-quartile range across all episodes reveals that the growth performance for countries with debt rising above 90 percent is quite diverse.
7 To maintain consistency in the sample when we look at longer time-horizons below, the exclusion window for episodes is based upon h=15. This does not affect the finding of a dramatic deterioration in growth performance above the 90 percent threshold seen in Figure 1.
Figure 1: Debt and Growth in the Short Run
It would be unwise, however, to look for a causal relation between debt and growth from Figure 1 because of the possibility of reverse causation mentioned above. While it is possible that when the debt-to-GDP ratio exceeds 90 percent countries enter a state of distress that leads to a substantial reduction in growth, it is equally possible that increases in public debt above 90 percent are driven by an omitted variable that reduces GDP and tax revenues that, in turn, leads to higher debt.
Furthermore, as suggested by the wide inter-quartile range, these results are relatively fragile and unduly influenced by outliers. For example, the debt-to-GDP ratio in Japan increases from 133 percent in 1943 to 204 percent in 1944, and the subsequent growth rate in 1945 was -50%. This observation alone leads to a considerable reduction in the average growth for debt thresholds above 135 percent of GDP.
Extending the horizon of analysis allows us to mitigate the bias in the analysis induced by reverse causality and potential omitted variables issues–it also attenuates the effects of outliers such as the growth observation for Japan in 1945. For example, automatic stabilizers mean that low growth will tend to have an effect on the primary balance, and, thus, on debt over a short-term horizon. Similarly, and even more mechanically, a recession will raise the debt to GDP ratio because the denominator decreases. If high debt (that is, debt above some threshold) operates as a drag on growth over anything but the short-run, however, we would expect to observe weak growth not only in the year after the debt ratio exceeds the threshold, but also during the subsequent years.
In Figure 2, we show the growth performance of the same episodes over longer horizons of
5,10,15.
h Relative to the previous case of h1, the growth performance improves -10
-8 -6 -4 -2 0 2 4 6
10 20 30 40 50 60 70 80 90 100 110 120 130 140
R
e
al
G
D
P
g
row
th
pe
r
ca
pi
ta
(pe
rc
e
nt
)
Debt-to-GDP thresholds (percent) Interquartile range
considerably even at a 5-year horizon.8 The improvement is particularly noticeable for
horizons of 10 and 15 years. Importantly, while higher debt is still associated with milder growth, there is no longer any clear debt-to-GDP threshold above which growth deteriorates sharply.
Figure 2: Debt and Growth over the Medium Run
In Figure 3, we analyze the possibility that the weakening relation between growth and debt over longer periods of time could reflect the fact that the debt-to-GDP ratio falls sharply after exceeding high thresholds. Figure 3 reveals that this is not the case. For any given debt threshold on the horizontal axis, the chart shows the average debt-to-GDP ratio during the 1, 5, 10, and 15 subsequent years. We observe that, while there is some tendency for the debt ratio to shrink when it reaches particularly high levels, the process is extremely slow. For example, countries that exceed the 140 percent debt thresholds experience an average debt ratio during the subsequent 15 years of 130 percent.
8 The sample of episodes is identical in each case as we maintain an exclusion window for new episodes of 15 years for all horizons.
-6 -4 -2 0 2 4 6
10 20 30 40 50 60 70 80 90 100 110 120 130 140
R
e
al
G
D
P
g
row
th
pe
r
ca
pi
ta
(pe
rc
e
nt
)
Debt-to-GDP thresholds (percent)
15 year interquartile range 15 years
10 years 5 years 1 year
Figure 3: Debt Dynamics over the Medium Term
So far we have considered only those episodes where the debt-to-GDP ratio increases above a given threshold. But what about countries that have a high, but falling, debt ratio? To investigate this we identify all episodes whose debt ratio falls below a certain level, that is:
1
, it it
b b and ∄ j[1,..., ]h s.t. bitj ,bit j 1.
Figure 4 compares the growth performance of these episodes with the previous ones. The left chart shows that the sharp reduction in growth that we observed in countries whose debt increases above 90 percent is no longer present for countries that have high debt on a declining path even at a 1-year horizon. In fact, even countries with debt ratios of 130–140 percent but on a declining path have experienced solid growth. This observation suggests that the high debt itself is not causing the low growth in these episodes but other factors,
associated with increasing debt, are more strongly implicated. Furthermore, even though we have abstracted from the short-term reverse causality issues by extending the horizon, as shown on the right hand side of Figure 4 the initial debt trajectory remains important even after 15 years. That is, the trajectory of debt appears to be an important predictor of
subsequent growth, buttressing the idea that the level of debt alone is an inadequate predictor of future growth.
0 20 40 60 80 100 120 140 160 180
10 20 30 40 50 60 70 80 90 100 110 120 130 140
A
ve
ra
ge
de
bt
-to
-G
D
P
(pe
rc
e
nt
)
Debt-to-GDP thresholds (percent) 15 year interquartile range 15 year
10 year 5 year 1 year 45-degree line
Figure 4: Debt and Growth Depend on the Debt Trajectory
V. ROBUSTNESS CHECKS
The episodes we consider occur throughout the 20th century. Over this time, average growth varied substantially, from lows during the Great Depression to highs during the 1950s. Thus, it is possible that our results are being distorted, for example, by the generally high growth rates experienced by all countries in the immediate post-WWII period. To control for this possibility, we compare the average growth rate during an episode with the simple average of growth rates for all economies over the same period: t( ) 1 it h/ it
i
g h y y
N
. For eachepisode we look at git( )h g ht( ) rather than the simple growth rate.
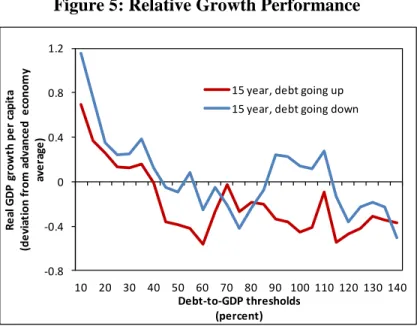
Figure 5 replicates the right hand side chart of Figure 4 when we use this measure of relative growth rather than absolute growth for each episode. What we find is that, generally
speaking, the growth performance of countries with high debt is fairly close to that of their peers—differences are less than ½ percent per year except at the lowest debt levels.
Furthermore, we observe that the country’s debt trajectory still matters. Among countries with the same debt levels, the growth performance over the next 15 years in countries where debt is decreasing is better than that in countries where it is increasing. This difference is statistically significant across the whole sample. It is particularly striking for debt levels between 90 and 115 percent of GDP (where average growth is ½ a percentage point higher).9
Furthermore, there is no unique threshold that is consistently followed by a subpar growth performance. In fact, Figure 3.5, panel 2 shows that countries with a debt level between 90 and 110 percent outperform the control group when debt is on a declining trajectory.
9 Countries with very low debt levels (e.g., below 25 percent of GDP) tend to have higher public debt levels after 15 years. In such cases, whether debt is increasing or decreasing at the time they cross the threshold has much less of an effect on the level of debt at the end of the episode.
-6 -4 -2 0 2 4 6
10 20 30 40 50 60 70 80 90 100 110 120 130 140
R e al G D P g row th pe r ca pi ta (pe rc e nt ) Debt-to-GDP thresholds (percent)
1 year, debt going up 1 year, debt going down
0 1 2 3 4 5
10 20 30 40 50 60 70 80 90 100 110 120 130 140
R e al G D P g row th pe r ca pi ta (pe rc e nt ) Debt-to-GDP thresholds (percent)
15 year, debt going up 15 year, debt going down
Figure 5: Relative Growth Performance
As an additional robustness check, Figure 6 considers the growth performance from 5 to 15 years after crossing a given debt-to-GDP threshold. In so doing, we remove from the analysis the first five years of each episode that could be significantly influenced by the channels of reverse causality from growth to debt mentioned earlier.10 The left chart shows the average
growth rates in absolute terms,git t,5(10) yt15/yt5, while the right chart considers the
growth rates relative to average growth rate in advanced economies, git t,5(10)gt t,5(10). Both charts show that with the removal of the first 5 years the relation between growth and debt becomes even flatter. Furthermore, we observe that even the direction of debt is no longer a clear predictor of growth, as can be seen from the various overlaps in average growth in the right-hand side chart.
10
While there is some correlation between growth one year and the next, in our sample there is none at a horizon of five years. In particular, a regression of growth at t+5 on growth a t finds a coefficient that is both statistically and economically insignificant. Thus, by excluding the first five years we are removing the effects of automatic stabilizers and serial correlation mentioned earlier that may tend to induce spurious correlations between debt and growth over short horizons.
-0.8 -0.4 0 0.4 0.8 1.2
10 20 30 40 50 60 70 80 90 100 110 120 130 140
R
e
al
G
D
P
g
row
th
pe
r
ca
pi
ta
(de
vi
at
ion
f
rom
a
dv
anc
e
d
e
con
om
y
av
e
ra
ge
)
Debt-to-GDP thresholds (percent)
15 year, debt going up 15 year, debt going down
Figure 6: Growth Performance from 5 to 15 Years after Crossing Debt Thresholds
VI. DEBT AND VOLATILITY
The previous empirical analysis suggests that high levels of debt are not, of themselves, necessarily associated with subpar growth over the medium term. However, it is possible that high levels of public debt may have implications for the volatility of GDP. For example, high levels of debt can induce fiscal and monetary policy reactions that increase output volatility, such as large front-loaded fiscal consolidation or temporary bursts of inflation. To shed some light on this issue, we apply our methodology to the relation between debt and GDP volatility (Figure 7). More precisely, given the episodes previously identified, we calculate the output volatility over those episodes in deviation from the average output volatility: it( )h t( )h where
1 1
1/ 2
0 0
( ) [ ( (1) (1) / )]
h h
it it j it k
j k
h g g h
while t( )h is simply the average standarddeviation of advanced economies’ GDP growth over the same period.11
11 Given the well established stylized fact that volatility has been trending down (see Blanchard and Simon 2001 or McConnell and Perez-Quiros 2000) the presence of a control group is more necessary than with growth rates. 0 1 2 3 4 5
10 20 30 40 50 60 70 80 90 100 110 120 130 140
R e al G D P g row th pe r ca pi ta (pe rc e nt ) Debt-to-GDP thresholds (percent)
5-to-15 year, debt going up 5-to-15 year, debt going down
-1.2 -0.8 -0.4 0 0.4 0.8 1.2
10 20 30 40 50 60 70 80 90 100 110 120 130 140
R e al G D P g ro w th p e r ca p it a (de vi at ion f rom a dv anc e d e con om y av e ra ge ) Debt-to-GDP thresholds (percent)
5-to-15 year, debt going up 5-to-15 year, debt going down
Figure 7: GDP Volatility during the 15 Years after Crossing Debt Thresholds
As in the case of output growth, we find no particular debt threshold above which output volatility jumps. However, notwithstanding the large inter-quartile range, there is a
suggestion of a positive relation between debt and output volatility. In particular, when debt increases above the sample mean (56 percent), countries tend to experience a relatively higher volatility.12
Note that the relation between debt and output volatility should be less affected by reverse causality since it is not obvious how an increase in output volatility has a mean effect on debt.
VII. CONCLUSIONS
Our analysis of historical data has highlighted that there is no simple threshold for debt ratios above which medium-term growth prospects are severely undermined. On the contrary, the association between debt and growth at high levels of debt becomes rather weak when one focuses on any but the shortest-term relationship, especially when controlling for the average growth performance of country peers. Furthermore, we find evidence that the relation
between the level of debt and growth is importantly influenced by the trajectory of debt: countries with high but declining levels of debt have historically grown just as fast as their peers. The fact that there is no clear debt threshold that severely impairs medium term growth should not, however, be interpreted as a conclusion that debt does not matter. For example, we have found some evidence that higher debt appears to be associated with more volatile growth. And volatile growth can still be damaging to economic welfare.
As in previous empirical studies, our analysis is still subject to potential endogeneity concerns that should caution against drawing strong policy implications. However, by mitigating the short-term and mechanical reverse causality problems whereby low growth
12 The small resurgence of volatility observed for debt falling at very low levels (below 20 percent, see left chart in Figure 7) might be related to reduction of debt occurred with hyper-inflation or default.
-3 -2 -1 0 1 2 3 4
10 20 30 40 50 60 70 80 90 100 110 120 130 140
St an d ar d D e vi at io n o f R e al GD P gr o w th p er c ap it a (d if fe re n ce f ro m a d va n ce d e co n o m y av e ra ge ) Debt-to-GDP thresholds (percent) Interquartile range 15 year, debt going down
-4 -3 -2 -1 0 1 2 3
10 20 30 40 50 60 70 80 90 100 110 120 130 140
St an d ar d D e vi at io n o f R e al GD P gr o w th p er c ap it a (d if fe re n ce f ro m a d va n ce d e co n o m y av e ra ge ) Debt-to-GDP thresholds (percent) Interquartile range 15 year, debt going up
leads to higher debt, we show that the prima facie case for debt thresholds is substantially weakened. We find no evidence of threshold effects over any but the shortest-term horizons. Furthermore, the remaining relationship between debt and growth is relatively muted and the magnitude is much smaller than the dramatic figures suggested in earlier studies.
Notwithstanding this, because of residual issues that confound the interpretation of the medium-term relationship between debt and growth, we emphasize that this does not
establish what the underlying structural relationship is. That must wait for more sophisticated work that can properly address the complex identification issues that characterized this area of research.
VIII. DATA APPENDIX
Data are mainly based on the IMF Fiscal Affairs Department database on gross government debt to GDP ratios that covers nearly the entire IMF membership back to 1875.13
We also use supplementary data on interest payments and primary deficits for 19 advanced economies from Abbas and others (2011) as well as real GDP data from Maddison (2003) and other data from Reinhart and Rogoff (2010).
The list of countries is given in Table 1. In few instances, mainly at times of war, we linearly interpolated internal missing values for GDP and debt to GDP ratio.
Table 1: Database coverage Real per capita GDP Debt/GDP
Start End Start End
Australia 1821 2011 1901 2010 Austria 1871 2011 1880 2010 Belgium 1847 2011 1880 2010 Canada 1871 2011 1870 2010 China,P.R.:Hong Kong 1951 2011 2001 2010
Cyprus 1970 2010
Czech Republic 1991 2011 1920 2010 Denmark 1821 2011 1880 2010 Estonia 1991 2011 1995 2010 Finland 1861 2011 1914 2010 France 1821 2011 1880 2010 Germany 1851 2011 1880 2010 Greece 1914 2011 1884 2010
Iceland 1951 2010
Ireland 1922 2011 1929 2010 Israel 1951 2011 1972 2011 Italy 1862 2011 1861 2010 Japan 1871 2011 1875 2012 Korea, Republic of 1912 2011 1958 2010 Luxembourg 1974 2010
Malta 1965 2010
Netherlands 1821 2011 1814 2010 New Zealand 1871 2011 1860 2010 Norway 1831 2011 1880 2010
13 See Abbas and others (2010) for a detailed description of the database which is available online on www.imf.org/external/datamapper/index.php?db=DEBT.
Portugal 1866 2011 1851 2010 Singapore 1851 2011 1963 2010 Slovak Republic 1991 2011 1992 2010 Slovenia 1991 2011 1993 2010 Spain 1851 2011 1880 2010 Sweden 1821 2011 1800 2010 Switzerland 1851 2011 1899 2010 Taiwan Prov.of China 1902 2011 1997 2010 United Kingdom 1831 2011 1830 2010 United States 1871 2011 1791 2010
REFERENCES
Abbas, S. M. Ali, Nazim Belhocine, Asmaa A. ElGanainy and Mark A. Horton, 2010, “A Historical Public Debt Database”, IMF Working Paper No. 10/245.
__________ , 2011, “Historical Patterns and Dynamics of Public Debt – Evidence from a New Database”, IMF Economic Review, Vol.59, No.4, pp. 717–42.
Baum, Anja, Cristina Checherita and Philipp Rother, 2013, “Debt and Growth: New
Evidence from the Euro Area”, Journal of International Money and Finance, Vol. 32, pp. 809–21.
Blanchard, Olivier, and John Simon, 2001, “The Long and Large Decline in U.S. Output Volatility,” Brookings Papers on Economic Activity, No. 1, Vol. 2001, pp. 135–74. Cecchetti, S. G., Mohanty, M.S., and F. Zampolli, 2011, “The Real Effects of Debt”, Federal
Reserve Bank of Kansas City, Economic Symposium 2011: Achieving Maximum Long-Run Growth, pp. 145–96.
Dippelsman, Robert, Claudia Dziobek, and Carlos A. Gutiérrez Mangas, 2012, “What Lies Beneath: The Statistical Definition of Public Sector Debt”, IMF Staff Discussion Note No. 12/09.
Herndon, Thomas, Michael Ash, and Robert Pollin, 2013, “Does High Public Debt
Consistently Stifle Economic Growth? A Critique of Reinhart and Rogoff”, Political Economy Research Institute, Working Paper No. 322.
International Monetary Fund, 2012, “The Good, the Bad, and the Ugly: 100 Years of Dealing with Public Debt Overhangs”, World Economic Outlook, Chapter 3 (Washington, DC).
Kumar, Manmohan, and Jaejoon Woo, 2010, “Public Debt and Growth”, IMF Working Paper No. 10/174, July (International Monetary Fund: Washington, DC).
Maddison, Angus, 2003, The World Economy: Historical Statistics (Paris: Organization for Economic Cooperation and Development).
McConnell, M. and G. Perez-Quiros, 2000, “Output Fluctuations in the United States: What Has Changed Since the Early 1980s?” The American Economic Review, Vol. 90, No. 5, pp. 1464–76.
Panizza, Ugo and Andrea F. Presbitero, 2012, "Public Debt and Economic Growth: Is There a Causal Effect?", MoFiR Working Paper No. 65.
Reinhart, Carmen M. and Kenneth S. Rogoff, 2010, “Growth in a Time of Debt”, American Economic Review: Papers & Proceedings, Vol. 100, No. 2, pp. 573–78.
Reinhart, Carmen M., Vincent R. Reinhart, and Kenneth S. Rogoff, 2012, “Public Debt Overhangs: Advanced-Economy Episodes since 1800”, Journal of Economic Perspectives, Vol. 26, No. 3, pp. 69–86.