NESCOR
Guide to Penetration
Testing for Electric Utilities
Version 3
National Electric Sector Cybersecurity
Organization Resource (NESCOR)
DISCLAIMER OF WARRANTIES AND LIMITATION OF LIABILITIES
THIS DOCUMENT WAS PREPARED BY THE ORGANIZATION(S) NAMED BELOW AS AN ACCOUNT OF WORK SPONSORED OR COSPONSORED BY THE ELECTRIC POWER RESEARCH INSTITUTE, INC. (EPRI). NEITHER EPRI, NOR ANY MEMBER OF EPRI, ANY COSPONSOR, THE ORGANIZATION(S) BELOW, NOR ANY PERSON ACTING ON BEHALF OF ANY OF THEM:
(A) MAKES ANY WARRANTY OR REPRESENTATION WHATSOEVER, EXPRESS OR IMPLIED, (I) WITH RESPECT TO THE USE OF ANY INFORMATION, APPARATUS, METHOD, PROCESS, OR SIMILAR ITEM DISCLOSED IN THIS DOCUMENT, INCLUDING MERCHANTABILITY AND FITNESS FOR A PARTICULAR PURPOSE, OR (II) THAT SUCH USE DOES NOT INFRINGE ON OR INTERFERE WITH PRIVATELY OWNED RIGHTS, INCLUDING ANY PARTY'S INTELLECTUAL PROPERTY, OR (III) THAT THIS DOCUMENT IS SUITABLE TO ANY PARTICULAR USER'S CIRCUMSTANCE;; OR
(B) ASSUMES RESPONSIBILITY FOR ANY DAMAGES OR OTHER LIABILITY WHATSOEVER (INCLUDING ANY CONSEQUENTIAL DAMAGES, EVEN IF EPRI OR ANY EPRI
REPRESENTATIVE HAS BEEN ADVISED OF THE POSSIBILITY OF SUCH DAMAGES)
RESULTING FROM YOUR SELECTION OR USE OF THIS DOCUMENT OR ANY INFORMATION, APPARATUS, METHOD, PROCESS, OR SIMILAR ITEM DISCLOSED IN THIS DOCUMENT. REFERENCE HEREIN TO ANY SPECIFIC COMMERCIAL PRODUCT, PROCESS, OR SERVICE BY ITS TRADE NAME, TRADEMARK, MANUFACTURER, OR OTHERWISE, DOES NOT NECESSARILY CONSTITUTE OR IMPLY ITS ENDORSEMENT, RECOMMENDATION, OR FAVORING BY EPRI.
THIS REPORT WAS PREPARED AS AN ACCOUNT OF WORK SPONSORED BY AN AGENCY OF THE UNITED STATES GOVERNMENT. NEITHER THE UNITED STATES GOVERNMENT NOR ANY AGENCY THEREOF, NOR ANY OF THEIR EMPLOYEES, MAKES ANY WARRANTY, EXPRESS OR IMPLIED, OR ASSUMES ANY LEGAL LIABILITY OR RESPONSIBILITY FOR THE ACCURACY, COMPLETENESS, OR USEFULNESS OF ANY INFORMATION, APPARATUS, PRODUCT, OR PROCESS DISCLOSED, OR REPRESENTS THAT ITS USE WOULD NOT INFRINGE PRIVATELY OWNED RIGHTS. REFERENCE HEREIN TO ANY SPECIFIC COMMERCIAL PRODUCT, PROCESS, OR SERVICE BY TRADE NAME, TRADEMARK, MANUFACTURER, OR OTHERWISE DOES NOT NECESSARILY CONSTITUTE OR IMPLY ITS ENDORSEMENT, RECOMMENDATION, OR FAVORING BY THE UNITED STATES GOVERNMENT OR ANY AGENCY THEREOF. THE VIEWS AND OPINIONS OF AUTHORS EXPRESSED HEREIN DO NOT NECESSARILY STATE OR REFLECT THOSE OF THE UNITED STATES GOVERNMENT OR ANY AGENCY THEREOF.
Primary Author: Justin Searle, Utilisec Contributers:
Galen Rasche, EPRI
Andrew Wright, N-Dimension Solutions Scott Dinnage, N-Dimension Solutions
Reviewers:
NESCOR Team 3 Members and Volunteers Annabelle Lee, EPRI
The research was paid for by the Department of Energy (DOE) under the NESCOR grant. Program Manager
Abstract
This security test plan template was created by the National Electric Sector Cybersecurity Organization Resource (NESCOR) to provide guidance to electric utilities on how to perform penetration tests on Smart Grid systems. Penetration testing is one of the many different types of assessments utilities can perform to assess their overall security posture. While NESCOR recommends that utilities engage in all other forms of security
assessment, NESCOR created this document to help utilities plan and organize their AMI penetration testing efforts. For a list of other types of Smart Grid security assessments, please see NESCOR’s whitepaper titled “Guide to Smart Grid Assessments.” This document covers penetration test plans for Smart Grid systems in general with specific guidance for Advanced Metering Infrastrucgure (AMI), Wide-Area Monitoring, Protection, and Control (WAMPAC), and Home Area Network (HAN). Additional guidance for other Smart Grid product domains are expected to be added in later revisions of this document. For more information on this or other NESCOR documents, see the NESCOR’s website at
www.smartgrid.epri.com/NESCOR.aspx
The objective of the NESCOR project is to establish an organization that has the
knowledge and capacity to enhance the effort of the National Electric Sector Cybersecurity Organization (NESCO) by providing technical assessments of power system and
cybersecurity standards to meet power system security requirements;; provide recommendations for threats and vulnerabilities, and participate in testing emerging security technologies in labs and pilot projects.
Certain commercial entities, equipment, or materials may be identified in this document in order to describe an experimental procedure or concept adequately. Such identification is not intended to imply recommendation or endorsement by NESCOR, nor is it intended to imply that the entities, materials, or equipment are necessarily the best available for the purpose.
Table of Contents
1 Introduction . . . 6
2 Penetration Test Scoping . . . 8
3 Target System Setup . . . 11
3.1 Advanced Metering Infrastructure (AMI) . . . 11
3.2 Demand Response (DR) . . . 14
3.3 Distributed Energy Resources (DER) . . . 15
3.4 Distribution Grid Management (DGM) . . . 18
3.5 Electric Transportation (ET) . . . 18
3.6 Wide Area Monitoring, Protection, and Control (WAMPAC) . . 19
4 Embedded Device Penetration Tasks . . . 22
4.1 Electronic Component Analysis . . . 24
4.2 Field Technician Interface Analysis . . . 28
4.3 Firmware Binary Analysis . . . 32
5 Network Communications Penetration Tasks . . . 35
5.1 RF Packet Analysis . . . 37
5.2 Network Protocol Analysis . . . 39
6 Server OS Penetration Tasks . . . 44
6.1 Information Gathering . . . 45
6.2 Vulnerability Analysis . . . 47
6.3 Server OS Exploitation . . . 48
7 Server Application Penetration Tasks . . . 50
7.1 Application Mapping . . . 51
7.2 Application Discovery . . . 53
7.3 Application Exploitation . . . 55
8 End-to-End Penetration Test Analysis . . . 57
1
Introduction
This document was created for electric utilities to use in their security assessment of Smart Grid and other energy management systems. Smart Grid security assessments can be broken into several categories. This document focuses only on penetration testing and attempts to help utilities break down the complex process of penetration testing. Penetration testing is a specialized form of hands-on assessment where the testing team takes on the role of the attacker and tries to find and exploit vulnerabilities in systems and devices. Testers use the same methodology that attackers use to identify vulnerabilities in a system, which is usually a semi-blind exploratory interaction with the system looking for both previously-known and previously-unknown vulnerabilities in the target system. Once a vulnerability is found, the testers attempt to exploit the flaw to gain a foothold in the system and begin the process again to discover additional, lower level vulnerabilities that weren’t previously exposed. Penetration testing is distinguished from vulnerability assessment techniques by the fact that they test for a depth of vulnerabilities instead of simply breadth, focus on discovering both known and unknown vulnerabilities, and provide the testing team with a better understanding of a particular vulnerability’s risk to the business through the vulnerability’s exploitation.
This document is intended to help electric utility security teams plan their penetration testing activities and understand rough levels of effort they should expect when performing these types of tests. When electric utilities do not have staff with the appropriate understanding or skill to perform penetration testing in-house, this document can be used in their services procurement processes to understand potential scope, plan budgets, create RFP documents, and evaluate the responses from firms offering penetration-testing services.
This document breaks the process of penetration testing into logical tasks. These tasks are organized into logical categories based on the skill set of the testing team, each category represented by major sections in this document. Not all penetration testers have the skill set to perform all of the tasks. In most cases, the testing team will be made up of at least two individuals, each with unique but (hopefully) somewhat overlapping skill sets. Because of the nature of penetration testing, the tasks in this document are high level and intended to break the overall penetration test into logical components that can be assigned to testing team members to be completed in a systematic manner. This document does not contain detailed, tool specific, step-by-step procedures for each task, but provides high-level descriptions of how a task is performed and the overall goals for each task in a Penetration Test.
Results of penetration testing tasks are not expected to be fully repeatable or comparable from one utility to another utility, or from one testing team to another testing team. While all vulnerabilities found by the penetration testing team should be repeatable and verifiable by other organizations when given details of the vulnerability, the results of each penetration test is highly dependent on the skill set of the testing team, and the discovery of those vulnerabilities will vary from testing team to testing team. Because of these factors, the
results of these penetration-testing tasks are not intended to be used by regulatory bodies or shared outside of the utility, with the exception of sharing these results with the
2
Penetration Test Scoping
Penetration testing should be performed on a periodic basis depending on the criticality of the targeted system. This can be performed as a broad penetration test encompassing several control systems (such as an entire testing or staging control network), a targeted penetration test with a restricted scope of a single control system (management server to its controlled devices), or to test a single component of a larger system, such as a historian or a reclosure. NESCOR recommends performing this type of assessment in testing or staging environments on an annual basis or after any major systems upgrades or changes to the systems in question.
Penetration tests should start with a review of the target architecture to help the testing team gain a deeper knowledge of the target system. This will help the testing team understand the intended functionality of the targeted system, its expected security posture from an architectural perspective, and the security risks that a vulnerability could pose to the organization. This is best performed through interviews with knowledgeable experts from both the product’s vendor and the utility or asset owner deploying the target system. Each penetration-testing task listed in this document contains an estimated level of effort, a task description, and a task goal. The level of effort for each task assumes a single target. For example, if a task involves analyzing dataset for cryptographic keys and is labeled “medium” effort, this signifies that the analysis of each distinct dataset should be calculated as a separate medium level effort. The analysis of multiple datasets could aggregate to a “medium” or “high” level of effort depending on the exact relative nature of those datasets. The following table was used to estimate the number of hours an experienced tester of the applicable skill set would take to complete each task:
Level of Effort Number of Hours
Low 1-4
Medium 5-16
High 17-40
Extremely High 41+
The penetration-testing tasks included in this document were created to be used generically on all types of Smart Grid and energy management systems. Therefore, individual penetration-testing tasks may or may not apply depending on the specific system
being tested. The testing team that is performing the tasks should determine which tests are applicable to accomplish their goals.
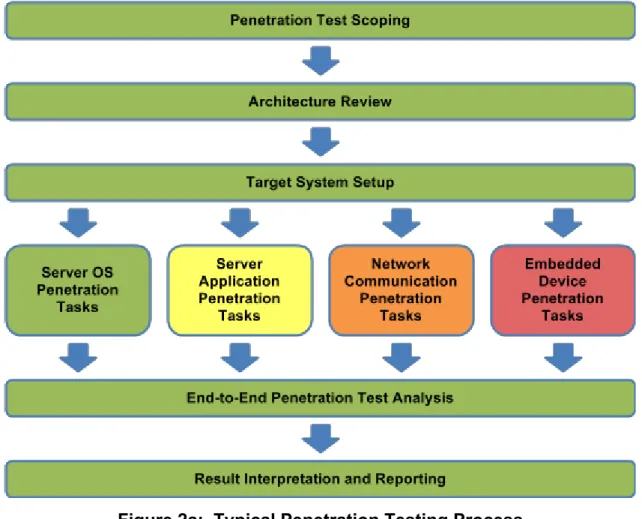
Figure 1 demonstrates how the following sections of this document interrelate to each other and when they are initiated in a typical penetration test. This diagram shows the overall process flow of a typical penetration test as described in this document. Each box represents a major section in this document and shows which sections need to be performed in serial and which sections can be performed in parallel.
Figure 2a: Typical Penetration Testing Process
All penetration tests should start with proper planning and scoping of the engagement. Once that is complete, the penetration testing tasks can be broken into the four distinct task categories displayed in Figure 2a. Each of these task categories also requires different skill sets from the testing team. If there is sufficient staff, these four penetration task categories can be performed in parallel. Once these tasks are completed, the team should perform a gap analysis to verify all desired tests have been performed and all goals met. Finally, the team should generate a report documenting their findings, interpret these findings in the context of the utility’s deployment, and develop recommendations to resolve
or mitigate these vulnerabilities.
The color difference of these four penetration task categories in Figure 2a represents the relative likelihood that a utility should consider performing these tasks. These recommendations are based a combination of trends that NESCOR has seen in the industry and the level of expertise needed to perform these tests. To some degree, this also represents the relative risk target systems represent to the utility, as compromise of the control servers are generally considered a higher risk than the compromise of a single embedded field device or its network communications.
The colors in Figure 2.a can be interpreted as:
● Green: Tasks that should be performed most frequently, require the most basic of penetration testing skill, and can often be performed by internal security teams. ● Yellow: Tasks that are commonly performed and require moderate penetration
testing skill.
● Orange: Tasks that are occasionally performed but may require higher levels of expertise.
● Red: Tasks that are infrequently performed and require highly specialized skills not often found in-house.
These colors are used in the diagrams presented in each major task category throughout the rest of this document.
Each penetration task category in this document provides an overview of tasks that could be performed in any given penetration test. Penetration test planning should consider these lists of tasks and determine which tasks are appropriate to meet their desired goals of the penetration test. Some tests may include all tasks, other tests may only include tasks from one testing category, and other tests may include a small percentage of tasks from multiple testing categories. Any number of factors could drive these decisions, but the most common reasons for excluding a task from the assessment is budgetary restrictions, lack of applicability of a particular task, or unjustifiable risk to system or device.
Each test category lists the types of tools needed for the tasks in that category. This list should not be considered prescriptive or complete, but rather a short sampling of tools to help point testing teams in the right direction. The tools needed will vary between individual testers, systems being tested and will change over time. Needed tools should be
3
Target System Setup
Penetration tests should be performed on non-production systems and devices that are installed and configured for functional operation in testing or staging environments. The closer the target systems are configured to their production counterparts, the more accurate an assessment you will receive. This includes interconnectivity to dependent systems communicating with the targeted systems, regardless if those systems are in or out of scope for the penetration test. In cases where testing and staging environments do not exist, the testing team could select non-intrusive, low-risk penetration-testing tasks that can be done on production systems. NESCOR will not give guidance on which tasks are low-risk;; this can only be determined by the testing team familiar with the target system. The nature of penetration testing is a trial and error method, often with unforeseen consequences in the systems being tested. Utilities would be wise to invest in testing or staging environments if they do not currently exist.
Specific guidance for system setups of each Smart Grid product domain follows.
3.1 Advanced Metering Infrastructure (AMI)
AMI systems should be setup to includes all components from the meter to the headend, and if in-scope, other data center servers communicating with the headend such as MDMS or Customer Information Systems (CIS) that may communicate with the headend system or any other AMI component. At a minimum, this document assumes functional communication from the meter to the headend, and this has been established before the penetration test begins. Furthermore, it is assumed that the testers have physical access to all devices in the test environment to perform penetration tasks.
AMI systems have been architected in a variety of different approaches. Figure 3.1a depicts a number of the most common architectures, including intermediate devices and possible communication links between the meter and the headend. This diagram attempts to include all major architecture types commonly deployed, however this means only a portion of this diagram may pertain to a specific utility. Therefore, this common
architecture should be customized and tailored for specific AMI systems depending on the deployed devices and communication protocols.
Testers should be familiar with existing communication protocols that pass among different components within AMI infrastructures. Figure 3.1b depicts generic dataflows most AMI systems use in their communications between the headend and each meter.
Each one of the generic dataflows listed in Figure 3.1b represents a system functionality that attackers may leverage in their attacks. Testers should familiarize themselves with the administrative interface to the functionalities on both the meter and the headend sides. This knowledge will greatly aid testers during actual testing and enable them to trigger certain events when needed, such as initiating a firmware update while attempting to capture the update in one of the penetration test tasks.
Penetration testing tools play a key role in the testing process. Depending on the AMI component being testing, tools may not exist for each task. For example, at the time of writing, there were very few tools available to aid testers in the generation of common AMI communication protocols such as C12.18 (for optical communications on the meter) and C12.22 for meter-to-headend communication. If time and tester skill set permit, the tester can develop these tools as part of the testing. The level of effort for such tool development should be scoped as High (17-40 hours) or Extremely High (40+ hours).
3.2 Demand Response (DR)
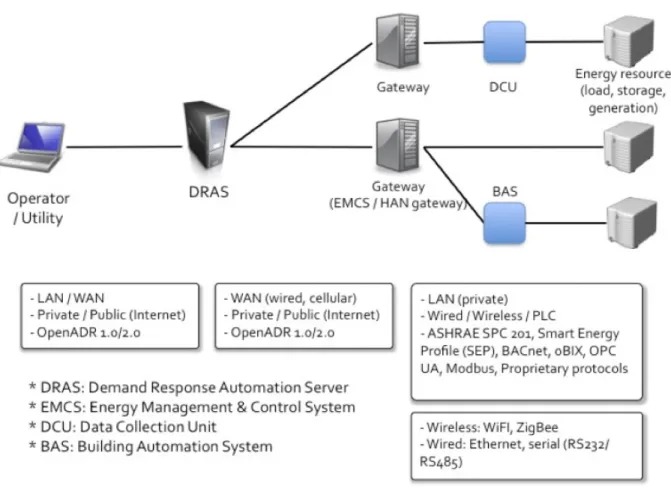
Demand Response (DR) systems should be setup to include all components from the energy resources and the gateway to the DR server (DRAS). The gateway is usually either an EMCS (Energy Management and Control System) or a HAN (Home Area Network) gateway and runs a DR client program that communicates with the DRAS. It also communicates with various types of energy resources (load, storage, and generation) to collect energy data and to send control commands. DR systems may include other intermediate devices. A customer facility may already have had a legacy BAS (Building Automation System) that has a control over some energy resources (e.g., HVAC). A DCU (Data Collection Unit) may be installed within the customer facility where energy resources are not connected to the gateway directly. Unlike the BAS, a DCU only forwards communication messages between the gateway and the energy resources. If either the BAS or the DCU is used in DR systems, the gateway indirectly communicates with the energy resources. An operator (e.g., a manager of ISO or a utility company) accesses the DRAS to begin a DR program event. At a minimum, this document assumes functional communication from the energy resources to the DRAS. Furthermore, it is assumed that the testers have physical access to all devices in the test environment to perform penetration tasks.
DR systems can be architected in a variety of different approaches. Figure 3.2 depicts a number of the most common architectures, including intermediate devices and possible communication links between the gateway and the DRAS. This diagram attempts to include all major architecture types commonly deployed, however this means only a portion of this diagram may pertain to a specific utility. Therefore, this common architecture should be customized and tailored for specific DR systems depending on the deployed components and communication paths.
Figure 3.2a: Common DR Architecture
3.3 Distributed Energy Resources (DER)
Distributed Energy Resources (DER) systems are “cyber-physical” systems that can provide energy and ancillary services to the power grid, typically through the distribution system. DER systems can be generators, storage devices, and even electric vehicles if their chargers are capable of managing the charging and discharging processes. Generally these DER systems are small (usually much less than 50 MW), but potentially there will be thousands if not millions of DER systems interconnected with the distribution system.
DER systems should be setup to includes all components from the DER Generation and Storage devices installed on the customer premises to the DER Management Server communicating with those devices, including other intermediate devices such as the Customer Energy Management System. At a minimum, this document assumes functional communication from the DER managed resources to the DER management server. Furthermore, it is assumed that the testers have physical access to all devices in the test environment to perform penetration tasks.
a number of the most common architectures. This diagram includes examples of various DER managed devices commonly deployed, however this means only a portion of this diagram may pertain to a specific utility. Therefore, this common architecture should be customized and tailored for specific DER systems depending on the deployed components and communication paths.
3.4 Distribution Grid Management (DGM)
Distribution Grid Management (DGM) systems manage a wide array of sub-systems in an electric utility’s electric grid. Devices that are often monitored and controlled are: automated reclosures, remote fault indicators, capacitor Banks, automated switches, load monitors, and substation relays. Often penetration testing is focusing on only one or two of these subsystems, so system setup before testing should take this in account. At a minimum, the controlled field device, the vendor’s management server that configures the device, and the DGM servers that monitors and controls that device should be in-scope. The following diagram shows a sample of various devices in a substation that can be monitored and controlled by DGM systems.
Figure 3.4a: Typical DGM Controlled Substation Network
3.5 Electric Transportation (ET)
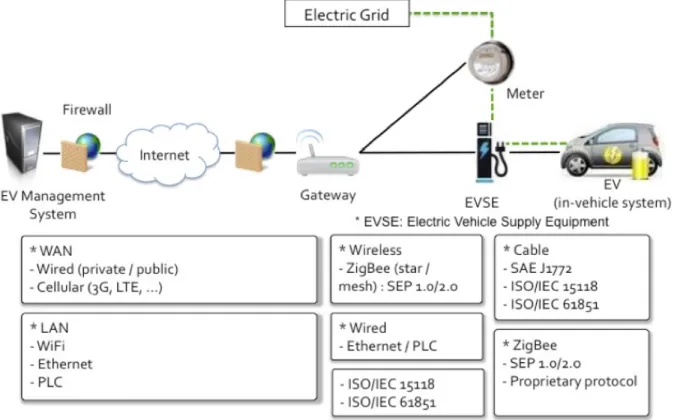
Electric Transportation (ET) systems should be setup to include all components from the Electric Vehicle (EV) and the Electric Vehicle Supply Equipment (EVSE) to the EV Management Server that communicates with the EVSEs. The EV may have an in-vehicle system that is connected to the battery through the vehicle’s Car Area Network (CAN) that
exchanges data with the EVSE via a wireless channel or PLC. The EVSE in a charging station usually includes a control unit, J1772 interface, and a communication module. ET systems also include other intermediate devices. A meter measures power usage for each EVSE. A gateway collects data from the meters and the EVSEs and transmits the data to the EV Management Server. At a minimum, this document assumes functional communication from the EVSE to the EV management server. Furthermore, it is assumed that the testers have physical access to all devices in the test environment to perform penetration tasks.
ET systems can be architected in a variety of different approaches. Figure 3.5 depicts a number of the most common architectures, including intermediate devices and possible communication links between the EVSE and the EV management server. This diagram attempts to include all major architecture types commonly deployed, however this means only a portion of this diagram may pertain to a specific utility. Therefore, this common architecture should be customized and tailored for specific ET systems depending on the deployed components and communication paths.
Figure 3.5a: Common ET Architecture
3.6 Wide
Area
Monitoring,
Protection,
and
Control
(WAMPAC)
generate, receive, and utilize this synchrophasor data. WAMPAC systems should be setup to include all components from the Phasor Measurement Unit (PMU) to the WAMPAC applications leveraging that data, including other intermediate devices such as the servers that manage the PMUs, devices that provide alignment services like Phasor Data Concentrators (PDCs), phasor gateways, phasor data stores, and other such components. At a minimum, this document assumes functional communication from the PMU, its management server, and the first layer of PDCs that receive data directly from the PMU. Furthermore, it is assumed that the testers have physical access to all devices in the test environment to perform penetration tasks.
WAMPAC systems can be architected in a variety of different approaches. Figure 3.6a depicts a number of the most common architectures, including intermediate devices and possible communication links between the syncrophasor and its dependent applications. This diagram attempts to include all major architecture types commonly deployed, however this means only a portion of this diagram may pertain to a specific utility. Therefore, this common architecture should be customized and tailored for specific WAMPAC systems depending on the deployed components and communication paths.
4
Embedded Device Penetration Tasks
This section addresses the testing of field-deployed, embedded, microprocessor based devices which are reasonably exposed to physical attack. Hardware that is commonly deployed in areas where attackers could easily gain physical access such as on customer premises, pole-tops, or in substations should be tested using the tasks listed below. These tasks target electronic components inside these field deployed devices, namely those microchips that store data (EEPROM, Flash, RAM, MCU on-chip storage), buses that pass data between components (parallel buses and serial buses), and input interfaces used for administrative or debugging purposes (serial ports, parallel ports, infrared/optical ports). The following table will help map specific components that should be considered for each Smart Grid product domain.
AMI ● Meters ● Relays ● Aggregators ● Access points DR ● Energy resources ● DCUs
DER ● DER managed generation and storage devices ● Customer Energy Management System
DGM ● Automated Reclosures
● Remote Fault Indicators ● Capacitor Banks
● Automated Switches ● Load Monitor
● Substation Breakers ET ● In-vehicle system (EV)
● Meters connected to the ET system ● Control units (EVSE)
● ET Gateways
WAMPAC ● PMUs
● Devices which include PMU capabilities ● Field deployed PDCs
The overarching goal for embedded device testing is to identify vulnerabilities that allow attackers to expand their control of that single device to other devices with limited or no physical access to those other devices. For example, in AMI systems, a tester might successfully retrieve an AMI meter’s C12.18 master password, a password that protects the optical interface on the front of a meter, enabling the tester to directly interface with the optical port on other meters without having to disconnect or dismantle the other meters. This assumes that the master C12.18 password is used throughout the smart meter deployment, which unfortunately is often the case in AMI systems.
Figure 4a below shows the overall process flow of the task sub-categories in this section. The figure shows the three task sub-categories may be performed in parallel. As in
previous diagrams in this document, the colors represent the recommended likelihood that a utility should consider performing these task sub-categories, and the relative level of expertise required.
Figure 4a: Embedded Device Subcategory Flow
Each subcategory below includes a similar diagram depicting the process flow and recommended likelihood to perform each task.
Suggested Tools:
● Basic tools such as screw drivers, wire cutters, pliers, tin snips, etc.
● Electronics equipment such as power supply, digital multimeter, and oscilloscope ● Electronic prototyping supplies such as breadboard, wires, components, alligator
jumpers, etc.
● Specialized tools to communicate directly with individual chips or capture serial communications such as a Bus Pirate or commercial equivalent such as Total Phase Aardvark/Beagle.
● Universal JTAG tool such as a Bus Blaster, GoodFET, or a RIFF Box ● Surface mount micro test clips
● Electric meter test socket
● Disassembler Software for the appropriate microprocessors to be tested ● Entropy Analysis Software
4.1 Electronic Component Analysis
This subcategory of penetration tasks focuses on the identification design weaknesses in the electronic components. Often these weaknesses show themselves in unprotected storage or transfer of sensitive information such as cryptographic keys, firmware, and any other information that an attacker can leverage to expand his attack. Primary targets for each Smart Grid product domain are:
AMI ● C12.18 passwords for optical ports
● Any cryptographic keys used in communications with other devices (C12.21, C12.22, DLMS/COSEM, or other protocols the embedded field device uses)
● Firmware used on any meter, relay, or aggregator (usually one per MCU on each device)
DR ● Cryptographic keys used in communications with: ○ EMCS and DRAS
○ Other devices in the HAN (such as SEP) ● Firmware on the field devices such as:
○ Energy resources ○ DCU
○ BAS ○ Gateways
DER ● Cryptographic keys stored and used on:
○ DER Managed generation and storage devices ○ Customer Energy Management Systems ● Firmware stored and transferred to:
○ DER managed generation and storage devices ○ Customer Energy Management System
DGM ● Cryptographic keys and firmware used on: ○ Automated Reclosures
○ Remote Fault Indicators ○ Capacitor Banks
○ Automated Switches ○ Load Monitor
○ Substation Breakers
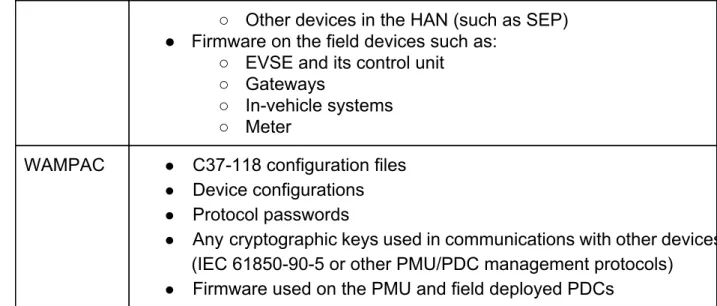
ET ● Cryptographic keys used in communications with: ○ EVMS
○ Other devices in the HAN (such as SEP) ● Firmware on the field devices such as:
○ EVSE and its control unit ○ Gateways
○ In-vehicle systems ○ Meter
WAMPAC ● C37-118 configuration files ● Device configurations ● Protocol passwords
● Any cryptographic keys used in communications with other devices (IEC 61850-90-5 or other PMU/PDC management protocols) ● Firmware used on the PMU and field deployed PDCs
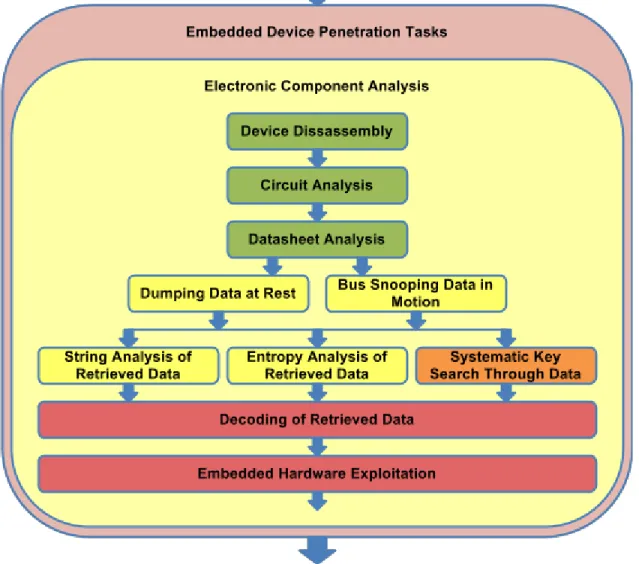
Figure 4.1a: Electronic Component Analysis Task Flow
4.1.1 Device Disassembly
Level of Effort: Low
Task Description: Disconnect power from the device and disassemble the device to gain access to the embedded electronic components. Attempt to do a non-destructive disassembly if possible. Document the entire process to later facilitate reassembly. Identify the existence and function of any physical tamper mechanisms protecting the device.
Task Goal: Gain physical access to embedded components and electronic buses for further testing. Identify any methods that could be used to bypass the tamper mechanisms.
4.1.2 Circuit Analysis
Task Description: Document the electronic circuit by taking pictures, reading chip IDs, tracing buses, and identifying major electronic functionality.
Task Goal: Gain information about the embedded hardware and identify potential electronic components for attack.
4.1.3 Datasheet Analysis
Level of Effort: Medium
Task Description: Find, download, and analyze all pertinent datasheets and related documentation for each major electronic component inside the device, to identify possible security weaknesses and attack angles.
Task Goal: Gain information about the function of each component and how to interface directly with each component. Identify target components and buses for following tasks.
4.1.4 Dumping Embedded Circuit Data at Rest
Level of Effort: Medium
Task Description: Using the datasheets, identify the pins necessary to perform data dumping. With the device powered off, connect your testing tools and perform the dump. If needed, be sure to disable any other component by triggering reset pins or by using other methods. Review the dumped data to determine if you were successful. Attempt multiple dumps and compare the results if you are doubtful about your success.
Task Goal: Obtain all data from unprotected storage devices for later analysis.
4.1.5 Bus Snooping Embedded Circuit Data in Motion
Level of Effort: Medium
Task Description: Using the datasheets previously obtained, identify the pins and traces needed to perform bus snooping. With the device powered off, connect the testing tools and begin capture. Power on the device and capture sufficient data samples from each target bus. Review dumped data to identify if you were successful. Attempt multiple dumps and compare results if you are doubtful about your success.
Task Goal: Obtain data samples from all major buses for later analysis.
4.1.6 String Analysis of Retrieved Data
Level of Effort: Low
Task Description: Use tools and multiple decoding methods to decode each obtained data. Within the logical context of the data source, identify human readable strings and other anomalies. Other identifiers may be byte patterns signifying where firmware image files begin and end.
Task Goal: Identify symmetric cryptographic keys, firmware images, and other items of interest.
Level of Effort: Low to Medium
Task Description: Analyze obtained data sets for blocks of data that portray high levels of entropy. Small data blocks with high entropy often signify asymmetric cryptographic keys and usually correspond to common key length sizes. Larger data blocks with high levels of entropy often signify encrypted data. Attempt to use suspected cryptographic keys to decrypt encrypted data blocks or encrypted communications traffic.
Task Goal: Identify asymmetric cryptographic keys and encrypted data objects.
4.1.8 Systematic Key Search Through Data Sets
Level of Effort: Low
Task Description: Use tools to identify cryptographic keys by attempting to use possible blocks of data from each obtained data set as the cryptographic key. For instance, if the tool is trying to identify a 128 bit symmetric key, the tool will systematically attempt to use each 128 bit data block as a potential cryptographic key to decrypt a known block of encrypted data or a known capture of encrypted communications traffic. In this case, the tool will try bits 0 through 127 as a potential cryptographic key, then try bits 1 through 128, then bits 2 through 129, and so on.
Task Goal: Identify symmetric and asymmetric cryptographic keys.
4.1.9 Decoding of Retrieved Data
Level of Effort: High
Task Description: Reverse engineering of the data in an attempt to understand its purpose. For instance, testers could attempt to understand the captured data blocks to determine what each set of bytes represent in the serial bus protocol or the data stored in the flash/EEPROM chips. This could be done by sending known commands or setting known configurations and attempting to identify in the data blocks where those commands and configurations are transmitted and stored.
Task Goal: Identify the purpose of blocks of data that could be used in exploitation attempts.
4.1.10 Embedded Hardware Exploitation
Level of Effort: High to Extremely High
Task Description: Based on the findings from previous tasks, determine feasible attacks that can be launched on the embedded components.
Task Goal: Create proof of concept attacks to demonstrate the feasibility and business risk created by the discovered vulnerabilities.
4.2 Field Technician Interface Analysis
Most embedded devices provide physical interfaces for local configuration and debugging. The tasks in this sub-category target any serial-based management port or physical
interfaces on deployed field devices. Non-serial based management interfaces such as web based interfaces accessible via network interfaces are addressed in the “Server Application Penetration Tasks” section later in this document. Primary targets for each Smart Grid product domain are:
AMI ● Infrared optical port on the front of meters often using the C12.18 protocol for communications.
● Administrative interfaces such as serial ports (RS-232) and other physical administrative interfaces on:
○ Relays ○ Aggregators ○ Access points ○ Routers
DR ● RS-232 and other serial interfaces, or physical interfaces on: ○ Energy resources
○ DCUs
DER ● Administrative interfaces such as serial ports (RS-232) and other physical administrative interfaces on:
○ DER managed generation and storage devices ○ Customer Energy Management System
DGM ● Administrative interfaces such as serial ports (RS-232) and other physical administrative interfaces on:
○ Automated Reclosures ○ Remote Fault Indicators ○ Capacitor Banks
○ Automated Switches ○ Load Monitor
○ Substation Breakers
ET ● RS-232 and other serial interfaces, or physical interfaces on: ○ Meters
○ Control units ○ Gateways.
WAMPAC ● Administrative interfaces such as serial ports (RS-232) and other physical administrative interfaces on:
○ PMUs
○ Dield deployed PDCs
○ Field deployed phasor gateways
This subcategory of penetration tasks focuses on the analysis and identification of vulnerabilities in these interfaces. Figure 4.2a shows a typical task flow for testing field technician interfaces.
Figure 4.2a: Field Technician Device Task Flow
4.2.1 Interface Functional Analysis
Level of Effort: Low
Task Description: Obtain required software and hardware to establish an appropriate connection to the field device, be it a serial port, infrared port, or digital display. Identify the intended functionality and features of the interface. Identify any unprotected or high-risk functions that attackers may be interested in exploiting, such as firmware updates, configurations, or security table reads.
should be targeted for later tasks.
4.2.2 Field Technician Interface Communications Capture
Level of Effort: Low
Task Description: Use a hardware or software tool to intercept normal communications on the interface. Capture all identified target functions from previous tasks.
Task Goal: Obtain low-level capture of targeted functions.
4.2.3 Field Technician Interface Capture Analysis
Level of Effort: Medium
Task Description: Analyze interface captures, identifying weaknesses in authentication, authorization, and integrity controls. Gain an understanding of how data is requested and commands are sent. If the protocol uses authentication, attempt to identify the passwords or keys being sent before a session is established. For example, in the case of protocols such as C12.18 for AMI meters, attempt to identify the different levels of passwords being sent before each command.
Task Goal: Identify potential vulnerabilities and attacks.
4.2.4 Field Technician Interface Endpoint Impersonation
Level of Effort: Low to Medium
Task Description: Use an attack tool to impersonate either end of the field technician interface. For instance, this attack tool could simulate the field technician tool while communicating with the field device interface, or the attack tool could simulate the field device interface while communicating with the field device tool.
Task Goal: Obtain a usable attack point to perform later tasks.
4.2.5 Field Technician Interface Fuzzing
Level of Effort: Medium to High
Task Description: Use or create a fuzzing tool to send both valid and invalid communications to the target interface, analyzing the results and identifying anomalies. This task includes items such as password guessing, invalid input testing, data enumeration, etc.
Task Goal: Identify vulnerabilities in the interface implementation and obtain data not otherwise available from any field device vendor tool provided to the utility.
4.2.6 Field Technician Interface Exploitation
Level of Effort: High to Extremely High
Task Description: Based on the findings from previous tasks, determine feasible attacks that can be launched on the field technician interface. Attempt to use any authentication or cryptographic keys retrieved from one meter on different meters to identify shared passwords and cryptographic keys.
Task Goal: Create proof of concept attacks to demonstrate the feasibility and business risks created by the discovered vulnerabilities.
4.3 Firmware Binary Analysis
This subcategory of penetration tasks focuses on the identification of vulnerabilities in binary firmware. These tasks do not describe traditional software source code review, rather they describe the techniques that attackers would use when they gain access to a firmware image in binary format and do not have access to the firmware’s original source code. Binary analysis is very time intensive and could be of limited benefit compared to an actual source code review focusing on security flaws. These tasks are primarily provided as an alternative for those utilities and organizations that do not have access to the source code of the products they are testing. It is expected that very few utilities will perform this subcategory of penetration tasks. For those parties interested in this type of analysis, consider the following firmware images in each Smart Grid product domain.
AMI ● Meters ● Relays ● Aggregators ● Access points ● Routers DR ● Energy resources ● DCU ● BAS ● Gateways
DER ● DER managed generation and storage devices ● Customer Energy Management System
DGM ● Automated Reclosures
● Remote Fault Indicators ● Capacitor Banks ● Automated Switches ● Load Monitor ● Substation Breakers ET ● In-vehicle systems ● Meters ● Gateways
● EVSE and its Control units
● Devices which include PMU capabilities ● Field deployed PDCs
● Field deployed phasor gateways
Figure 4.3a shows a typical task flow for analysing device firmware images in their binary format.
Figure 4.3a: Firmware Binary Analysis Task Flow
This subcategory of penetration tasks assumes the firmware was obtained in previous tasks or provided directly to the tester.
4.3.1 Firmware Binary Disassembly
Level of Effort: Medium
Task Description: If firmware is successfully retrieved and the tester has sufficient time and skill, disassemble the firmware and attempt to identify vulnerabilities in the instruction calls. Warning, this task often proves very difficult as many microprocessors do not have publicly available decompilers. Consequently, one may need to be created first would could result in this becoming an “Extremely High” level of effort.
Task Goal: Obtain a human readable version of the firmware for later analysis.
Level of Effort: High to Extremely High
Task Description: Identify weaknesses in memory use, loop structures, cryptographic functions, interesting functions, etc. This could also include the extraction of cryptographic keys or algorithms hardcoded into the firmware.
Task Goal: Identify vulnerabilities that can be exploited.
4.3.3 Firmware Binary Exploitation
Level of Effort: High to Extremely High
Task Description: Based on the findings from previous steps, determine feasible attacks which can be launched at the firmware. For instance, cryptographic materials found in the firmware could be used to access protected networks and devices, or buffer overflow like attacks could be leveraged to run arbitrary code on remote devices.
Task Goal: Create proof of concept attacks to demonstrate the feasibility and business risk created by the discovered vulnerabilities.
5
Network Communications Penetration Tasks
This section pertains to the testing of network communications for the smart grid systems, such as field area networks. Primary targets include wireless medium, network protocols, network segmentation controls, etc. The overarching goal is to identify vulnerabilities that allow an attacker to control network traffic or to subvert a device through protocol manipulation. The following table will help map specific communications channels that should be considered for each Smart Grid product domain.
AMI ● Communications between Meter and aggregator ● Communications between Aggregator and headend
● Communications between Meter and headend in direct communication architectures
● Communications between Headend and other systems such as the MDMS
DR ● Communications between Energy resource and DCU ● Communications between DCU and gateway
● Communications between Energy resource and BAS ● Communications between BAS and gateway
● Communications between Energy resource and gateway ● Other channels between the gateway and DRAS
DER ● Communications between the managed generation and storage devices and the Customer Energy Management System
● Communications between the DER Management Server and the managed generation and storage devices
● Communications between the DER Management Server and other upstream servers that are dependent on its DER data
DGM ● Communications between DGM field devices and their management servers
● Communications to and from the DGM servers ET ● Communications between EV and EVSE
● Communications between EVSE and gateway ● Communications between EVSE and EVSE ● Communications between Meter and gateway ● Communications between Meter and meter
WAMPAC ● Communications between Phasor management server and PMU ● Communications between PMU and PDC
● Communications between PDC and WAMPAC Application ● Communications between PDC and Phasor Gateway
● Any WAMPAC application that exchanges synchrophasor data with other systems
● Any other communication channel between WAMPAC components ● Communication with GPS satellites should also be tested, because core functionality in PMUs depend on accurate clock information from GPS.
Figure 5a below shows the overall process flow of the task sub-categories in this section. The figure shows the two task sub-categories may be performed in parallel. As in previous diagrams in this document, the colors represent the recommended likelihood that a utility should consider performing these task sub-categories, and the relative level of expertise required.
Figure 5a: Network Communications Subcategory Flow
Each subcategory below includes a similar diagram depicting the process flow and recommended likelihood to perform for each task.
Suggested Tools:
● Traffic capture and protocol decoder software such as Wireshark or tcpdump ● Hardware network taps
● Man-in-the-Middle tools such as Ettercap ● Protocol fuzzing tools such as Sulley ● Network packet generation such as Scapy
5.1 RF Packet Analysis
This subcategory of penetration tasks focuses on the analysis of lower-layer RF
communications such as frequency hopping, modulation, multiplexing, and data encoding in the Physical Layer and Medium Access Control Layer (PHY/MAC) of the Open Systems Interconnection (OSI) model.
It is usually assumed that network traffic can be extracted from captured RF
communications. As a result, utilities often choose not to perform these sub-tasks and often skip to the next Network Protocol Analysis subcategory of tasks. However, some utilities may find this task subcategory useful to determine the level of effort it would take for an attacker to capture and decode their RF network traffic, especially when the utility knows of security weaknesses in the higher layer network protocols. For entities interested in this type of analysis, consider the following suggestions in each Smart Grid product domain.
AMI ● Wireless communications between meters in the NAN. For AMI meters in the United States, this is usually proprietary to each vendor, often using unlicensed bands which vary for each country (such as 900 MHz ISM band spectrum in the US)
● These tests also pertain to cellular communications in the WAN DR ● Wireless communications are seen usually between the energy
resources and the gateway (including other possible intermediate devices of DCU and BAS), often leveraging IEEE 802.15.4 or Zigbee
● The communication channel between the gateway and the DRAS doesn’t often use ISM band communications, but may occasionally use cellular technologies
DER ● Communications between the managed generation and storage devices and a gateway device on transit to the DER Management Server
○ Often using IEEE 802.15.4 or Zigbee
● Communications between the managed generation and storage devices and a gateway device on transit to the Customer Energy Management System
○ Often using IEEE 802.15.4 or Zigbee
DGM ● Communications between the DGM devices and a gateway device on transit to the DER Management Server
○ Many DGM devices are starting to connect to the AMI network or directly connecting to a cellular backhaul
technologies to connect to the nearest substation
ET ● Wireless communications amongst EV, meter, EVSE, and gateway if used is often IEEE 802.15.4 (CSMA/CA)
○ Mesh network topologies will likely be seen in future deployments
● WiFi or cellular can be used in the EVSE-to-gateway communication
WAMPAC ● GPS signaling between PMUs and Satellites is of primary concern for WAMPAC. Manipulation of this time variable can be attempted here in this sub-category of tasks or in the next sub-category of tasks
● Other wireless communication is not commonly used in WAMPAC due to latency requirements, however cellular and WIFI communications could be considered in the rare occasions when they are used