1
Efficient Data Processing Algorithms for
Wireless Sensor Networks based Planetary
Exploration
Xiaojun Zhai and Tanya Vladimirova
Abstract: The SWIPE project (Space Wireless Sensor Networks for Planetary Exploration) aims to design a wireless sensor network (WSN) , which consists of small wireless sensor nodes dropped onto the Moon surface to collect scientific measurements. Data gathered from the sensors will be processed and aggregated for uploading to a lunar orbiter and subsequent transmission to Earth. In this paper efficient data processing/fusion algorithms are proposed, the purpose of which is to integrate the scientific sensor data collected by the WSN, reducing the data volume without sacrificing the data quality to satisfy energy constraints of WSN nodes operating in the extreme Moon environment. The results of an extensive simulation experiment targeted at the SWIPE lunar exploration mission is reported, which quantifies the performance efficiency of the data processing scheme. It is shown that the proposed data processing algorithms can reduce the WSN node energy consumption significantly, decreasing the data transmission energy up to 91%. In addition, it is shown that up to 99% of the accuracy of the original data can be preserved in the final reconstructed data.
Keyword: Wireless Sensor Network; Data Fusion; Data Processing; Planetary Exploration
1. Introduction
Over the past few decades Wireless Sensor Networks (WSNs) have been widely utilised as a low cost solution to explore difficult-to-access areas in commercial applications on Earth. For instance, WSNs have been used to observe physical or environmental conditions in uninhabited areas for the purposes of environmental monitoring, tracking objects, forest fire or natural event detections [1-3]. The Space Wireless Sensor Networks for Planetary Exploration (SWIPE) project is funded under the space programme of the European Research Framework FP7 [4]. The SWIPE concept is based on using hundreds or thousands of small wireless sensors deployed onto the surface of a planet of interest,
2 ensuring uniform and sufficient area coverage. Since WSNs are composed of a large number of sensor nodes, placed in different locations, they can monitor large geographical areas remotely, overcoming limitations of landers and rovers in carrying out in-situ measurements on planetary surfaces [4]. An ad hoc network will be established among the sensor nodes to gather data about the planetary environment for the purpose of monitoring and understanding physical phenomena. Data fusion and processing techniques will be used to combine readings from different sensors. The processed data should provide an efficient representation of the original sensor readings, despite the reduction of the data volume compared to the raw data [5]. Main goal of the data processing work presented in this paper is to save energy via reducing the amount of data transmitted across the network, while preserving the accuracy of the original data [5]. In this paper, the design of the data fusion/processing algorithms is carried out at three different WSN levels: node, cluster head (CH) and data sink (DS) level, whereby specifically designed techniques are employed to handle the data generated at each level. In addition, the designed algorithms are optimised for the particular type of data measurement. The paper starts by reviewing related work in section 2, followed by a description of the data processing and WSN network topology in section 3. The proposed data fusion architectures and algorithms at node and network level are introduced in sections 4 and 5, respectively. Complexity analysis of the algorithms is presented in section 6. An outline of the validation experiment is given in section 7. Simulation results demonstrating the proposed algorithms are presented in sections 8 and 9. Finally, conclusions are drawn in section 10.
2. Related work
Researchers have recently extended the concept of WSNs to space applications [6, 7], although a WSN has not yet been deployed on another planet. Bringing WSNs to space enables advanced exploration missions, such as characterisation of planetary environments [4], lunar water detection [8]. However, collection of data generated from sensor nodes, which are distributed over large areas, involves considerable data traffic across the network. For example, the data exchanged every 2.6 hours in a SWIPE WSN of a medium size will amount to around 9 MB, coming to 2.4 GB of data in
3 one Moon synodic cycle, which will give rise to high energy consumption. Recent research work [9-11] has shown that the use of data fusion technology can greatly reduce the energy consumption of WSNs.
Sensor data fusion can be carried out at data, feature and decision level. Appling statistical methods at data level [12], for example, arithmetic mean [13], standard deviation (SD) and maximum or minimum values is the most commonly used data fusion technique. The main idea is to use a statistic value to represent a large data set, employing less data. Feature and symbol fusion techniques are widely used in object recognition applications [14] to classify objects in fused raw data obtained from sensors or databases. However, these approaches may not be suitable for applications that require high data accuracy since the classification process can compromise the quality of the original data. Inference techniques are used in decision level fusion with Bayesian and Dempster-Shafer being the most popular inference methods [15, 16]. In addition, fuzzy logic and neural networks based data fusion approaches have successfully been used [17] for accurately monitoring and tracking objects in WSNs. However, decision level fusion techniques cannot be employed when a reconstruction of the raw data is required, as the original information is lost during the processing.
3. WSN data processing: overview and objectives
The SWIPE WSN node sensors, which are housed and controlled by the payload module, collect housekeeping and scientific data. The housekeeping sensors are used to monitor the internal health status of the node through two parameters: temperature and residual battery charge. The scientific data for the SWIPE Moon exploration mission are collected by radiation, thermal, dust and irradiance sensors [18] as follows:
Three surface thermal sensors will be situated outside the node structure. Once the node is activated, they will provide thermal measurements of the lunar surface.
Three multispectral irradiance sensors, sensitive to the visible (VIS), infra-red (IR) and ultraviolet (UV) spectral bands (i.e. 580 nm, 950 nm, and 300 nm) will measure the lunar illumination environment. They will provide a total field of view of 360º.
4 Radiation sensors, capable of measuring the Total Ionizing Dose (TID) and counting the
Single Event Upsets (SEUs) at four energy threshold levels (i.e. 0.9 Mev•cm2
/mg, 9.75 MeV•cm2/mg, 30 MeV•cm2/mg and 60 MeV•cm2
/mg) will be situated on the top of the node. A dust sensor measures the dust deposited over a horizontal surface during a certain exposure
time to estimate the dust deposition rate as a function of the solar incidence. The data processing/fusion architecture of the SWIPE WSN node is shown in Figure 1.
Data Fusion Module OBC
Local Data Fusion
Block
Data Aggregation
Block Radiation, Thermal,
Irradiance, Dust Deposition Scientific Sensors
Temperature and Battery charge Housekeeping Data
Internal Node Control Related
Modules
Power Module
Network Data Fusion
Block
Routing and Networking
Blocks Communication
Module Payload Module
Figure 1 – Overall data processing/fusion architecture of the SWIPE node [18].
The data fusion module in Figure 1 consists of local and network data fusion blocks as well as a data aggregation block. The purpose of the local data fusion block is to process the generated locally housekeeping and scientific data, while the network data fusion block prepares the processed local data and network relay data packets for transmitting to other nodes. The data aggregation block packages the different types of sensor data and the network relay data in a single data packet to be sent to the network, as detailed in [19]. Housekeeping data fusion is performed on a decision level. A Fuzzy Inference System (FIS) is developed [18], which fuses the temperature and the remaining battery level to evaluate the node status, which is reported and stored inside the node for management purposes. Any redundant information is removed from the scientific data in the data fusion module before transmission to the network. This paper discusses mainly the processing of the scientific data.
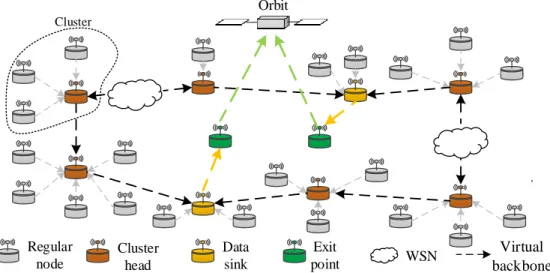
5 Figure 2 shows an instance of the SWIPE network [20], which contains regular nodes (RNs), cluster heads (CHs), data sinks (DSs) and exit points.
Regular node
Data sink
Exit point Orbit
WSN Virtual
backbone
Cluster
Cluster head
Figure 2 – Example of the SWIPE network topology.
The regular nodes, referred to as WSN sensor nodes, perform the following functions: (i) acquire relevant sensor data from the environment, (ii) process, fuse and aggregate the sensed data and (iii) act as relays for other nodes. The data sink nodes are responsible for collecting, processing and reporting data generated by the WSN nodes. The exit points have satellite communication capability and transmit the data collected by the DSs to the orbiting satellite.
The WSN nodes are connected with each other forming a multi-hop physical topology. Over this constrained topology a dynamic virtual backbone (VB) is instantiated (see Figure 2) establishing network connectivity and providing redundancy of paths to DSs for robustness and fault tolerance purposes [21]. The network consists of a number of clusters, which are connected and formed via the dynamic virtual backbone by way of setting up a Connected Dominating Set (CDS). Clustered topologies are useful from a data aggregation and fusion perspective, helping to reduce the flooding of data and control packets in the network [22]. In addition, the distribution of the routing load among the WSN nodes (i.e., the role of relaying the data of neighbouring nodes) could also reduce the processing burden and the power consumption of the individual node.
This paper presents a feasibility study on the data processing in the SWIPE WSN, which was carried out prior to the actual manufacturing of the nodes and was aimed to inform the implementation
6 process. Therefore, no physical parameters such as targeted power budgets were available. The final outcome of the SWIPE project is an Earth bound demonstration based on a downsized WSN prototype to test the node design and draw conclusions. No flight qualified hardware is aimed at. The objectives of the data processing work are mostly derived from the open literature, as follows.
Energy efficiency is an important goal that should be considered when designing the node architecture and data processing algorithms of WSNs [23] for planetary exploration. This is because such WSNs operate in unfriendly and unattended environments, where it is impossible to access or replace dead nodes. The power consumption used for data transmission dominates the power consumption of a WSN sensor node and it is proportional to the size of the data [24]. Therefore, the overall energy consumption could be reduced significantly by reducing the data transmission volume in WSNs [5]. Data fusion has a positive impact on the overall energy performance of a WSN since it reduces the transmitted data volume [24]. This strengthens the rationale for aggregating the data as much as possible in the data source-sink(s) path. A key to the WSN energy saving is also the scheduling algorithm [25], which selects an optimal subset of sensors that are allowed to measure/transmit data at a certain time based on the current health status of the nodes to be scheduled. In addition, the WSN energy performance is dependent on both the selected hardware platform and the data processing algorithms.
The proposed data processing techniques are also aimed at minimising the transmitted data size as well as at maintaining a reasonable level of accuracy of the collected data. The sensor data accuracy is important for the understanding of the physical environment, as errors may affect research findings [26]. The available processing power and memory size limitations of the on-board computer (OBC) impose restrictions on the use of computationally intensive data processing algorithms, which have to be taken into account.
To reduce the negative effects of losing measurement accuracy, each processing algorithm is specifically tailored to the particular type of scientific data. For instance, some sensor data, e.g. Thermal, Irradiance, TID are processed using the Kalman filter, as shown in section 4.1, section 4.2
7 and section 4.3.1 respectively, where in addition to the statistical analysis, an evaluation of the accuracy of the individual sample data of the processed signal is carried out. However, some of the sensor data, e.g. SEUs, are statistically analysed, as shown in section 4.3.2. This is due to the nature of SEUs, which are caused by high energy particles such as electrons and protons, resulting from solar activities and other effects.
In order to meet the above objectives, the proposed data processing/fusion algorithms are performed at three levels:
(i) Local data processing /fusion (node level). (ii) Network data processing/fusion (network level). (iii) Global data processing/fusion (sink level).
The scientific sensors are scheduled to take readings with different measurement frequencies and work independently. Thus, the local data processing algorithms are adapted to each scientific sensor data, balancing accuracy, transmitted data volume and computational complexity. No processing and reduction of the dust sensor data will be carried out by the SWIPE node due to the low amount of data generated by the dust sensor as well as the inability to simulate test data as a result of the lack of Lunar dust information and statistics (in terms of both order of magnitude and variation profile). The nodes in the SWIPE WSN are organised and connected with each other forming a multi-hop physical topology, as shown in Figure 2. Within a cluster, the data is statistically analysed in the CH (e.g. mean, maximum or minimum values, etc.), aiming to remove non-relevant information and to report the statistics to the network. This process can significantly reduce the size of the transmitted data, but it can also refine the information content of the collected data. The Kalman filter is also applied on the statistically analysed data generated at CH level in order to further reduce the data transmitted to the network. Data generated from each CH are then aggregated during each relay to the sink node, where a complementary data fusion based approach is used to fuse the data from different CHs together with the local representative information to complement the data fusion process.
8 The DS node has the same functions as the CH nodes, however, in addition, it stores all the data transmitted from the CHs in the WSN, performs statistical analysis on the data and reports the processed results to the exit point. The DS nodes should have the same hardware capabilities as the CHs and RNs, as they hold a global view of all the CHs in the WSN. The data sink election algorithm proposed in [22] ensures that a new DS is elected if the current DS runs out of battery charge. In addition, reports of the measurements could be produced by a report unit upon users’ requests. Although the measurements are performed continuously, the reporting unit only reports the relevant data, which means that the sink node only sends reports to the exit point node if it differs from the last transmitted data information. In this way, the exit point node would gather exactly the same information as with the classical approach described in [27], but will receive less reports saving energy.
4. Scientific data processing algorithms at node level
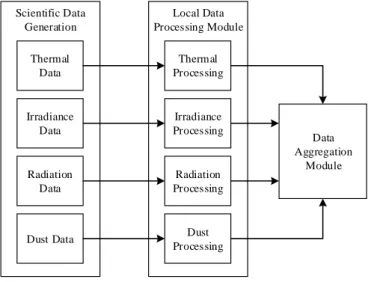
The data fusion architecture for the scientific data at node level is illustrated in Figure 3.
Scientific Data Generation
Thermal Data
Irradiance Data
Radiation Data
Dust Data
Local Data Processing Module
Thermal Processing
Irradiance Processing
Radiation Processing
Dust Processing
Data Aggregation
Module
Figure 3 – Overall scientific data processing architecture for a SWIPE node.
As shown in Figure 3, the scientific data is processed separately in a dedicated local data processing module, specifically designed to handle a particular data category, thus optimising the performance of the data processing accordingly. Once the data is processed in all the processing modules, it is sent to the data aggregation module to be packed together with a set of unique identifying labels (e.g. time,
9 location, etc.). In the data aggregation module, the different types of sensor data and the network relay data are packed in a single data packet to be sent to the network.
4.1 Thermal data
The lunar surface temperature is the most well-known parameter of the Moon environment. The thermal conditions on the Moon are extremely challenging. Because of its slow rotation, it can essentially come to its blackbody equilibrium temperature. The temperature reaches its peak (near the centre of the near-side disc) around full Moon, and plunges to its coldest just before lunar sunrise 22 Earth days later [28]. The temperature variation mainly depends on the latitude of the site and the position of the Sun. In general, the lower is the latitude the higher is the temperature during day time. Typical maximum surface temperature (local noon) is 100-120 ºC [28]. Just before sunrise, the temperature can be -150 ºC or even lower [28]. During the Moon night period, the temperature variation is much lower until just before sunrise, i.e. the temperature does not change significantly after sunset [28].
In this paper, the thermal data are processed using a Kalman filter [29], which is an algorithm that
uses a series of measurements obtained over time that may contain noise or other random variations (e.g. inaccuracy factors). The algorithm produces estimates of unknown variables that tend to be more precise than those based on a single measurement alone [29]. The reason for that is that the Kalman filter operates recursively on streams of noisy input data to generate a statistically optimal estimate of the underlying system state. In addition, Kalman filtering only requires the previous time step and the current measurement to compute the estimate of the current state, which allows the use of smaller memory buffers to store the data. In contrast to other batch estimation techniques, no history of observations and/or estimates is required, which makes the Kalman filter particularly suitable for real-time applications.
Typically, the Kalman filter has two distinct phases: predict and update. In the prediction phase, it
uses the state estimate from the previous time step to produce an estimate of the state at the current time step. However, only the estimate of the state at the current time step is employed, rather than the measurement data obtained from the current time step. Therefore, in the update phase, the
10 current a priori prediction is combined with the current observation information to obtain a
posteriori state estimate.
Predict phase:
1) Calculate a priori state estimate: xˆk|k1Fkxˆk1|k1 (1)
2) Calculate a priori estimate covariance: Pk|k1FkPk1|k1FkTQk (2)
Update phase:
3) Calculate measurement residual: ~ ˆ| 1
k k kk
k z H x
y (3)
4) Calculate residual covariance: Sk HkPk|k1HkT Rk (4)
5) Calculate optimal Kalman gain: k
T k k k
k P H S
K | 1 / (5)
6) Update the posteriori state estimate: xˆk|k xˆk|k1Kky~k (6) 7) Update theposterior estimate covariance: Pk|k (IKkHk)Pk|k1 (7) where Fk is the state transition model, which is applied to the previous state xˆk1|k1; Hk is the
measurement model which, maps the true state space into the observed space and Rk is the covariance.
1 |
ˆkk
x and
x
ˆ
k1|k1 are the a posteriori state estimate at time k-1 given measurements up to and including at time k and k-1 respectively; Pk|k and Pk|k1 are the a posteriori error covariance matrix fortime k and k - 1; Qk and Rk are the noise covariance matrices.
The following initial parameter values for the thermal data Kalman filtering are used in this work:
Fk = 1; Hk = 1; Rk = 0.25; P0 = 1; X0 = Z0; Qk = 4×10
-4
. They are chosen empirically based on experimental tests, in which these values have achieved the best results. The equations (1)-(7) can then be simplified as follows:
1 | 1 1
| ˆ
ˆkk xkk
x (8)
4 1
| 1 1
| 4 10
k k
k
k P
P (9)
1 | ˆ ~
k kk
k z x
y (10)
) 25 . 0 /( | 1
1
|
kk kk
k P P
K (11)
k k k k k
k x K y
xˆ| ˆ | 1 ~ (12)
1 | |k ( k) kk
k I K P
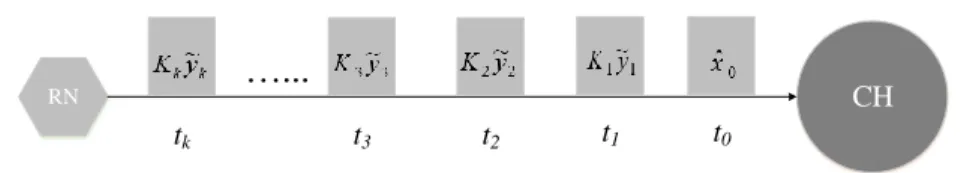
11 As it can be seen from equation (12), the value of the updated estimate is mainly determined by the term Kky~k, and the result of this is usually a small number (i.e. a small data size resulting in a lesser amount of storage space), as the difference between the current measurement value and the estimate is minor in continuous time. In accordance with this, the data size could be reduced if the RN only transmits its current value of Kk~yk to its CH, which can then update the current estimate xˆk|k by
accumulating the RN’s initial estimatexˆ0 using equation (12). Figure 4 shows an example of the thermal data transmission from time step t0 to tk.
CH
RN
…...
t0
t1
t2
t3
tk
Figure 4 – An example of thermal data transmission between a RN and a CH from time step t0 to tk. In order to investigate the actual performance of the proposed method, the Kalman filter is tested with data samples based on the thermal data reported in [28]. The thermal data profile at latitude 0º is chosen in this test, assuming that the values are converted to decimal numbers using a 12-bit analogue-to-digital converter (ADC). In order to simulate a real scenario, 8% of Gaussian noise is added to the original thermal signal, as shown in Figure 5(a) and Figure 5(b).
In Figure 5, the sampling time is every 10 mins, and there are a total of 4321 samples during one Moon synodic cycle. Figure 5(c) shows the processed thermal data when using the proposed Kalman filtering approach. By comparing the two graphs in Figure 5(b) and Figure 5(c), it can be concluded that the graph, which resulted from the Kalman filter, is significantly smoother than the original noised thermal signal, i.e. the noise added to the original signal has been removed in the processed signal. On the other hand, the shape of the processed signal is similar to the raw measurements graph in Figure 5(a), which suggests that the accuracy of the Kalman filter results is satisfactory. Quantitative analysis of this comparison is reported in section 8.1.
12 (b)
(c)
0 500 1000 1500 2000 2500 3000 3500 4000 4500 1000 1200 1400 1600 1800 2000 2200 2400 T em p e ra tu re ( D ec im a l)
Samples of temperature data
(a)
0 500 1000 1500 2000 2500 3000 3500 4000 4500 1000 1200 1400 1600 1800 2000 2200 2400
Samples of temperature data
T em p e ra tu re ( D ec im a l)
0 500 1000 1500 2000 2500 3000 3500 4000 4500 1000 1200 1400 1600 1800 2000 2200 2400
Samples of temperature data
T em p e ra tu re ( D ec im a l)
Figure 5 – Thermal data: (a) original raw data, (b) noised data and (c) processed data.
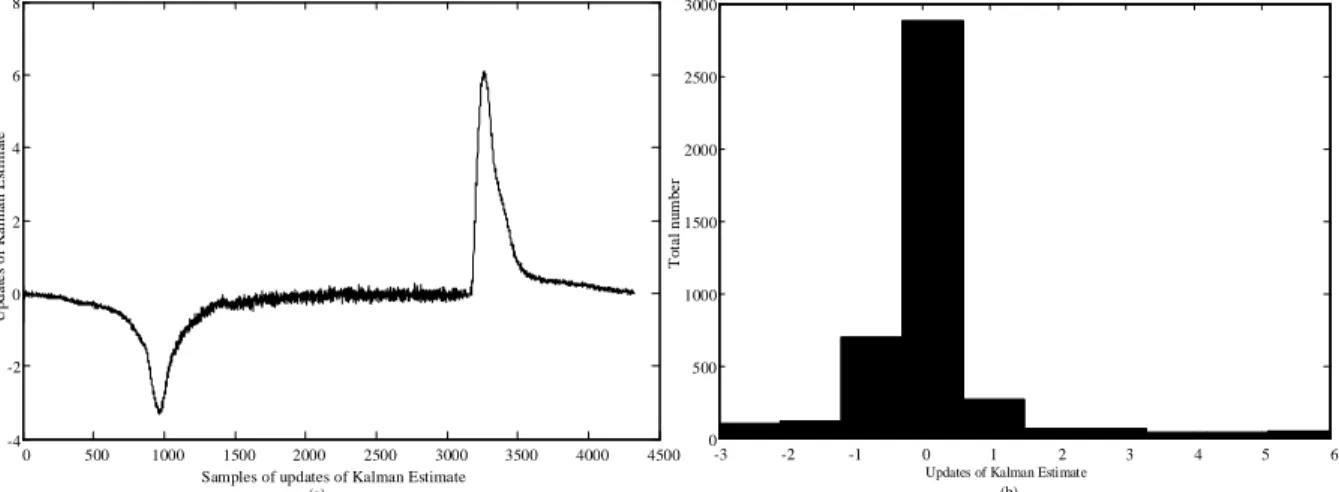
Another important factor when evaluating the algorithm performance is the required size of the transmitted data. The variation of the update of the Kalman estimate Kky~k , which is the main data that is required to be transmitted to the CH, is plotted in Figure 6 over one Moon synodic cycle .
0 500 1000 1500 2000 2500 3000 3500 4000 4500 -4 -2 0 2 4 6 8
Samples of updates of Kalman Estimate
U p d a te s o f K a lm a n E st im at e
-3 -2 -1 0 1 2 3 4 5 6
0 500 1000 1500 2000 2500 3000
Updates of Kalman Estimate
T o ta l n u m b e r (a) (b)
Figure 6 – (a) Updates of the Kalmanestimate (floating point). (b) Histogram of the updates of the Kalman estimate
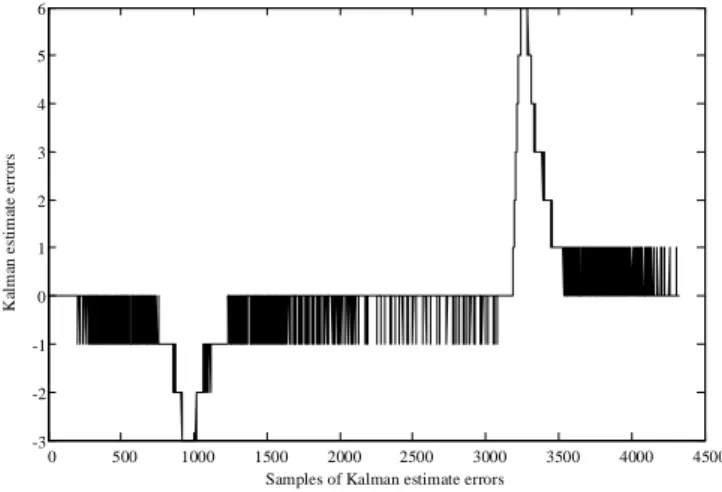
13 It can be seen from Figure 6(a) that the values of Kky~kare changing significantly during sunrise and sunset time, however, during the rest of the time, they are changing slowly, which implies that the estimates of the Kalman filter are close to the actual measurements, resulting into a low data traffic between the RN and the CH . This is confirmed by the histogram in Figure 6(b), which shows that the most frequent updates of the Kalman estimate have values of ‘0’, i.e. there is no need to transmit any data to the CH. The largest update value is ‘6’, but the total number of these values is much smaller than the number of the ‘0s’. This proves that the total transmitting data size would be much smaller than directly transmitting the original measurements. In order to further reduce the transmitted data size and the complexity of calculation, the updates of the Kalman estimates could be converted into their nearest integers, which will require less processing power and data storage. This is exemplified by Figure 7, which presents the same graph as in Figure 6 (a), but using integer representation.
0 500 1000 1500 2000 2500 3000 3500 4000 4500 -3
-2 -1 0 1 2 3 4 5 6
Samples of Kalman estimate errors
K
al
m
an
e
st
im
at
e
e
rr
o
rs
Figure 7 – Updates of the Kalman estimate (integer).
Figure 8(a) depicts the output of the Kalman filter, when the updates are represented as integers. Figure 8(b) shows that the difference between Figure 5(c) and Figure 8(a) is less than 0.04%. In general, the floating point based result is smoother than the integer based result, but it would require more memory space and transmission power.
14
0 500 1000 1500 2000 2500 3000 3500 4000 4500 1000
1200 1400 1600 1800 2000 2200 2400
Samples of temperature
T
em
p
er
at
u
re
(
D
ec
im
a
l)
0 500 1000 1500 2000 2500 3000 3500 4000 4500 0
0.005 0.01 0.015 0.02 0.025 0.03 0.035 0.04 0.045
Samples of temperature data
D
if
fe
re
n
ce
(
%
)
(a) (b)
Figure 8 – (a) Processed thermal data using the Kalman filter (integer). (b) Difference between the data samples in Figure 5(c) and Figure 8(a).
4.2 Irradiance data
The illumination sensor is designed to measure the incident irradiance at three different spectral intervals: one in the IR side of the spectrum, a second one in the UV range and a third one in the VIS range. Direct solar irradiance is the major source of irradiance on the Moon and other sources such as reflectivity are ignored. The illumination sensor is also designed to measure the irradiance in all directions, in order to achieve full 360º planar coverage. Each group of sensors (IR, VIS and UV) are mounted on each face of the SWIPE node, as illustrated in Figure 9.
Figure 9 – Geometrical position of the three irradiance sensors on the WSN node [30].
The irradiance on the Moon surface consists of direct irradiance Edir and reflected irradiance Eref,
however the latter is ignored due to the SWIPE irradiance sensor being designed to target the former. Hence, the total irradiance measurement is the total sum of the irradiance sensed on each face of the node (i.e. Face 1, 2 and 3), i.e. Etotal = Edir1 + Edir2 + Edir3.
15 Similar to the thermal data, the irradiance data can also be processed using the Kalman filter. Except of the value of Rk = 0.15, the rest of parameters of the Kalman filter are the same as the ones stated in equations (8)-(13). In the same way, only the rounded integer values of the updates of the Karman estimate Kk~yk, are sent to the CH. The main difference is that there are three different spectral measurements generated from each irradiance sensor, hence, the spectral measurements are added together based on their wavelengths. These form the inputs to the Kalman filter as below:
n
i
i E E
1 300
300 () (14)
n
i
i E E
1 580
580 () (15)
n
i
i E E
1 950
950 () (16)
where E300, E580, and E950 are the total irradiance values for the wavelength 300 nm, 580 nm, and 950 nm, respectively; i is the face number, n is the total number of faces on the node (i.e. n=3).
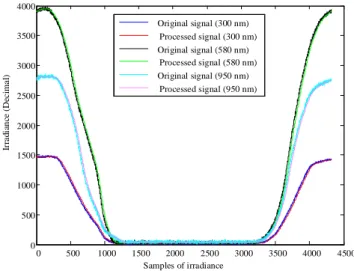
Data samples from [31] are also used to evaluate the Kalman filter, which are converted to decimal numbers assuming a 12-bit ADC. 8% of Gaussian noise is added to the original irradiance signal as well. Comparison of the original signals and the processed irradiance signals are shown in Figure 10.
0 500 1000 1500 2000 2500 3000 3500 4000 4500 0
500 1000 1500 2000 2500 3000 3500 4000
Original signal (300 nm) Processed signal (300 nm) Original signal (580 nm)
Processed signal (580 nm) Original signal (950 nm)
Processed signal (950 nm)
Samples of irradiance
Ir
ra
d
ia
n
ce
(
D
ec
im
a
l)
16 By visually comparing the original and processed signal for each wavelength category, it can be seen that the shapes of the processed signals are smoother than the shapes of the noised original signals and follow the shapes of the original signals exactly.
4.3 Radiation data
In the SWIPE node, the radiation sensor consists of two packages: Total Ionising Dose (TID) and Single Event Upsets (SEUs). Contrary to the thermal and irradiance sensor data, the behaviour of the radiation data on the lunar surface is not well investigated. This is especially true for the SEU data, which is based on random events driven by solar activity and Galactic Cosmic Rays (GCR), therefore SEU rates depend on real measurements. No radiation statistics for the lunar surface was found in the open literature at the time of carrying out this research and, in particular, no information was available on how the radiation data vary during a Moon synodic cycle. Therefore, background knowledge on the nature of TID and SEUs was used to simulate a possible radiation scenario for the Moon. The TID testing data was generated based on TID measurements obtained from the Next Generation Space Telescope (NGST) mission over several years [32], applying an accumulative model to organise the data into the designed measurement range of the TID sensor. Similarly, the most relevant SEU model proposed in [33] was employed to generate the testing data for the SWIPE scenario.
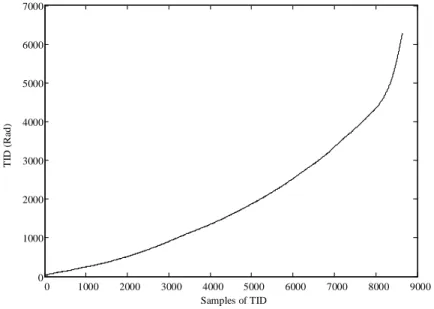
Usually, TID can be measured in terms of the absorbed ionising dose, this is due to electrons and protons that can be trapped or absorbed by electronic devices, which can be treated as a measure of the energy absorbed by the matter. Based on that, an example of the possible variation of TID during one Moon synodic cycle is presented in Figure 11. Different from the thermal and irradiance data, the value of TID shall continually increase along with the increase of the mission time. Figure 11 shows the total samples covered in one Moon synodic cycle with a sampling period of 5 mins, where the TID measurement range is designed to cover TID from 25 to 50000 Rad.
17
0 1000 2000 3000 4000 5000 6000 7000 8000 9000
0 1000 2000 3000 4000 5000 6000 7000
Samples of TID
T
ID
(
R
ad
)
Figure 11 – Possible variation of TID data during one Moon synodic cycle.
It must be noted that the TID rate used in this paper (Figure 11) changes much faster than the actual measured one, obtained from the Lunar Reconnaissance Orbiter [34]. However, the TID processing results are still valid, as the rate in Figure 11 is qualitatively the same as the one reported in [34] and, in addition, it is better suited to the measurement range of the SWIPE TID sensor. In fact, should the actual slower changing TID rate in [34] have been used, the performance of the proposed TID data processing would have been much higher, which strengthens the findings of this study.
In general, an SEU is a change of the state of a 1-bit memory cell, or a bit-flip, which is caused by ions or electro-magnetic radiation striking a sensitive part of an electronic device. In other words, the number of the SEUs depends on the sensitivity of the tested material and the probability of the striking event [33]. The measured cross section is defined as the ratio of the number of upsets to the particle fluence, which is a function of the particle energy in terms of the Linear Energy Transfer (LET). The sensitive volume is the sensitivity of a device in an event of an ion striking, which requires assumptions about the device construction. To determine the device error rate, the cross section and sensitive device volume are integrated together with the particle LET spectrum. The particle LET spectrum for GCR ions hydrogen through uranium is used in this study for generating the SEU rate [35].
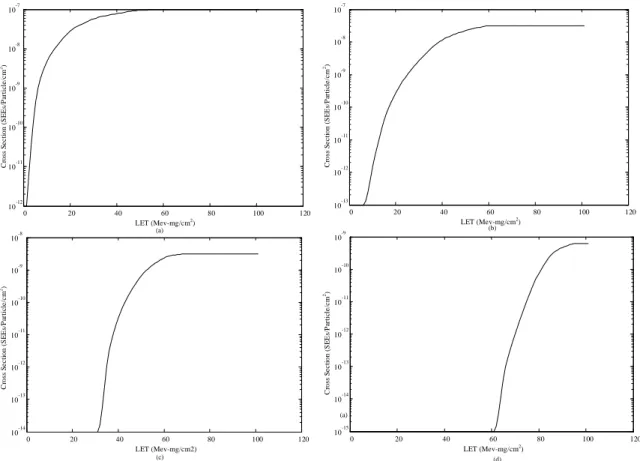
18 In the SWIPE node, the SEU sensor is based on digital shift registers, where four identical digital shift registers (128b) with different susceptibility to SEUs are designed to count the number of SEUs, happening every 5 minutes. The four levels of susceptibility are specifically designed to measure SEUs for four different LET levels. Examples of cross sections for each threshold level are shown in Figure 12.
0 20 40 60 80 100 120
10-12 10-11 10-10 10-9 10-8 10-7
LET (Mev-mg/cm2)
C ro ss S e c ti o n ( S E E s/ P ar ti cl e /cm 2)
0 20 40 60 80 100 120
10-13 10-12 10-11 10-10 10-9 10-8 10-7
LET (Mev-mg/cm2 ) C ro ss S e c ti o n ( S E E s/ P ar ti cl e /cm 2)
0 20 40 60 80 100 120
10-15 10-14 10-13 10-12 10-11 10-10 10-9
LET (Mev-mg/cm2)
C ro ss S e c ti o n ( S E E s/ P ar ti cl e /cm 2)
0 20 40 60 80 100 120
10-14 10-13 10-12 10-11 10-10 10-9 10-8 LET (Mev-mg/cm2) C ro ss S e c ti o n ( S E E s/ P ar ti cl e /cm 2) (a) (a) (b) (c) (d)
Figure 12 – Examples of cross sections for each LET threshold level. (a) 0.9 MeV•cm2/mg; (b) 9.75 MeV•cm2/mg; (c) 30 MeV•cm2/mg; (d) 60 MeV•cm2/mg.
A series of random LET values are generated from ‘0’ to 100 MeV•cm2/mg, which are then used to generate the number of SEUs by applying the following equation [33]:
i i
i C LET f LET s t
S ( ) ( )
(17)where Si denotes the number of SEU events for the i th
LET threshold; Ci denotes the cross section function of the ith LET threshold; f denotes the LET fluence function; s, t and θ are the area of the sensor chip, measurement period and chip sensitive volume, respectively.
19 Since the TID and SEU data have completely different characteristics, they are processed separately. The processing of the TID data is similar to the processing of the thermal and irradiance data and the same Kalman filtering technique could be used. However, since an SEU could be caused by many factors, which not only include environmental factors (solar activity, GCR), but also have a close link with the used hardware as well the possibility of particles hitting the sensor. In this work, a set of random LET data have been used to simulate the SEU events, since an appropriate function of the particle energy (LET) that contains specific periods and locations related to a real SWIPE mission was not available. For this reason, it is not possible to use the Kalman filter to estimate the output results. Hence, algorithms based on statistical approaches will be employed with the aim to achieve high accuracy results from measurements performed in a certain period.
4.3.1 TID data
Apart of Rk = 0.01, the rest of the parameters of the Kalman filter are the same as the ones defined by equations (10)-(15), and similarly the rounded values of Kky~k are sent to the CH.
The Kalman filter is applied to the data samples from Figure 11, converting them first to decimal numbers using a 12-bit ADC format. 8% of Gaussian noise is also added to the original TID values. Comparison of the original signal and the processed TID signal is shown in Figure 13.
Samples of TID
T
ID
(
D
ec
im
a
l)
0 1000 2000 3000 4000 5000 6000 7000 8000 9000 0
100 200 300 400 500 600 700
Original TID signal Processed TID signal
0 1000 2000 3000 4000 5000 6000 7000 8000 9000 0
1 2 3 4 5 6 7 8 9 10
Samples of TID
D
if
fe
re
n
ce
(
%
)
(a) (b)
Figure 13 – (a) Comparison of the original data and the processed TID data (b) Difference between the original and the processed TID data
20 It can be seen from Figure 13 that the difference between the original signal and the processed signal is decreasing during the mission period, which implies that the Kalman filter predicts the original signal quite accurately.
4.3.2 SEU data
The SEU data are processed using a statistical approach, whereby the original SEU data sequence is divided into fusion units. A fusion unit contains a group of SEU data samples and is represented using the arithmetic mean and standard deviation of its samples.
Let Si denote the i
th
fusion unit in the original data sequence and each fusion unit has the same number of data samples n. The arithmetic mean µi and the SD σi of the data samples in each fusion unit are calculated by using the equations
n
x i
i S x
n 1 ( )
1
and
n x i i
i S x
n 1 2 ) ) ( ( 1
, respectively. Hence,
the range of the processed data sequence of the ith fusion unit, S’i , is S’i∈{µi ± σi }. Figure 14 shows the results of the statistical analysis for the number of SEUs at each LET threshold.
0 5 10 15 20 25 30
0 20 40 60 80 100 120 140 160 180
2 4 6 8 10 12 14 16 18 20 0 50 100 150 200 250
1 1.5 2 2.5 3 3.5 4 4.5 5 5.5 6 0 50 100 150 200 250 300
-0.50 0 0.5 1 1.5 2 2.5 3 50 100 150 200 250 300 350 400 (a) (b) (c) (d) T o ta l n u m b er T o ta l n u m b er T o ta l n u m b er T o ta l n u m b er
Number of SEUs Number of SEUs
Number of SEUs Number of SEUs
Figure 14 – Statistical analysis of the number of SEUs at each LET threshold. (a) 0.9 MeV•cm2/mg; (b) 9.75 MeV•cm2/mg; (c) 30 MeV•cm2/mg; (d) 60 MeV•cm2/mg.
21 It can be seen from Figure 14 that the processed SEU data is approximately normally distributed, which implies that the processed and the original SEU data have a similar distribution. Comparing with the Kalman filter based approach, this approach requires to send both the mean value and the SD value of each fusion unit to the CH, reducing the data transmission volume to 2/n of the original data.
5. Data processing at network level
As discussed in the section 3, the sensor nodes transmit the collected measurements to its cluster head node. This type of network architecture is comprised of a set of clusters, whereby clusters are directly connected together or in a multi-hop way as shown in Figure 15. Hence, data is aggregated into a single packet in each relay.
CH1
RN RN
RN RN
RN
RN CHn
CH2
DS
CH3
CH4
Cluster
CH0
RN RN
RN RN
RN RN
Cluster
Figure 15 – Data aggregation flow in the SWIPE WSN.
Data processing and fusion techniques are used to remove the redundant information from the relay data packets, generating representative information and minimizing the data transfer volume in each CH and DS(s). In addition, a data aggregation algorithm [19] is used to aggregate the sensor data from the current CH together with other data from neighbour CHs into a single data packet, and the packet is sent to the next CH, which is on the path to the DS node, until the data packet reaches the DS node. For instance, in Figure 15, the CH2 is the parent node of CH0 and CH1, however, the CH2 is
22 also the child node of CH3. The role of each node is reconfigurable, which is taken care of by the
routing algorithm proposed in [20].
5.1 Data processing/fusion at cluster head level
In general, a cluster is comprised of a set of regular nodes and each RN communicates with its CH under a predefined schedule. Once all the scheduled data is collected from the RNs by the CH, the CH performs data fusion on the collected measurements. Figure 16 shows an example of a data collection scheme in a cluster, where Pn(t) denotes a data packet between the RNn and the CH at a time step t. In
each Pn(t), it includes all the measurements collected at time t by the sensors of RNn (e.g. thermal,
irradiance, radiation, dust).
CH
RN2
RN3
RN4
RN1
RN6
RN5
P1(t)
P6(t)
P5(t)
P4(t)
P3(t)
P2(t)
Figure 16 – Data collection scheme in a cluster, connected to 6 RNs.
Once the CH receives the Pn(t) from the sensors of RNn, the data packet is then divided into five pieces of data, which correspond to the five different scientific measurement data, respectively. The five sensors’ data are stored in five specialised buffer tables sequentially, where each buffer is only used for one type of measurements. Following the same principle, the next received Pn+1(t) are
unfolded and stored in the same buffers, but in a different location. Once all the scheduled data is received, the predesigned data fusion algorithms are used to fuse each type of measurement respectively. Finally, the processed data is stored in the sending buffer, to be sent to its parent node (i.e. the next CH on the path to the DS node) or wait for the packet(s) from its child node(s) (i.e. the CHs that need to use the current CH as an intermediate node to the DS node), if it is the parent node of any other nodes.
23 The same type of measurement data, generated from different RNs, is processed together, since they represent the same environmental event happening at the same time and are, therefore, bound to contain some redundant information. A lightweight sensor scheduling algorithm is used [25], which introduces dynamically variable schedules with the aim of fairly distributing the sensing tasks among the nodes based on a feedback on the current health status of the nodes to be scheduled. In addition, data fusion algorithms could be applied to the sensor data to further reduce the data size. One of the most commonly used statistical data fusion approaches is to calculate the arithmetic mean of the data, reducing significantly the data size to 1/N of the original data size, where N is the number of RNs in a cluster. From a data quality point of view, the statistical value represents the best measurement results within a small region. Since the RNs within the cluster are relatively close, the scientific sensor data should usually not vary significantly and the arithmetic means of each type of measurement data should be enough to represent the environment conditions in this cluster region (i.e. within the designed cluster radius communication of about 500 m maximum). However, it is worth noting that the raw measurements of the individual RN are still available in their CH, and this data can be retrieved upon users’ requests, if there is a specific interest in the particular cluster.
In the following, we use thermal data as an example to introduce the proposed data processing/fusion approach. Table 1 shows an example of the buffer table for the thermal sensor data.
Table 1 – An example of the buffer table for the thermal sensor data.
Nodes t0 t1 t2 t3 … tk
RN1 X0(1) 1 1
~
y
K (1) K2~y2(1) K3~y3(1) ... Kk~yk(1)
RN2 X0(2) K1~y1(2) K2~y2(2) K3~y3(2) ... Kk~yk(2)
RN3 X0(3) 1 1
~
y
K (3) K2~y2(3) K3~y3(3) ... Kkyk
~ (3)
… … …
…
RNn X0(n) K1~y1(n) K2~y2(n) K3~y3(n) ... Kk~yk(n)
Fused data
24 In Table 1, X0(n) represents the first measured thermal data from RNn and Kk~yk(n) represents the update of the Kalman filter from regular node n at time step k. Therefore, the estimate of the measurement data from node n can then be calculated by
)
(
~
)
(
)
(
ˆ
10
n
K
y
n
X
n
x
t k t t t
(18)The processed thermal data Tt(m) for the CHm can then be calculated by
) 1 ( ) ( ˆ / 1 ) 0 ( ) ( / 1 ) ( 1 1 t n x N t n X N m T N n t N n t t (19)The Kalman filter is applied sequentially on Tt(m), using equations (8) – (13), obtaining the new updated estimate Kk~yk(m)for the CH, as shown in Table 1. Figure 17 shows an example of the received and processed thermal data in a CH. Figure 17 presents the processed data at a CH as well as the received data form the RNs, where the processed data overlaps quite precisely the graphs of the received data. T em pe ra tur e (D ec im al )
0 500 1000 1500 2000 2500 3000 3500 4000 4500 1200 1400 1600 1800 2000 2200 2400
Data from RN1 Data from RN2 Data from RN3 Data from RN4 Data from RN5 Processed Data
Samples of temperature
Figure 17 – An example of the received and processed thermal data in a CH.
The irradiance and the TID sensor data is processed according to the same principle. The arithmetic mean calculations are applied on the received dust and SEU data at CH level. All the processed data at time step t are stored in the same data packet, being ready to be sent to the neighbour nodes.
25 The last step of the data processing procedure at CH level is data aggregation, where the local generated data packet is aggregated with its network relaying packets. Before sending the processed data to the DS node, a relay link is established based on the shortest path finding algorithm, which identifies the shortest path from the current CH node to the closest DS node [20]. In this localised path, each intermediate node is treated as a parent node, and it should record its child nodes. The transmission is initialised from the farthest child node, and the data are propagated from that node to the DS. At each intermediate node, it should wait for data from all its child nodes to be received, and then it aggregates the same type of sensor data together into a single data packet, until the data packet reaches the DS node [22].
5.2 Data processing/fusion at sink level
The data processed at the cluster heads is sent to the data sink via a multi-hop relay communication link. The data, which comes from the same CH, are integrated together, forming a set of measurement data tables, where each type of sensor data is organized in the same data table in the order of their time steps. Figure 18 shows an example of the data tables in a DS.
Figure 18 – Data tables in a DS.
In Figure 18, the data tables are organized in a 3 dimensional space, where the x, y and z axes represent the time steps, the CHs, and the sensors respectively. For example, the first data table denotes all the thermal measurements from the CHs in the WSN during one Moon synodic cycle,
26 where each row of the table represents the complete thermal measurements from a CH during one Moon synodic cycle. Based on this table, the DS can report any particular scientific measurement at any time step from any CH node up to the exit point node on request, or perform statistical analysis on the data. Figure 19 represent graphically the data table for all the thermal measurements in a DS, where each curve denotes the thermal data measurements taken from the RNs connected to a particular CH during one Moon synodic cycle that are averaged in that cluster
0 0.5 1 1.5 2 2.5 3
x 106 1000
1200 1400 1600 1800 2000 2200 2400
Time (s)
T
em
pe
ra
tur
e
(D
ec
im
al
)
Figure 19 – Graphical representation of all thermal data measurements in a DS.
Because the CHs are located in different physical locations, the measurements vary significantly as shown in Figure 19.
Reporting is the other main function of the data sink. A set of predefined statistical analyses are performed and the results are reported to the exit point node. Four report types were specified in the SWIPE project as follows:
A detailed report includes all the available data tables in the DS. The data tables are sent to the exit point node one by one.
A partial report includes a specified set of selected data tables in the DS. For example, if the base station only requires thermal and irradiance data, then the report unit will only send the data table that contains thermal and irradiance data to the exit point node. In addition, this report type also supports the request for data tables from the selected CHs and/or particular time steps.
27 A maximal and minimal measurements report includes statistical calculations of maximal and
minimal measurements from the selected CHs at a selected time step.
An average measurement report returns statistical calculations of the average measurements from all the selected CHs at a selected time step.
The above reports are an example of the type of information that could be collected using WSNs for planetary exploration. In fact, the data processing algorithms in the data sink will depend on the needs of the particular scientific mission and the functions of the report unit will be determined by the actual mission objectives.
6. Complexity analysis
This section discusses the computational complexity of the data processing/fusion algorithms proposed in sections 4 and 5. The analysis is based on identification of computationally intensive processes in the algorithms, such as floating-point arithmetic operations, which include addition, subtraction, multiplication or division performed on two floating-point numbers. The operations are divided into three categories: 1) multiplication/division; 2) addition/subtraction; 3) others (e.g. composites of 1) and 2), such as square root, etc.). Table 2 presents the results of the complexity analysis of the local data processing/fusion algorithms in terms of the total number of operations for each data type.
Table 2 – Complexity analysis of the local data processing/fusion algorithms per data sample.
Data Type Multiplication/division Addition/subtraction Other
Thermal 3 5 0
Irradiance at 300 nm 3 5 0
Irradiance at 580 nm 3 5 0
Irradiance at 950 nm 3 5 0
TID 6 10 0
28 The number of the operations for the processing of one data sample of thermal data is counted first. Because the Thermal and Irradiance data are processed using the same Kalman filter, and the sampling frequency is also the same, the total numbers of the operations are similar. However, as the sampling frequency of the TID data is twice that of the Thermal data (i.e. two instances of TID data would be generated in a period of Thermal data generation), the total number of the operations for the TID data is doubled. With regards to the SEU data, the total number of the operations depends on the size of the fusion unit (i.e. n), and the calculation is performed every n SEU samples (i.e. the sample frequency of the SEU data is twice greater than the Thermal data). As shown in Table 2, a small number of operations are needed to process the sensor data by the local data processing algorithm, which suggests that a low cost microcontroller would be a suitable option for the implementation of the proposed algorithm.
Similarly, Table 3 presents the complexity analysis of the data processing/fusion algorithms at CH level in terms of the total number of operations for the processing of one data sample, where k is the numbers of RNs in the cluster.
Table 3 – Complexity analysis of the data processing/fusion algorithms at CH level per data sample.
In Table 3, the numbers of the operations are higher than in the local processing (Table 2). The reason for that is that additional operations are used for performing the arithmetic mean calculation, the complexity of which depends on the number of the RNs in the cluster. However, the operations for processing the SEU data are a smaller amount, because only an arithmetic mean calculation is performed at CH level. Overall, the complexity of the data processing algorithms at CH and node
Data Type Multiplication/division Addition/subtraction Other
Thermal 4 2k+5 0
Irradiance at 300 nm 4 2k+5 0
Irradiance at 580 nm 4 2k+5 0
Irradiance at 950 nm 4 2k+5 0
TID 8 4k+10 0
29 level is similar, which allows the same hardware to be used for implementation of all the algorithms required for the different roles of the SWIPE WSN node. The main benefit of this is not only simplifying the manufacture of the SWIPE node, but also enabling dynamic switching or reconfiguring the role of the node in order to optimise the routing in the WSN.
7. Outline of numerical experiment
An extensive numerical experiment was designed and successfully implemented using MATLAB as a proof of concept prior to the hardware implementation of the SWIPE nodes. Realistic input data was simulated first to represent the behaviour of the Moon’s environmental parameters, monitored by the SWIPE WSN. For that purpose, parameter variation profiles were developed for each sensed parameter, based on information from relevant literature sources as discussed in section 4, to which the sensors transfer functions were applied to obtain local test data. These test data was then further modified to take into account the locality of the nodes within the network for the purpose of the simulations in this section. This is achieved through the development of an environmental data generator, where each individual node is associated with its unique measurement data set. Essentially, the measurement data is varied based on the nodes locations: the farthest is the node to the centre of the network area, the higher is the data variance applied.
The SWIPE primary mission will study the magnetic anomalies of the Moon and the associated enigmatic lunar swirls, which have a high albedo. There are many swirls on both the near side and the far side of the Moon. Out of the four swirls associated with strong magnetic anomalies, which exceed 20 nT, the Mare Ingenii on the far side has been selected as the targeted area. The SWIPE WSN is designed to support the following three scenarios [36]:
Minimal coverage: 20-40 nodes placed in pre-calculated positions covering an area of 2.5 km2 (5 km x 0.5 km). The number of the nodes can be extended up to 80 with erratic positioning. Preferable coverage: 100-200 nodes placed in pre-calculated positions covering an area 25
km2 (5 km x 5 km). The number of the nodes can be extended up to 400 with erratic positioning.
30 Extended coverage: 280-560 nodes placed in pre-calculated positions covering an area 70 km2 (10 km x 7 km). The number of the nodes can be extended up to 1200 with erratic positioning. The minimal network size is used to cover the darkest and brightest part of the investigated area. Normal coverage is achieved with a square of side 5 km in order to encompass several albedo variations, whereas the extended coverage will be about 7 km wide and 10 km long, in order to encompass the curling shape of the swirl.
Figure 20 shows the three network topologies, which were used for the testing of the above three scenarios. There are 80, 400, and 1200 nodes in each network topology, represented in Figures 44 (a), 44(b) and 44(c), respectively, where the maximum data transmission radius is set to 0.8 km. In each graph, the symbols ‘*’ and ‘o’ denote the RNs and CHs respectively. The virtual backbone, discussed in section 3, which is the main link between each CH, is highlighted in red colour in Figure 20. It allows rapid reconfiguration of the network in case of node failures applying energy-aware routing algorithms [20]. The simulated WSN configurations are summarised in Table 4. The positions of all nodes are randomly selected and their coordinates are recorded. The DS node is also randomly selected from any of the generated nodes.
Table 4 – Network configurations.
The environmental data generator consists of two components: (i) a data origin point processor and (ii) a variance calculator. The data origin point processor generates sensor data samples based on the scientific data models introduced in section 4 for the five different scientific parameters: temperature, irradiance, TID, SEUs and dust.
Networks
Total Number of
nodes
Number of CHs
Number of RNs
Number of DSs
Network Coverage
( km2)
Maximum Transmission
Radius (km)
Network 1 80 9 71 1 2.5 0.8
Network 2 400 51 349 1 25 0.8
31 In the simulation, the data origin point is set to the centre of the network area. Let (x, y) denote the coordinates of a node in a network rectangular area with a width w and length l. Thus, the coordinates of the data origin point are then represented as x0 = w/2 and y0 = l/2. Figure 21 shows the geometrical
relationship of the data origin point at (x0, y0) and a sensor node at (x, y).
Y
pos
it
ion
(km
)
X positions (km)
0 0.5 1 1.5 2 2.5 3 3.5 4 4.5 5
0 0.05 0.1 0.15 0.2 0.25 0.3 0.35 0.4 0.45 0.5
(a)
X positions (km)
Y
pos
it
ion
(km
)
0 0.5 1 1.5 2 2.5 3 3.5 4 4.5 5
0 0.5 1 1.5 2 2.5 3 3.5 4 4.5 5
Y
pos
it
ion
(km
)
X positions (km)
(b)
(c)
0 1 2 3 4 5 6 7 8 9 10
0 1 2 3 4 5 6 7
32
θ (x0, y0)
(x, y)
Data origin Sensor node
O
Figure 21 – Geometrical relationship between the data origin point and a sensor node.
In Figure 21, the data origin point and the sensor node form a vectorOA, where θ and r are the angle and the length of OA respectively. Let T(x0, y0) denotes the sensors’ measurements at the data origin point. The sensors’ measurements T(x, y) at node (x, y) can then be calculated by the variance calculator using the following relationship:
0 0 0 0
( , ) ( , ) ( , ) sin
T x y T x y T x y r (20)
where α is the impact factor of the sensor’s location, which is between [0, 1]. In this simulation, α is set to the value of 0.15, which gives a suitable data variance and ensures that the generated data fit the sensors’ ranges.
All the processed sensor data in a RN are packed together when sending the data to its CH node, whereby each data packet contains one sample of thermal data, three samples of irradiance data (i.e. one sample per wavelength measurement), and two samples of TID data. In addition to these data, dust and SEU sensor data are also included in the packet, when the predefined data acquisition schedule is triggered. The measurement periods for thermal, irradiance and TID are 600 s, and for dust data and SEU data is 637861 s and 3600 s, respectively. The data packet contains also overhead bits (e.g. headers, error check bytes, etc.), which are dependent on the communication protocol, however in the simulation work the metadata are not taken into account. This is because the purpose of the simulation is to evaluate how much measurement data could be reduced as a result of the data processing. For that reason the data packets in section 8 and section 9 consist only of the processed data measurements and vary in size.
33 The main benefit of data fusion is the reduction of the energy consumption for data transmission and reception. The power that will be consumed by the data processing itself will be relatively small, as the data processing tasks will be carried out in the OBC of the SWIPE node, which is a low power microcontroller. The power consumption of the OBC stays more or less the same, if the clock frequency is not altered. However, the amount of the energy consumption for transmitting the data depends on the number of the transmitted bits and the distance of the transmission. Therefore, in this paper, we mainly consider the energy cost of the communication.
For simplicity, a first order radio model is adopted [37], in which a radio dissipates Eelec = 50 nJ/bit to run the transmitter or receiver circuitry and εamp = 100 pJ/bit/m2 for the transmitter amplifier. The equations used to calculate the transmission costs,
E
Tx, and the reception costs,E
Rx, for a k-bit message and a distance d are shown below:2
) ,
(k d E k k d
ETx elec
amp (21)k
E
k
E
Rx(
)
elec
(22)Transmitting and receiving data are high cost operations and, therefore, the number of transmissions and receptions should be minimal. In addition, in case of a symmetric radio channel, the cost to transmit a data packet over a longer transmission distance d, is significantly larger than receiving a packet of the same size. However, since the nodes are placed randomly in this simulation, the transmission distance is not optimised. Hence, the only way to reduce the communication cost is to reduce the number of the bits representing the generated data, which is also one of the main goals of the data processing/fusion processes.
8. Simulation of node level processing algorithms
8.1 Thermal, Irradiance and TID data
The original bit length of the thermal data sample is 12 bits, and the total number of thermal data samples during one Moon synodic cycle is 4,321. Hence, the total number of bits to represent the thermal data generated during one Moon synodic cycle is 51,852 bits.
![Figure 1 – Overall data processing/fusion architecture of the SWIPE node [18].](https://thumb-us.123doks.com/thumbv2/123dok_us/8546204.2304626/4.893.234.669.375.678/figure-overall-data-processing-fusion-architecture-swipe-node.webp)
![Figure 9 – Geometrical position of the three irradiance sensors on the WSN node [30].](https://thumb-us.123doks.com/thumbv2/123dok_us/8546204.2304626/14.893.198.696.711.899/figure-geometrical-position-irradiance-sensors-wsn-node.webp)