DOI: 10.12962/j20882033.v31i1.5636
ORIGINAL RESEARCH
STUDY OF HYDRODYNAMICS AND OVERALL GAS HOLD
UP VALIDATION IN BUBBLE COLUMN BY
COMPUTATIONAL FLUID DYNAMICS
Yukh Ihsana | Sugeng Winardi* | Tantular Nurtono
Dept. of Chemical Engineering, Institut Teknologi Sepuluh Nopember, Surabaya, Indonesia
Correspondence
*Sugeng Winardi, Dept. of Chemical Engineering, Institut Teknologi Sepuluh Nopember, Surabaya, Indonesia. Email: [email protected]
Present Address
Gedung Teknik Kimia, Kampus ITS Sukolilo, Surabaya 60111, Indonesia
Abstract
The study of overall gas hold up has been carried out experimentally with the bed expansion. The superficial gas velocities used for the experiments are 6.369 m/s and 10.616 m/s. The experiment is carried out in a bubble column with inside diame-ters of 7 cm and a height of 100 cm. Gas from the gas cylinder is supplied through a distributor consisting of a perforated plate and glass beads. The perforated plate has a hole diameter of 1 mm and 0.5 mm. Computational Fluid Dynamic (CFD) using a Eulerian coupled with Population Balance model is developed to predict overall gas hold up and bubble size distribution. The effect of superficial gas velocity, per-forated plate diameter, gas properties, and initial liquid level on gas hold up were studied. The use of population balance can significantly improve the overall gas hold-up results compared to constant bubble diameter. It is found that several operating conditions affect the whole gas hold up, namely initial liquid level, superficial gas velocity, and differences in gas properties. While the influence of the difference in perforated plate diameter to overall gas holds up, results are small compared to other operating conditions.
KEYWORDS:
Bubble Column, CFD, Gas Hold Up, Perforated Plate Distributor, Population Balance
1
INTRODUCTION
The bubble column is a multiphase contactor. It is widely used in chemical, biochemical, metallurgical industries, and petro-chemical. Notably, the bubble column is used in the absorption process. The efficiency of this type of contactor is significantly affected by mass transfer between phases. Mass transfer can be increased by increasing the interfacial area, the type of solvent and gas contacted, and the residence time of bubbles in the column[1]. The gas hold up is also an important parameter that
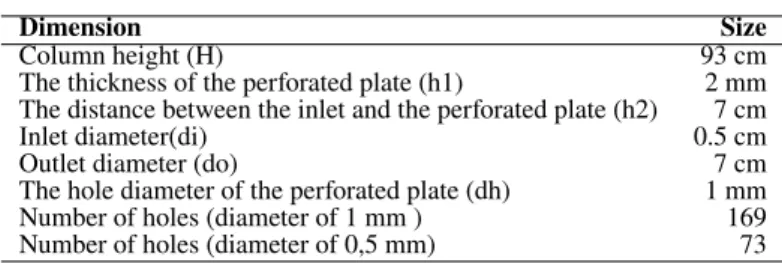
TABLE 1 Dimension of bubble column.
Dimension Size
Column height (H) 93 cm
The thickness of the perforated plate (h1) 2 mm The distance between the inlet and the perforated plate (h2) 7 cm
Inlet diameter(di) 0.5 cm
Outlet diameter (do) 7 cm
The hole diameter of the perforated plate (dh) 1 mm Number of holes (diameter of 1 mm ) 169 Number of holes (diameter of 0,5 mm) 73
for increasing residence time in the bubble column. The more gas or bubbles trapped in the column, the longer contact time between the gas and liquid in the column. It is related to bubble size distribution, which allows determining interfacial area and mass transfer[2]. Other parameters that significantly affect the performance of the bubble column are column diameter, column
height, and distributor design. The selection of operating conditions for column design must also be considered.
Although the bubble column has a simple geometry, hydrodynamic, transport characteristics, gas-liquid interactions make it dif-ficult to design and scale-up. Hence, a comprehensive study of fluid dynamics in the bubble column is required. Some researcher has used Computational Fluid Dynamics (CFD) to simulate multiphase interaction in the bubble column. Typically, It has two basic models that can apply to simulate, namely Euler-Euler and Euler-Lagrange. The first approach, namely Euler-Euler treats the gas phase and liquid phase motion as homogeneous or interpenetrating continua. The liquid phase is continuous, while the gas phase is the disperse. Euler-Euler model is commonly used due to the lesser computational cost compare to Euler-Lagrange[3].
The hydrodynamic phenomenon in the bubble column is strongly influenced by the dissipation rate, which causes the turbulent flow. The turbulent flow causes a bubble to coalesce and break. The population balance model can know this phenomenon. Coa-lescence and breakage of bubbles require a Population Balance Equation (PBE). The PBE was carried out by discretization into the N-class bubble size. This process could be coupled with two liquid models[3].
In the previous work, the overall gas hold up is known experimentally with the bed expansion method by knowing the difference in the level of the liquid before and after the gas flowed in the bubble column. The experiment found several factors that could influence the gas hold-up, including gas flow rate, the concentration of the solution, perforated plate diameter, and initial liquid level.
In this paper, we study the design of the bubble column with a distributor that consists of glass beads and a perforated plate. To model the bubble column correctly, simulations and experiments were carried out. The results of the simulations were used for the evaluation of the bubble column design. It can enhance the absorption experiment and validate hydrodynamic parameters such as overall gas hold up between the experiment and the simulations. The effect of using bubble breakage and coalescence phenomena by population balance would be compared to the using of constant bubble diameter in selecting the right model. Furthermore, the effect of gas flow rate, perforated plate diameter, gas properties, and initial liquid level on overall gas hold-up would also be observed.
2
MATERIAL AND METHOD
The two-phase system simulation in the bubble column is carried out in full 3D using the ANSYS FLUENT® 18.2 Academic Package commercial software. Figure 1 shows the geometry scheme of the bubble column used in this study. The calculation is done in transient mode using the Eulerian model, where the liquid is a continuous phase and the gas as the dispersed phase. Table 2 shows the specification of the bubble column.
FIGURE 1 The geometry scheme of the bubble column.
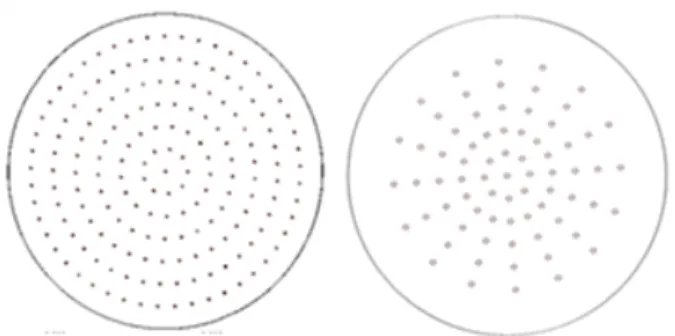
FIGURE 2 Perforated plate holes diameter of 1 mm
(left) 0.5 mm (right).
TABLE 2 The material properties.
Materials Density Viscosity
𝐶𝑎(𝑂𝐻)2Solution 994.175 kg/m3 0.0037721 kg/m.s
Mixture gas (𝐶𝑂230%,𝐶𝐻470%) 1.2 kg/m3 1.72 x 10⁻⁵ kg/m.s
Pure𝐶𝑂2 1.7878 kg/m3 1.37 x 10⁻⁵ kg/m.s
There are two types of gas used in the experiment and simulation, namely pure𝐶𝑂2and mixture gas that consist of (𝐶𝑂230% and𝐶𝐻470%). The bubble column is made of acrylic with an inside diameter of 7cm, and a height of 100 cm. Gas from the gas cylinder is supplied through a distributor consisting of a perforated plate and glass beads. Figure 2 shows the perforated plate holes. The perforated plate has a hole diameter of 1 mm with several holes 73 and a diameter of 0.5mm with several holes 169. Perforated plate is used to contact bubbles with a solution of𝐶𝑎(𝑂𝐻)2. The operation runs at 30oC and atmospheric pressure. At the bottom of the column, there are glass beads with an average diameter of 0.3 cm.𝐶𝑎(𝑂𝐻)2solution is filled in a bubble column with a certain height, while the gas is fed from the bottom of the bubble column. In the previous work, the overall gas hold up is known experimentally with the bed expansion method, namely by knowing the difference of the liquid before and after the gas flowed in the bubble column. Then the overall gas hold up can be calculated by equation 1.
𝜉 = 𝐻𝑖−𝐻𝑜
𝐻𝑖 (1)
Where Hi and Ho is the liquid level liquid after and before gas flowed in the bubble column, respectively.
2.1
Hydrodynamic Model
The gas-liquid flow is simulated using the Eulerian model. The liquid is treated as a continuous primary phase, while the gas is a dispersed secondary phase. The mass and momentum of the gas-liquid phase conservation equation are represented in the general equation 2 and 3, respectively.
𝜕𝛼𝑘𝜌𝑘
𝜕𝑡 + ∇⋅(𝛼𝑘𝜌𝑘𝑢𝑘) = 0 (2)
𝜕𝛼𝑘𝜌𝑘
Where𝑘index represents the gas phase and liquid. The𝑢is the velocity vector. The𝛼is the volume fraction of gas and liquid. The total volume fraction is 1. Theρ,τ, and𝐹𝑖𝑘represent density, stress-strain tensor, and momentum exchange. Total interfacial
force𝐹𝑖𝑘between the two phases included in this simulation, is a drag force by ignoring lift force, turbulent dispersion force, and wall force.
Gas-liquid interphase drag force can be expressed in the equation 5.
𝐹𝐷,𝑙 =𝐾𝐷,𝑔𝑙(𝑢𝑔−𝑢𝑙) (4)
𝐾𝐷,𝑔𝑙is the change in the momentum of the interphase gas-liquid coefficient stated in the equation 4.
𝐾𝐷,𝑔𝑙= 3 4𝛼𝑔𝛼𝑙𝜌𝑙
𝐶𝐷,𝑔𝑙
𝑑𝑏 |𝑈𝑔−𝑈𝑙| (5)
Where 𝐶𝐷 drag coefficient is taken when calculating the hydrodynamic interaction between bubbles, and db is the bubble diameter. The Schiller-Nauman model[4] drag coefficient is used to be recommended to describe the gas-liquid interaction in
a bubble column in small and large bubbles. The turbulence model of the RNG model is suggested to simulate the bubble column[5].
2.2
Population Balance
The gas flowing in the liquid would cause a turbulent flow pattern. The flow pattern and collisions between bubbles cause bubbles to break up and coalesce with each other. The existence of this phenomenon causes the formation of different bubble sizes. Bubble distribution is an essential parameter in mass transfer and reaction process. The population balance model can know this phenomenon. In this work, the Class Method with bubble classes is implemented in the CFD program[6, 7].
The gas phase is assumed to be composed of 6 discrete bubble sizes, and a discretized population balance equation is solved for bubble density along with birth and death term due to breaking up and coalescence.
𝜕 𝜕𝑡
(
(𝜌𝐺𝑛𝑖) + ∇⋅(𝜌𝐺𝑈⃗𝐺𝑛𝑖))𝐾𝐷,𝑔𝑙=𝜌𝐺(𝐵𝑖𝐶−𝐷𝑖𝐶𝐵𝑖𝐵−𝐷𝑖𝐵) (6)
Where𝑛𝑖is the number of bubble group𝑖,𝐵𝑖𝐵, and𝐵𝑖𝐶are the birth rates due to breaking up and coalescence respectively, and 𝐷𝑖𝐵and𝐷𝑖𝐶 is the death rate. The bubble breakup and coalescence model by Luo and Svendsen[8]are used in this work. In this
equation, the growth of the bubble due to mass transfer is neglected because this term has a small effect on population balance in low gas solubilities[9].
2.3
Porous Model
For the part of the distributor that consist of glass beads is modeled as a porous zone. The porosity could be calculated by equation 7.
𝜖 = 𝑉 𝑜𝑖𝑑𝑉 𝑜𝑙𝑢𝑚𝑒
𝐵𝑒𝑑𝑉 𝑜𝑙𝑢𝑚𝑒 (7)
Inertial resistance and viscous resistance are obtained from Ergun’s equation[10].
𝑣𝑖𝑠𝑐𝑜𝑢𝑠 𝑟𝑒𝑠𝑖𝑠𝑡𝑎𝑛𝑐𝑒= 150(1 −𝜖) 2
𝐷𝑝2𝜖3 (8)
𝑖𝑛𝑒𝑟𝑡𝑖𝑎𝑙 𝑟𝑒𝑠𝑖𝑠𝑡𝑎𝑛𝑐𝑒= 3.5(1 −𝜖)
TABLE 3 The bubble size.
Bin Number Bubble Size
Bin 0 0.012004528 Bin 1 0.0075623785 Bin 2 0.004746 Bin 3 0.0030011319 Bin 4 0.0018905946 Bin 5 0.001191
TABLE 4 The numerical schemes used in the simulation.
Model/Equation Scheme
Momentum First Order Upwind Turbulent model First Order Upwind Population balance model First Order Upwind Transient formulation First Order Implicit Pressure-velocity coupling Phase Coupled SIMPLE
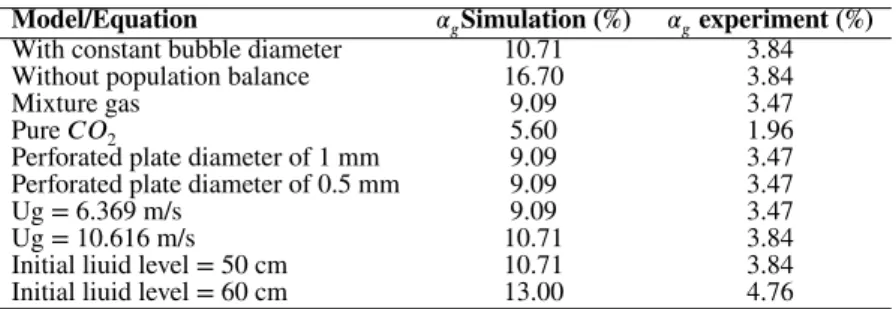
TABLE 5 The overall gas hold up comparison between experiment and simulation.
Model/Equation 𝛼𝑔Simulation (%) 𝛼𝑔experiment (%)
With constant bubble diameter 10.71 3.84 Without population balance 16.70 3.84
Mixture gas 9.09 3.47
Pure𝐶𝑂2 5.60 1.96
Perforated plate diameter of 1 mm 9.09 3.47 Perforated plate diameter of 0.5 mm 9.09 3.47
Ug = 6.369 m/s 9.09 3.47
Ug = 10.616 m/s 10.71 3.84
Initial liuid level = 50 cm 10.71 3.84 Initial liuid level = 60 cm 13.00 4.76
Whereε,𝐷𝑝is porosity and diameter of glass beads, respectively.
2.4
Numerical Solution Strategy
The governing equation is solved by ANSYS FLUENT® 18.2 Academic Package commercial software. The mesh used in this simulation is tetrahedral. For the first, constant diameter is used to know the effect of the use of population balance in the simulation. For the initial study, simulation is carried out with a continual bubble diameter, 3 mm bubble diameter is chosen because this diameter can represent gas hold up well and in accordance with the experiment[11]. The use of these diameters
shows good results if the superficial gas velocity used does not exceed 12 m/s. Therefore, for the initial study used a constant bubble diameter of 3 mm. For the use of population balance, six ranges of bubble sizes are used. The ranges of bubble sizes can be seen in Table 3 .
For the initial and boundary conditions, superficial gas velocities are set at the gas inlet. While zero is set for the liquid velocity. The pressure at the top and wall is set to pressure outlet and no-slip boundary condition, respectively. Gas is introduced from the inlet (αg = 1) and (αl = 0). The zone in the bubble column is divided into two parts, namely the liquid zone located at a certain height and the zone above that is the freeboard. While at liquid zone is patched with the volume fraction of gas (αg = 0) and volume fraction of liquid (αl = 1). Above this level liquid (freeboard) is gas and liquid volume fraction of (αg = 1) and (αl = 0). For the constant bubble size diameter of 3 mm is used in the bubble inlet size. For the population balance, the volume fraction of the 3mm bubble size located in bin 0 is set 1 in the inlet. For the part of the distributor that consist of glass beads is modeled as a porous zone. The time step and under relaxation used in this simulation is 0.001 second and 0.75 seconds, respectively. The first-order upwind scheme solves the rest of the transport equations. For the details, the numerical scheme can be seen in Table 4 .
3
RESULTS AND DISCUSSION
3.1
Overall Gas Hold Up With and Without Population Balance
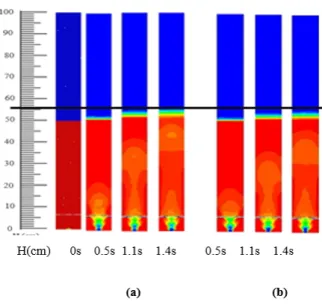
FIGURE 3 Overall gas hold up in different gas
proper-ties (a) mixture gas (b) Pure𝐶𝑂2.
FIGURE 4 Overall gas hold up in perforated plate
diam-eter of (a) 1 mm (b) 0.5 mm.
gas hold up by using population balance are closer to the experiment results than using a constant bubble diameter. It is known in the experiment that the change of liquid level after the gas flowed in a column is equal to 2 cm or with an overall gas hold of 3.84%. Whereas the transformation of a liquid level obtained with the population balance and without population balance is equal to 6 cm and 10 cm respectively or with an overall gas hold of 10.71% and 16.7% respectively, as seen in Table 5 . This difference in results also affects the flow pattern and gas movements in the bubble column. This is because the population balance model involves the breakup and coalescence of bubbles. With increasing dissipation rate, it would cause increasing eddy turbulent, which is very influential in increasing the probability of different bubble sizes[12].
Figure 3 also shows the difference in rising velocity gas between the use of population balance models and constant diameters. At the population balance, as shown in Figure 4 , bubbles with a size of 12 mm dominate in the bubble column. The large proportion of the bubble has a rising velocity that is greater than the bubble with a smaller scale[13].
3.2
The Effect of Gas Properties on The Overall Gas Holds Up
Figure 3 illustrates the typical overall gas hold up in the difference of gas properties used. Simulations are carried out at the superficial gas velocity (Ug), liquid level, and perforated plate diameter of 6.369 m/s, 50 cm, and 1 mm, respectively. As shown in Figure 3 , mixture gas has a higher overall gas hold compared to pure𝐶𝑂2. It is known in the experiment that the change of liquid level after the gas flowed in a column in the mixture gas and pure𝐶𝑂2is equal to 1.8 cm and 1 cm, respectively. Whereas in the simulation, the change of liquid level obtained in the mixture gas and pure 𝐶𝑂2 is equal to 5 cm and 3 cm, respectively, or with overall gas hold up of 9.09% and 5.6% respectively, as seen in Table 5 . This is because mixture gas has a lower density compared to pure𝐶𝑂2. But this result is not too much different. Low density gas has a different bubble size distribution than high-density gas[14]. Lower density gas produces larger bubble sizes. This massive bubble size causes an
FIGURE 5 Distribution of bubble size in the bubble column with the different perforated plate diameter.
FIGURE 6 The radial profile of gas hold up under
dif-ferent diameter of the perforated plate (a) 1 mm and (b) 0.5 mm.
FIGURE 7 Overall gas hold up in difference superficial
velocity (a) 6.369 m/s (b) 10.616 m/s.
3.3
Effect Diameter of Perforated Plate
Figures 4 are typical axial gas hold up, and radial gas hold up on different perforated plate diameter. Simulations are carried out in mixture gas at the superficial gas velocity (Ug) and liquid level of 6.369 m/s, and 50 cm, respectively. It can be seen in Table 5 , and Figure 4 that overall gas hold up on both perforated plate diameters are not much different. It seems that with this configuration, there is no apparent difference between gas hold up and flow patterns. The distance between holes from one another dramatically impacts the size of the bubbles formed. The fine and disperse formation of bubbles is more expected in the industry.
FIGURE 8 The radial bubble size distribution in different superficial velocity (a) 6.369 m/s (b) 10.616 m/s.
This result can also be seen in the radial gas hold up profile found in Figure 6 . At the height of 7 cm above the perforated plate, there are many dead zones found in the 0.5 mm perforated plate diameter compared to the 1 mm perforated plate diameter. Increasing the height of the column, at the height of 7.5 cm and 8 cm, bubbles on both perforated plates coalesce with each other to form larger bubbles and concentrated in the center of the column. Bubbles with a size more significant than the critical diameter (5.8 mm) have a negative lift force coefficient that drives the movement of bubbles tending to the center of the column rather than near the wall[15–18]. It is also seen that the two types of perforated plates are dominated by bubble size formation
above 5 mm. Bubble distribution tends to be the same when the gas moves towards the surface. This is because the farther the bubble moves upward away from the perforated plate, the higher the potential for bubbles to coalesce to form bigger bubbles.
3.4
Effect of Superficial Velocity on The Overall Gas Hold Up
To understand the impact of superficial gas velocity on gas hold up and flow patterns, the bubble column with the perforated plate of 1 mm was used. Simulations were carried out at the superficial gas velocity (Ug) 6.369 m/s and 10.616 m/s. The gas used is mixture gas. The effect of superficial gas velocity on the overall gas hold-up profile can be seen in Figure 7 . When superficial gas velocity increases, more gas is spread out from the distributor holes, and overall gas holds up increases significantly. It is known in the experiment that the change of liquid level after the gas flowed in a column at a superficial velocity of 6.369 m/s and 10.616 m/s is equal to 1.8 cm and 2 cm, respectively. Whereas in the simulation, the changes of a liquid level obtained in the superficial velocity of 6.369 m/s and 10.616 m/s are 5 cm and 6 cm, respectively. Thus, the overall gas holds up of 9.09% and 10.71%, respectively (as seen in Table 5 ). With the increase of superficial velocity gas, eddy turbulent is also increasing, which triggers the breakup and coalescence of bubbles[12].
FIGURE 9 Overall gas hold up in different initial liquid level (a) 50 cm (b) 60.
3.5
The Effect of Liquid level on The Overall Gas Holds Up
The effect of the initial liquid level on overall gas hold up can be seen in Figure 9 . Observations are made at the superficial gas velocity and perforated plate diameter of 10.616 m/s and 1 mm, respectively. The gas used is mixture gas. From Figure 9 , it can be seen that with increasing initial liquid level gas hold up would increase.
It is known in the experiment that the change of liquid level after the gas flowed in a column at the level liquid of 50 cm and 60 cm is equal to 2 cm and 3 cm, respectively, with the overall gas hold up is 3.84% and 4.76% respectively. Whereas in the simulation, the changes of a liquid level obtained in the superficial velocity of 50 cm and 60 cm are 6 cm and 9 cm respectively or with an overall gas hold of 10.71% and 13.04% respectively, as seen in Table 5 . The increase in gas hold up affected by liquid level is more significant than the increased gas hold up affected by superficial gas velocity and perforated plate diameter, as discussed earlier. This might be because the ratio between the initial liquid level and bubble column diameter (H/D) still has a significant effect on gas hold up with the increasing of initial liquid level. The choice of the ratio of initial liquid level to column diameter greatly influences gas hold up. The changes in gas hold up occur significantly if the ratio initial liquid level and column diameter (H/D) is less than 5 with a column diameter of less than 20 cm[11, 14]. Conversely, if the ratio (H/D) of more than five
would not significantly change the gas hold up and would tend to be constant. If the column diameter is added, it would also have insignificant effect on gas hold up even though the ratio (H/D) is less than 5.
4
CONCLUSION
Several results show the same trend towards operating conditions that affect overall gas hold up, flow characteristics, and bubble size distribution. The use of population balance improves the whole gas hold up results compared to the use of a constant bubble diameter. However, the results are still quite far from the results of the experiment. Several parameters have not been considered in this simulation, such as the use of lift force, wall lubricant force, virtual mass, or other influences. Therefore, the simulation results are close to the experimental result. Several factors have a significant effect on overall gas hold up, namely initial liquid level, superficial gas velocity, and differences in gas properties. In contrast, the perforated plate diameter difference does not have a significant effect on the overall gas hold-up.
References
2. Dhanasekharan KM, Sanyal J, Jain A, Haidari A. A Generalized Approach to Model Oxygen Transfer in Bioreactors Using Population Balances and Computational Fluid Dynamics. Chemical Engineering Science 2005;60(1):213–218.
3. Syed AH, Boulet M, Melchiori T, Lavoie JM. CFD Simulations of an Air-Water Bubble Column: Effect of Luo Coalescence Parameter and Breakup Kernels. Frontiers in Chemistry 2017;5:68.
4. Schiller L, Naumann A. A Drag Coefficient Correlation. ZVerDeutschIng 1935;77:318–320.
5. Masood RMA, Delgado A. Numerical Investigation of the Interphase Forces and Turbulence Closure in 3D square Bubble Columns. Chemical Engineering Science 2014;108:154–168.
6. Ramkrishna D. Population Balances Theory and Applications to Particulate Systems in Engineering. 1 ed. San Diego, California: Academic Press; 2000.
7. Kumar S, Ramkrishna D. On the Solution of Population Balance Equations by Discretization - I. A Fixed Pivot Technique. Chemical Engineering Science 1996;51(8):1311–1332.
8. Luo H, Svendsen HF. Theoretical Model for Drop and Bubble Breakup in Turbulent Dispersions. AIChE Journal 1996;42(5):1225–1233.
9. Alopaeus V, Koskinen J, Keskinen KI, Majander J. Simulation of the Population Balances for Liquid-Liquid Systems in A Nonideal Stirred Tank. Part 2-Parameter Fitting and the Use of the Multiblock Model for Dense Dispersions. Chemical Engineering Science 2002;57(10):1815–1825.
10. Ergun S, Orning AA. Fluid Flow Through Randomly Packed Columns and Fluidized Beds. Industrial & Engineering Chemistry 1949;41(6):1179–1184.
11. Kumar S, Srinivasulu N, Khanna A. CFD Simulations to Validate Two and Three Phase Up-Flow in Bubble Columns. International Journal of Chemical and Molecular Engineering 2011;5(11):975–980.
12. Wang T, Wang J, Jin Y. Theoretical Prediction of Flow Regime Transition in Bubble Columns by the Population Balance Model. Chemical Engineering Science 2005;60(22):6199–6209.
13. Li W, Zhong W, Jin B, Xiao R, Lu Y, He T. Study of the Particle Size Effect on Bubble Rise Velocities in a Three-Phase Bubble Column. International Journal of Chemical and Molecular Engineering 2013;7(12):971–975.
14. Kanaris, Athanasios G, Theodosios I Pavlidis, Ariadni P Chatzidafni AAM. The Effects of the Properties of Gases on the Design of Bubble Olumns Equipped with a Fine Pore Sparger. ChemEngineering 2018;2(1):11.
15. Lucas D, Krepper E, Prasser HM. Prediction of Radial Gas Profiles in Vertical Pipe Flow on the Basis of Bubble Size Distribution. International Journal of Thermal Sciences 2001;40(3):217–225.
16. Lucas D, Krepper E, Prasser HM. Use of Models for Lift, Wall and Turbulent DispersionPoly-Disperse Flows. Chemical Engineering Science 2007;62(15):4146–4157.
17. Lucas D, Krepper E, Prasser HM, Manera A. Investigations on the Stability of the Flow Characteristics in a Bubble Column. Chemical Engineering & Technology 2006;29(9):1066–1072.
18. Lucas D, Prasser HM, Manera A. Influence of the Lift Force on the Stability of a Bubble Column. Chemical Engineering Science 2005;60(13):3609–3619.
How to cite this article:Ihsana Y., Winardi S., Nurtono T. (2020), Study of Hydrodynamics and Overall Gas Hold Up Validation