Testing VF Cir
Testing VF Circuits at T1 Access
Points with the T-BERD 224
Overview
Communication networks are evolving from ag-ing analog systems to improved digital systems. Digital technology and equipment provides a simpler, more cost-effective method of increasing transmission quality. But the transition is not occurring overnight, and there is a large overlap and mix of analog and digital equip-ment. Upgrading from analog to digital equipment typi-cally begins in the center of the network and grows to-ward the endpoints. Consequently, many voice and data signals which are transmitted via analog circuits are converted into digital signals at some point along the transmission path so that they can be transmitted within the digital network.
Confusion and problems arise when technicians and engineers have to maintain and troubleshoot com-bined analog/digital networks. How do you test analog circuits from digital access points? How are analog im-pairments translated into a string of logical ones and zeros? What tests are valid and useful? What do the results reveal about the problem and its location? This
Application Note will address these questions and provide solutions and troubleshooting techniques using
the TTC (Telecommunication Techniques Corporation)
T-BERD 224 PCM Analyzer, a T1 channel access test set which isolates and tests one of the 24 converted analog signals within the digital T1 circuit.
Background
Analog transmission circuits, the age-old work-horses of communication networks, are often referred to as voice frequency (VF) circuits because they
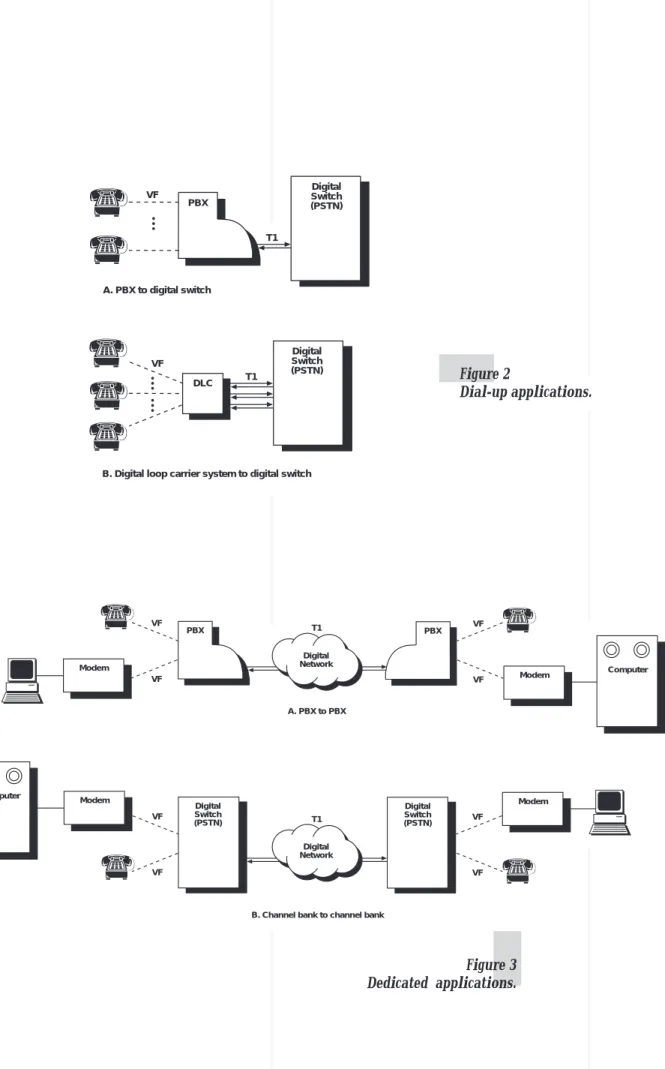
tradition-ally have carried voice traffic within the voice frequency bandwidth (40 Hz to 3900 Hz). However, with the advent of modems, VF circuits have been able to transmit data (i.e., logical ones and zeros) in an analog waveform. Regardless of circuit content, whether voice or data, VF circuits take one of two forms: dail-up or dedicated. Dial-up VF circuits transmit voice or data (via modems) within the Public Switched Telephone Network (PSTN). Dedicated VF circuits typically transmit data via modems over a private line, point-to-point, unshared transmission path.
Through the technology of pulse amplitude modulation, pulse code modulation, and multiplexing, analog waveforms are now converted to digital signals so that they can be transmitted within a digital network. As more and more analog circuits are converted to digital, a digital network begins to evolve. Many indivi-dual circuit conversions from analog to digital begin with the use of digital T-Carrier equipment, such as channels banks, multiplexers, and private branch ex-changes (PBXs). The T1 equipment converts a VF signal to a digital stream of logical ones and zeros, multiplexes it with 23 other signals, and transmits it within one of the T1 circuit’s 24 channels. Network conversions be-gin when enough T1 equipment, connected via T1 cir-cuits, is operating at key central locations. The connec-tions form a backbone which can be used to connect far-end sites via analog or digital circuits as shown in
Figure 1.
T1 circuits that carry VF signals include interof-fice trunks, PBX trunks, digital loop carrier (DLC) cir-cuits, digital cross-connects (DCS), and private hi-cap circuits. As an example, DLC systems connect up to 96 analog subscribers to a switch within a central office (CO) via T1 circuits. While the circuits between the CO
Testing VF Cir
Figure 1
T1 backbone network.
Analog impairments can be detected from a digital access point because analog errors are encoded along with the VF signal. Digital encoders/decoders (codecs), the equipment which converts the analog signal to a digital form and vice versa, cannot differen-tiate analog errors from the original VF signal and so encodes/decodes the errors too. Furthermore, impair-ments which may be apparent only in the decoded ana-log form may be caused by codecs. Consequently, the digitized form of the analog signal will include any impairments originally in the analog signal as well as possible modifications from the codec.
Analog impairments can be divided into nine separate classifications as described below.
Figures 4 through 12 provide graphic displays of each impairment.
switch and the far-end DLC are digital, the signals transmitted over the local loops between the
subscrib-ers and the remote DLC terminal are analog. Figures
2 and 3 show some T1 applications which specifically include VF signals.
The layout of digital networks can cause prob-lems for those who have to troubleshoot analog circuits because the technicians and engineers are typically lo-cated at purely digital central locations; an analog form of the signal does not exist at these locations. How does one get at VF problems from the center of the network? Technicians need easy access to the VF circuit to verify the trouble. T1 channel access sets, such as TTC’s T-BERD 224, enable technicians to tap a digital T1 circuit and access one of the faulty “analog” signals without disrupting the remaining 23 channels. Once the signal is accessed, the technician performs a variety of tests to determine the source of the fault.
Modem Computer Modem Analog Analog Analog Analog T1 T1 T1 T1 T1
Testing VF Cir
Digital Network Modem Computer Digital Switch (PSTN) A. PBX to PBX PBX Digital Switch (PSTN) T1 VFB. Channel bank to channel bank Modem PBX VF VF VF VF Modem VF T1 Modem Computer VF VF Digital Network Digital Switch (PSTN) A. PBX to digital switch T1 DLC PBX VF Digital Switch (PSTN) T1 VF
B. Digital loop carrier system to digital switch
Figure 3 Dedicated applications. Figure 2
Testing VF Cir
Analog Impairments
Attenuation
Attenuation is the loss of VF signal level typically
seen as a loss of amplitude (see Figure 4). Attenuation
is manifested in low volume voice conversations. When using data modems, attenuation can prevent detection of carrier tones, or cause inadvertent data errors due to misinterpretation of the signal.
Attenuation is caused by many sources, includ-ing resistive losses in metallic transmission media. At-tenuation losses are recovered by using amplifiers which duplicate a recovered VF signal at a greater amplitude.
The analog signal’s attenuation, which occurred
before the signal reached the digital encoder, should
not be confused with attenuation of the digital signal.
The analog signal’s level, attenuated or not, is encoded as a specific string of logical ones and zeros. The digital signal’s level is a direct measure of the digital signal’s amplitude. Modifying the digital signal’s level will not impact the VF signal’s amplitude because the encoding of ones and zeros remains the same. So, the analog signal level is independent of the T1 signal level.
Attenuation Distortion
Attenuation distortion is the loss of VF signal level at various frequencies, most often at the higher and/
or lower limits of the frequency range (see Figure 5).
This distortion causes various, intermittent symptoms such as muffled (high-frequency attenuation) or hissing (low frequency distortion) speech.
Loss (dB) 15 10 5 0 1000 2000 3000 4000 Frequency (Hz) Figure 5 Attenuation distortion. VF Circuit Input -16 dBm Output -26 dBm Figure 4 Attenuation.
Testing VF Cir
Attenuation distortion may not always be appar-ent since men who have low voices do not stress the higher frequency range, while women and children who have high voices do not stress the lower range. While attenuation distortion may not always be apparent during a conversation, distortion, particularly at the higher fre-quencies, is readily apparent during data transmission due to data’s full use of the available bandwidth.
Attenuation distortion is often caused by capaci-tive and induccapaci-tive reactances, carrier filters, loaded cables, transformers, and bridge taps. Each of these, especially loading coils, acts as a filter with limited frequency bandpass and creates distortion at the ends of the frequency range.
DC Offset
DC offset is a DC amplitude modification of the original analog signal due, for example, to a “stuck bit” in a digital/analog codec in the transmission path (see
Figure 6). As an example, recall that the original analog signal is sampled 8,000 times per second and that each sample is assigned an 8-bit code. If the codec malfunctions and assigns the first bit position to a logical one for every sample (a “stuck bit”), the decoded signal will be modified such that a positive or negative component will exist in the analog output which will impair the signal.
NOTE: For T-Carrier systems, DC offset is a per channel measurement, not an analysis of the T1 signal’s voltage.
Noise
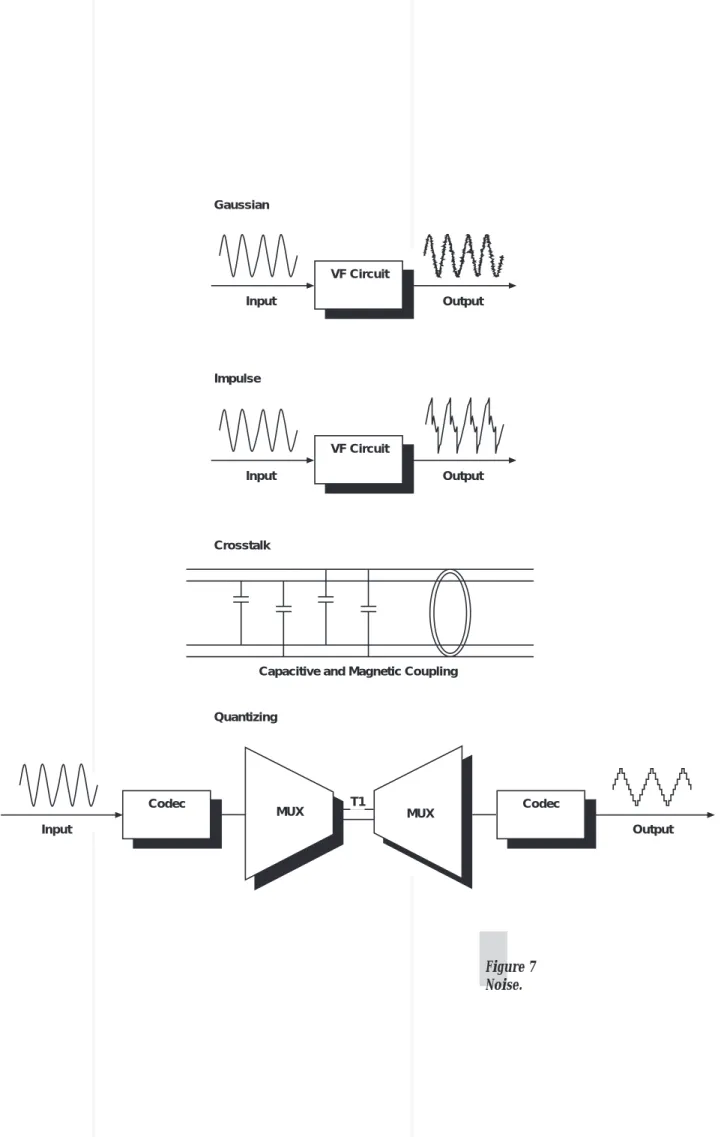
Noise is the basic corruption of the original VF signal; it is any unwanted signal present in the original
signal (see Figure 7 on the next page). Noise is found
in many forms because of its multiple origins:
• Gaussian noise (a.k.a. white or random noise) is commonly heard as a background hiss. Gaussian noise is caused not only by electri-cal interference from a variety of sources
includ-ing fluorescent lights, but also by thermal noise sources such as faulty electrical components on circuit boards.
• Impulse noise, often intermittent, sounds like occasional snaps and pops and can disrupt sig-nal quality and cause data errors. Impulse noise is primarily caused by switching and signaling equipment, and is electrical storms. In addition, bit error bursts in the digitized analog signal will be manifested as impulse noise in the VF domain. • Crosstalk noise is a coupling of two signals such that another conversation may be heard and possibly deciphered, depending on the severity of the impairment. Crosstalk is caused by poor cable routing, splicing, or insulation such that the signals can be coupled via water or electrical fields.
• Quantizing noise is a distortion brought about by digital codecs that do not reproduce the analog signal exactly due to a finite number of “decision” levels in the analog/digital con-version process. Quantizing noise is a function of the analog/digital conversion and cannot be totally eliminated. VF Circuit Input Output DC Offset Figure 6 DC offset.
Testing VF Cir
MUX MUX Codec
T1 Codec Input Output VF Circuit Input Output VF Circuit Input Output Gaussian Impulse Crosstalk Quantizing
Capacitive and Magnetic Coupling
Figure 7 Noise.
Testing VF Cir
Echo
Echo is recognized as a reflection of the transmit-ted or received VF signal which occurs momentarily
after the original transmission or reception (see Figure
8). Echoes are most commonly found in mixed 2-wire/
4-wire circuits, and are due to an impedance mismatch at the 2- to 4-wire junctions.
Talker echo occurs when the original speech is reflected at the far 4- to 2-wire junction and returns to the talker. Sometimes the originator will think that he is talking into a tunnel because of the echo he hears.
Listener echo occurs when the talker’s speech is reflected from near 4- to 2-wire junction, back to the far 2- to 4-wire junction, and back again to the listener. Due to impedance mismatches at both locations, the receiver will hear the conversation twice.
Envelope Delay Distortion (EDD)
EDD is a phase nonlinearity where the
transmis-sion delay for certain frequencies, typically those at
the edges of the frequency range, is greater than others
(see Figure 9 on the next page). (This phenomenon is
different from attenuation distortion which affects the
signal level at various frequencies.)The high and low
frequencies take longer to pass through the circuit due to excessive capacitive and inductive reactances brought about by circuit conditions such as load coils and bridge taps.
EDD primarily affects data traffic, especially as bandwidth increases (>9.6 kb/s), because the entire voice frequency range is fully exercised. EDD analysis is typically performed only on special order “condi-tioned” circuits to verify that all bridge taps, load coils, etc. are removed before service turn-up.
2W/4W Hybrid 4W/2W Hybrid Talker Echo Listener Echo Figure 8 Echo.
Testing VF Cir
Delay (ms) 3 2 1 0 1000 2000 3000 4000 Frequency (Hz) Figure 9 Envelope delay distortion.Phase and Amplitude Jitter
Phase and amplitude jitter are two impairments which do not affect voice signals so much, but primarily affect data transmission, especially at higher
band-widths (>9.6 kb/s) (see Figure 10). Phase jitter is
a modulation of a signal’s frequency. Amplitude jitter is a modulation of a signal’s amplitude. Both are typically caused by coupling from power line equipment and ring generators.
Intermodulation Distortion (IMD)
IMD (a.k.a. nonlinear distortion) of a VF tone or signal is characterized by additional frequencies which are multiples of the fundamental frequency (see
Figure 11). IMD is caused by nonlinearities such as
clipping or limiting, which modify the analog signal as it passes through the telephone system. These nonlinearities are caused most often by line repeaters which amplify the signal, as well as by transformers and inductive components.
Transients
Transients are intermittent faults, much like impulse noise, which are the result of intermittent phe-nomena such as electrical storms, switching equipment,
and signaling equipment (see Figure 12 on page 10).
There are three types of transients:
• Dropouts are sudden and momentary de-creases in the VF signal level.
Testing VF Cir
VF Circuit Input Output Phase VF Circuit Input Output Amplitude Figure 10 Jitter. Figure 11 Intermodulation distortion. VF Circuit Original Frequency 1000 Hz Input 1000 Hz Second Harmonic 2000 Hz Third Harmonic 3000 HzTesting VF Cir
VF Circuit Input Output Dropouts VF Circuit Input Output Gain Hits VF Circuit Input Output Phase Hits Figure 12 Transients.• Gain hits are sudden and momentary increases in the VF signal level.
• Phase hits are sudden and momentary changes in phase.
Specifications regarding the duration and amplitude of intermittent faults have been developed that differentiate transients from impulse noise. Typi-cally, transients must last for at least 4 ms.
Corrective Action
VF transmission circuits can be engineered, or “conditioned”, to minimize the sources of error which disrupt service quality, especially for data transmissions >9.6 kb/s. Conditioning typically includes the removal of echo cancelers, load coils, and bridge taps. Without line conditioning, data transmission bandwidths are generally restricted to <9.6 kb/s and distances are limited to 50 miles or less.
Testing VF Cir
Distinguishing
VF Channel Problems
from T1 Circuit Problems
VF circuit analysis can be performed from either analog or digital (T1) access points. Testing a VF circuit from a T1 access point requires a T1 channel access set, such as the T-BERD 224, so that the specific VF channel can be isolated from the T1 circuit’s remaining 23 channels. Then, technicians can analyze both the T1 circuit and the VF channel simultaneously, comparing results to determine where the problem is.
NOTE: When testing VF circuits from T1 access points, it is important to ana-lyze not only the VF channel results, but also the in-service T1 circuit results. Otherwise, T1 circuit prob-lems may be incorrectly interpreted as a VF problem.
For instance, common subscriber voice circuits are often transmitted via a T1 circuit through the inter-office network. Noise such as pops and crackles are heard on the VF circuit when listening to a conversation or to a test tone. Is the problem source within the T1 circuit or within the analog segments of the VF circuit? By listening to other voice channels, or by analyzing the in-service T1 results, such as BPVs, frame errors, or cyclic redudancy checksum (CRC) errors, technicians can isolate the problem to the T1 circuit or to the analog segments and begin to locate the problem source.
NOTE: For complete descriptions of T-Car-rier technology, impairments, and testing, see TTC’s Technical Note, “T1 Basics”, and T-BERD 224 Appli-cation Guide.
Testing Voice-Grade vs.
Data-Grade VF Circuits
VF circuit analysis is affected not only by the testing location, but also by the type of traffic the analog circuit is carrying – voice or data. Different tests are performed depending upon the channel content. Voice-carrying VF circuits are tested to ensure noise- and echo-free service. Data-carrying VF circuits are tested beyond the minimum requirements of voice-grade ser-vice to ensure that a data signal’s frequencies, particu-larly at the high and low ends of the bandwidth, are transmitted relatively free of distortion. The following tests are grouped according to the type of VF circuit being tested.
Basic Tests for all VF Circuits
Three tests are required to analyze any VF cir-cuit (whether it is a voice- or data-grade circir-cuit) from a T1 access point, regardless of content: audio output, level, and frequency. These three tests are used during VF circuit installation, problem verification, and troubleshooting.
NOTE: The test configuration for each of these tests involves a single test set which non-intrusively monitors one or both T1 transmission paths via a resistor-isolated monitor jack or a high-impedance bridge.
One of the 24 channels is isolated so that a) the received content can be sent to the loudspeaker, b) the level of an incoming tone can be measured relative to a one milliwatt reference signal, and c) the frequency of the tone can be determined. The loudspeaker is used regardless of channel content, whereas level and fre-quency are used primarily when a test tone(s) is applied at some originating point.
Testing VF Cir
Audio Output
Audio output, provided by the T-BERD 224’s loudspeaker, is used primarily to verify VF path continu-ity. A test tone is placed near the circuit’s endpoints so that technicians can verify circuit continuity throughout the network.
The loudspeaker also helps to quickly verify audible faults such as low levels, noise, and echo. The loudspeaker helps determine the transmission direction of the faults because the T-BERD 224 can isolate the loudspeaker source to one transmission direction or the other.
Level
Level, expressed in decibels (dBm), is a mea-sure of signal power gain or loss relative to a one milliwalt reference signal. This reference signal is trans-mitted, often at 1004 Hz, with one milliwatt of power into a 600 ohm termination. The formula for level expressed in dBm is:
dBm = 10 log (PoweroutW/1E - 03W) =
10 log (1E + 03*Powerout)
If the signal level output at a specific circuit location is out of range, the received tone will be either barely audible (level too low), or too loud and some-what distorted (level too high). Expected receive levels fall between -50 dBm and +3 dBm; signals near -50 dBm are very quiet and difficult to hear while signals near +3 dBm are loud and distorted.
NOTE: While analog signals may be transmit-ted at levels up to +10 dBm, the maxi-mum level for a channel within a T1 circuit is +3 dBm due to limits with-in the encodwith-ing technique. For a more complete discussion of level pa-rameters and transmission level points (TLP), refer to the “Signal Level Analysis,” on the next page and “Transmission Level Points,” on page 14, sidebars.
Frequency
Frequency is a measure of a signal’s oscillation rate, typically between 60 Hz and 3900 Hz. The higher the rate, the higher the tone’s pitch. Frequency is a useful measure of oscillator accuracy and is made in conjunction with other tests.
Basic Tests for
Voice-Grade Circuits
In addition to audio, level, and frequency analy-sis, the following tests are often performed to analyze and qualify VF voice-grade circuits: C-Meassage Noise, C-Notched Noise, S/N Ratio, 3-Tone Slope, Return Loss, and DC Offset.
NOTE: The test configuration requirements are different for each test scenario.
Noise
Noise is measured as noise energy, a signal level expressed in dBrn which is reference to -90 dBm (i.e., 0 dBrn = -90 dBm). Noise can be measured with or without a holding tone, typically at 1004 Hz. Noise measure without a holding tone (idle channel noise) measures the background noise on a VF channel. Noise measured with a holding tone measures the amount of noise induced by a signal being transmitted across the channel. Noise is also measured with filters which are designed for specific applications.
C-Message Noise
C-Message Noise is a measurement of noise through a filter that has a frequency response similar to that of the human ear. It is measured with a quiet termination primarily to determine background noise. The filter weighs the noise according to perceived annoyance to the typical listener. Noise measured using “C” filters is given in dBrnC. Results range typically from 10 to 60 dBrnC.
Testing VF Cir
Test Configuration. No test tones or signals are applied, and the circuit is terminated at some origi-nation point. A single test set monitors one or both T1 transmission paths via a resistor-isolated monitor jack or a high-impedance bridge. The quiet channel is iso-lated so that background noise can be measured.
C-Notched Noise
C-Notched Noise is also referred to as noise-with-tone since it is a measurement of noise with a 1004 Hz holding tone. C-Notched Noise provides a mea-sure of the noise encountered by a continuous VF data-grade signal, or the noise a listener would hear during a burst of speech. For voice-grade circuits, the holding tone is typically applied at -16 dBm assuming a 0 dB TLP. The holding tone activates the channel equipment, which may induce accompanying harmonic distortion, quantizing noise, phase jitter, and amplitude jitter which become part of the noise. At the test location, a notched filter eliminates the 1004 Hz test tone before the signal noise is analyzed through a C-Message filter. Just like C-Message Noise, C-Notched Noise is expressed in dBrnC; results range typically from 20 dBrnC to 70 dBrnC.
Test Configuration. This test is performed using either a loopback or point-to-point configuration. To test a single transmission direction, a 1004 Hz test tone is applied at some origination point. A single test set monitors the T1 transmission path downstream from the test tone via a resistor-isolated monitor jack or a high impedance bridge. The channel carrying the tone is isolated so that the test tone can be notched out and the accompanying noise can be measured.
Crosstalk Noise
Crosstalk Noise is a measure of noise, expressed in dBrn, caused by crosstalk coupling between two or more circuits along the same transmission path. Cross-talk Noise is measured by driving one circuit with a holding tone at some originating point, and measuring the parallel circuits’ noise levels at some receiving point. Crosstalk Noise is measured using a 3 kHz Flat Filter.
Test Configuration. Similar to the C-Message Noise test.
Signal Level Analysis
Signal level, in the most general sense of the term, is a measure of a signal’s power received at some point in the circuit. Signal level is most often expressed in dBm, and is a measure of signal power gain or loss relative to a one milliwatt reference signal. Level expressed in dBm is computed using the following formula:
dBm = 10 log (Powerout/1E-03W)
= 10 log (1E + 03*Powerout)
Since level expressed in dBm is measured relative to an
absolute value, it is considered an absolute measurement.
Signal loss or gain, expressed in decibels (dB), is a mea-sure of signal power attenuation or amplification relative to the power of the same signal at another arbitrary point. Signal loss or gain is most commonly measured by subtracting the level of the test signal (in dBm) received at some test location, from the level of the transmitted test signal:
Testing VF Cir
Transmission Level Point (TLP)
TLPs are used as a convenient means of expressing signal loss or gain within a circuit. The TLP is a point in the circuit expressed as the ratio (in dB) of the power of the signal at that point to the power of the signal at a reference point, called the 0 TLP. TLP, then, is the measurement of the signal gain or loss rela tive to the 0 TLP. The diagram below shows how the TLPs relate to signal gain and loss in a circuit.
In the above circuit, the signal level at point B should be 7 dB greater than the signal level at point A, the 0 TLP. The signal level at point C should be 15 dB lower than the signal level at point A.
How do readings taken in dBm0 relate to readings taken in dBm? Signal levels expressed in dBm0 define the signal level rela-tive to the 0 TLP. For example, if the actual level of the signal at point B in the above circuit measured +10 dBm, its value expressed in dBm0 would be +3 dBm0. In other words:
dBm0 = Signal Power (dBm) - TLP (dB)
Therefore, the signal level in dBm0 should be the same points A, B, and C in the above drawing. Drastic differences in dBm0 readings may indicate a problem between particular sec-tions of the circuit.
NOTE: The same formula applies for referencing noise to the 0 TLP (dBrnC0, dBrn0). Also the T-Carrier based VF circuits are always a 0 dB TLP by definition.
S/N Ratio
S/N Ratio is a ratio, expressed in decibels (dB), of the holding tone’s level to the measured noise-with-tone:
S/N (dB) = Level (dBm)/C-Notched noise (dBrnC) S/N Ratio provides a quick analysis of circuit quality. Typically, higher ratios indicate lower noise and therefore better quality. Lower ratios can indicate poor quality due to excessive noise or poor level. Results range generally from 10 dB to 45 dB.
Test Configuration. Similar to the C-Notched Noise test.
3-Tone Slope
3-Tone Slope analysis is used to estimate attenu-ation distortion on a VF circuit. It is a comparison of received loss measured at both 404 Hz and 2804 Hz, to the received loss at 1004 Hz:
A. Level (@1004 Hz) dBm - Level (@404 Hz) dBm = dB
B. Level (@1004 Hz) dBm - Level (@2804 Hz) dBm = dB
Tones are typically transmitted at -16 dBm as-suming a 0 dB TLP. For dedicated VF circuits, the differ-ences between the level at 1004 Hz and the other two tones are between -2 dB (gain) and +10 dB (loss). For
PSTN circuits, the differences should be ≤+14 dB.
Test Configuration. Similar to the Level test.
Return Loss
Return loss is a ratio, expressed in dB, of a signal’s transmitted power to the power reflected back to the originating end (i.e., echo) due to an impedance mismatch in a mixed 2-wire/4-wire circuit. Return loss is defined as:
Testing VF Cir
R.L. (dB) = Power transmitted (dBm) -Reflected Power Received (dBm)
As the return loss increases, the power of the returned signal decreases (assuming that the transmitted power remains relatively constant), thereby causing less of an echo. If return loss is small, the reflected power is sizable, and the talker or listener, or both, will think they are talking through a tunnel due to the echoes. If return loss is low for data signals, the occurring echoes may distort the signal and therefore induce data errors. Three return loss measurements, which differ in frequency spectral content and measurement filters, can be made to determine which section of the fre-quency spectrum is the cause of the echo. Return loss mea-surements require a quiet termination at the distant end so that the reflection of transmitted signal may be measured.
Echo Return Loss
Echo Return Loss is a measurement of return loss in the mid-range frequencies. Results range between 0 dB and 50 dB.
Singing Return Loss Low
and High (SRL-LO, SRL-HI)
SRL-LO and SRL-HI are measurements of return loss in the low (200 Hz to 500 Hz) or high (2500 Hz to 3200 Hz) frequency ranges. Results range between 0 dB and 50 dB.
Test Configuration. For all return loss mea-surements, a single test set is used to transmit and receive test tones. A quiet termination is provided at some “far” location, typically on the other side of 2-wire/ 4-wire hybrid, so that the reflected transmitted power may be measured.
DC Offset
DC Offset is a measure, expressed in mV, of positive or negative DC components within the analog signal. It is useful for detecting faulty codec operation. Good codecs should provide a result of 0 mV. The T-BERD 224’s DC Offset result ranges from +127 mV to -127 mV.
Test Configuration. Similar to the Level test.
Basic Tests for
Data-Grade Circuits
In addition to level, frequency, and the other voice-grade tests just described, the following tests are performed to analyze and qualify VF data-grade cir-cuits: 3 kHz Flat Noise, P/AR, and Frequency Sweep vs. Level. The 3kHz Notched Noise test, while not a stan-dard test, is gaining popularity for testing data circuits and is included for that purpose. Other specialized tests such as EDD, IMD, and Transients are beyond the
scope of this Application Note.
Noise
Noise can be very disruptive to data transmis-sions which are much more sensitive to line impair-ments. Since the C-Message Noise filters are designed to analyze the noise most apparent to the human ear, C-Message and C-Notched Noise are not the best mea-surements to make for VF data-grade circuits. Instead, filters which are more relevant to data transmissions should be used:
3 kHz Flat Noise
3 kHz Flat Noise, expressed in dBrn, is mea-sured through a 3 kHz Flat Filter and investigates the presence of idle channel noise such as crosstalk, white noise, and impulse noise. A quiet termination at the circuit’s originating end is required. Results range from 20 dBrn to 70 dBrn.
Test Configuration. Similar to the C-Message Noise test.
3 kHz Notched Noise
3 kHz Notched Noise, expressed in dBrn, is a measurement of noise with a 1004 Hz holding tone (typically at -16 dBm assuming a 0 dB TLP) applied at the circuit’s originating point. The 3 kHz Notched Noise test provides a measure of the noise encountered by a
Testing VF Cir
continuous data signal because the holding tone activates the channel equipment which can create noise. Results range from 20 dBrn to 70 dBrn.
Test Configuration. Similar to the C-Notched Noise test.
Peak-to-Average Ratio (P/AR)
P/AR, expressed in units, is measured by com-paring a received P/AR signal to a known P/AR wave-form. The P/AR signal is a complex waveform whose spectral content consists of 16 non-harmonically related tones, with known envelope shape, which approximates a data signal. P/AR analysis measures signal dispersion or spreading due to transmission imperfections such as EDD, noise, and bandwidth reduction, and nonlinearities such as clipping and compression. While P/AR cannot isolate the impairment type or cause, it is a non-tariffed figure of merit used to quickly appraise a circuit’s data transmission quality. Typically, higher level tests such as EDD and IMD are not performed unless the P/AR result is out of a provider-acceptable range within the entire P/AR range of 0 to 120. A perfect channel would provide a reading of 100 units.
Test Configuration. This test is typically per-formed using two test sets in a point-to-point configura-tion. Both transmission directions may be tested simulta-neously by having each test set transmit the P/AR spectrum toward the opposite test set. Each test set then isolates the channel carrying the test tones so that the P/AR can be measured.
Frequency Sweep vs. Level
Frequency Sweep vs. Level is a detailed analysis of attenuation distortion; amplitude changes are analyzed over a frequency range at specific intervals. Frequency sweep analysis provides more detail of attenuation distortion than 3-Tone Slope analysis because the entire frequency bandwidth can be analyzed at multiple intervals instead of only at three distinct frequencies. This detailed analysis is important for VF circuits trans-mitting data since data requires consistent quality over
the entire frequency range. Even so, the frequncy range of 2504 to 2750 Hz should not be tested to avoid inad-vertent loopbacks or billings caused by 2713 Hz and 2600 Hz tones respectively.
Test Configuration. Similar to the Level test.
Application 1:
Testing Voice-Grade
VF Circuits from a
T1 Access Point
The following application demonstrates how
the T-BERD 224 can be used to evaluate the overall
performance of a voice-grade VF circuit from a T1 access point. This application is most often used on T1 channels carrying voice traffic within interoffice
trunks, PBX trunks, and DLC circuits (e.g., SLC-96
and SLC Series 5). It is useful:
• When installing voice-grade VF services through T1 circuits and verifying point-to-point continuity.
• When locating VF faults such as noise, echo, or excessive loss from a CO that provides T1 circuit access only.
• When testing VF circuits at a T1 access point via level, frequency, noise, and return loss tests. By placing the T-BERD 224 in-line so that the T1 circuit passes through the unit, users can overwrite any channel’s contents with test tones to perform straightaway or loopback tests, without disrupting the remaining 23 channels.
NOTE: When the T-BERD 224 is inserting test tones in one direction, it transmits an idle code into the selected channel in the opposite direction to prevent loop and test tones from being transmitted throughout the rest of the circuit.
Testing VF Cir
While performing an out-of-service test on a specific channel, the T-BERD 224 is analyzing both T1 inputs for BPVs, frame errors, and signal impairments.
Consequently, this is both an in-service T1 test as well as
an out-of-service VF test. By comparing the T1
re-sults with the channel rere-sults, technicians can determine if the problem source is in the analog or T1 portion of the transmission circuit.
There are two methods of performing VF circuit analysis: end-to-end testing and loopback testing. The T-BERD 224 configuration is similar for both types of testing. The two major differences which are addressed in the following sections are:
• The equipment needed. • The establishment of a loopback.
End-to-End Testing
End-to-end testing is performed with two test sets such that analysis is performed in both directions
simultaneously, as shown in Figure 13. Since testing
is performed from a T1 access point, at least one of the
two test sets will be a T-BERD 224. The other test set will very often be an analog VF test set capable of transmitting and receiving various tones and waveforms from an analog access point.
End-to-end testing is often performed on voice-grade circuits because VF loopbacks many times cannot be remotely established via loop codes or tones. Further, since end-to-end analysis enables technicians
to find the error source direction, as well as location,
it is better than loopback testing.
Loopback Testing
Loopback testing is performed with one
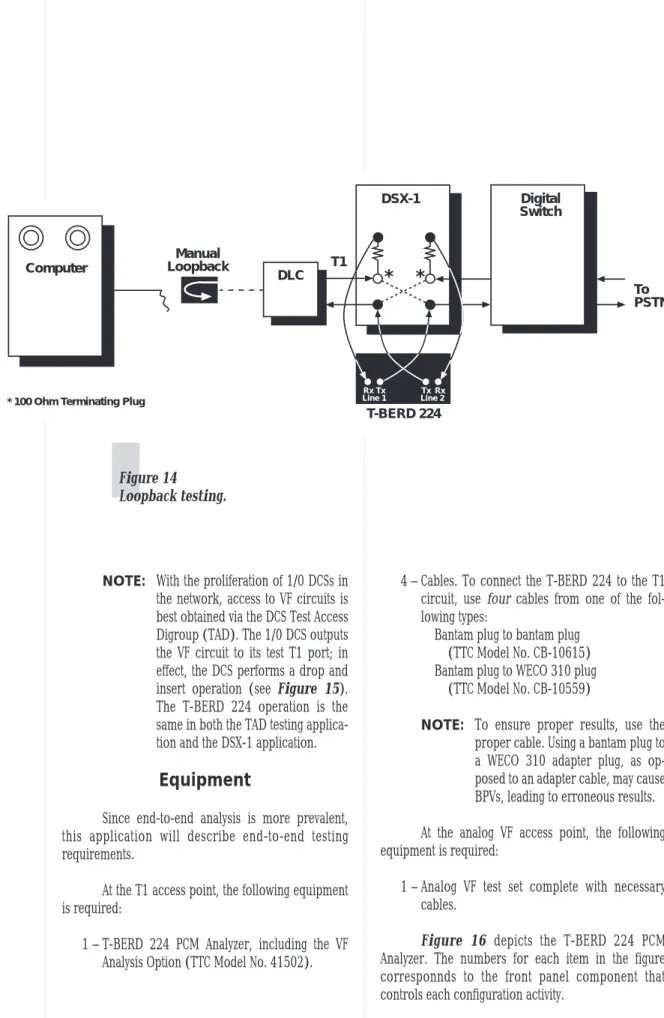
T-BERD 224 as shown in Figure 14 on the next page.
A far-end, hard loop is provided so that the transmitted test tones can return to the T-BERD 224 for analysis.
NOTE: Both transmission directions are tested, but results will indicate
general error source location, not
direction.
Channel
Bank DSX-1 SwitchDigital
T1 VF Test Set Rx T-BERD 224 Tx Line 1 Tx RxLine 2 To PSTN
* 100 Ohm Terminating Plug
*
*
Figure 13
Testing VF Cir
Computer DSX-1 Digital Switch T1 Rx T-BERD 224 Tx Line 1 Line 2Tx Rx To PSTN* 100 Ohm Terminating Plug
*
*
DLC Manual Loopback Figure 14 Loopback testing.NOTE: With the proliferation of 1/0 DCSs in the network, access to VF circuits is best obtained via the DCS Test Access Digroup (TAD). The 1/0 DCS outputs the VF circuit to its test T1 port; in effect, the DCS performs a drop and
insert operation (see Figure 15).
The T-BERD 224 operation is the same in both the TAD testing applica-tion and the DSX-1 applicaapplica-tion.
Equipment
Since end-to-end analysis is more prevalent, this application will describe end-to-end testing requirements.
At the T1 access point, the following equipment is required:
1 – T-BERD 224 PCM Analyzer, including the VF Analysis Option (TTC Model No. 41502).
4 – Cables. To connect the T-BERD 224 to the T1
circuit, use four cables from one of the
fol-lowing types:
Bantam plug to bantam plug (TTC Model No. CB-10615) Bantam plug to WECO 310 plug
(TTC Model No. CB-10559)
NOTE: To ensure proper results, use the proper cable. Using a bantam plug to a WECO 310 adapter plug, as op-posed to an adapter cable, may cause BPVs, leading to erroneous results. At the analog VF access point, the following equipment is required:
1 – Analog VF test set complete with necessary cables.
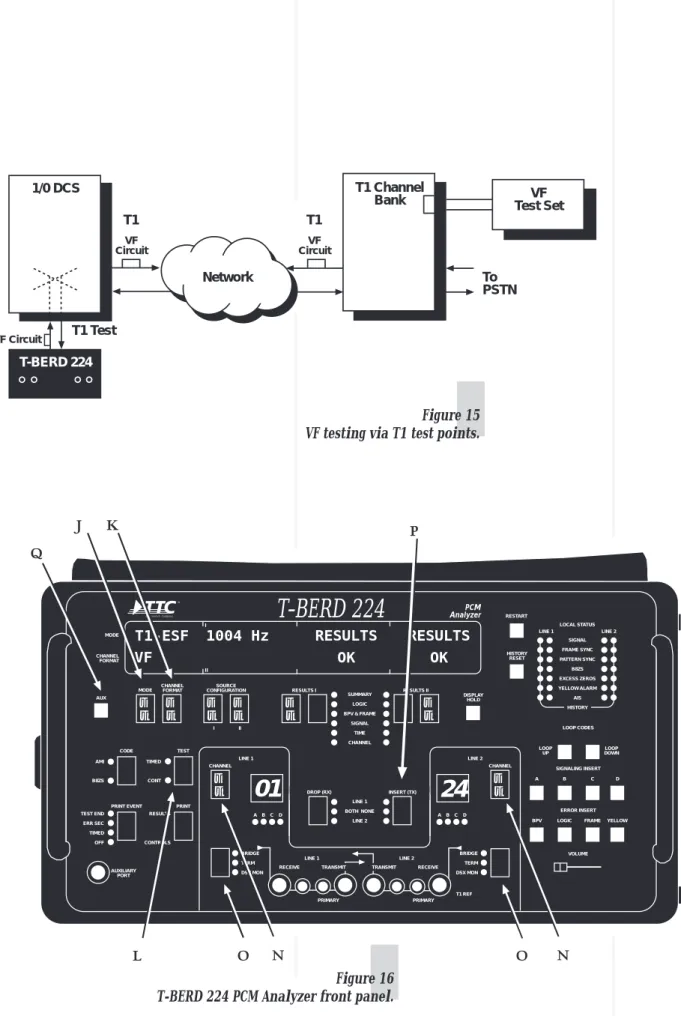
Figure 16 depicts the T-BERD 224 PCM Analyzer. The numbers for each item in the figure corresponnds to the front panel component that controls each configuration activity.
Testing VF Cir
T-BERD 224
PCM Analyzer CHANNEL FORMAT MODE T1-ESF VF RESULTS 1004 Hz➈
OK RESULTS OK ▼ ▲ ▼ ▲ MODE CHANNELFORMAT▼ ▲ ▼ ▲ SOURCE CONFIGURATION I II ▼ ▲ RESULTS I ▼ ▲ RESULTS II ▼ ▲ CHANNEL CODE TEST
PRINT EVENT PRINT
CHANNEL
SIGNALING INSERT A B C D
LOOP CODES
ERROR INSERT BPV LOGIC FRAMEYELLOW
VOLUME HISTORY RESET RESTART DISPLAY HOLD AUX SIGNAL FRAME SYNC PATTERN SYNC B8ZS EXCESS ZEROS YELLOW ALARM AIS HISTORY LINE 1 LINE 2 LOCAL STATUS LOOP UP LOOP DOWN SUMMARY LOGIC BPV & FRAME SIGNAL TIME CHANNEL BRIDGE TERM DSX MON BRIDGE TERM DSX MON LINE 1 LINE 2 TEST END ERR SEC TIMED OFF RESULTS CONTROLS AUXILIARY PORT AMI B8ZS TIMED CONT AB CD A BC D
01
24
LINE 1 LINE 2 T1 REF RECEIVE TRANSMIT RECEIVEINSERT (TX) DROP (RX) LINE 1 BOTH NONE LINE 2 ▼ ▲
➁ ➂
➃
➇
➆ ➅
PRIMARY TRANSMIT PRIMARY➆
➅
T1 ChannelBank Test SetVF
1/0 DCS T1 T-BERD 224 To PSTN T1 VF Circuit VF Circuit VF Circuit T1 Test Network Figure 15 VF testing via T1 test points.
Figure 16 T-BERD 224 PCM Analyzer front panel.
Testing VF Cir
Configuring and Cabling
the T-BERD 224
The following steps configure the T-BERD 224 for basic operation.
1. Press the T-BERD 224’s side panel power
switch to the ON position.
2. Press the MODE switch to select the desired T1
framing format (e.g., T1-D4). If the mode is unknown, select AUTO and let the T-BERD 224 determine the mode automatically once it is connected to the T1 circuit.
3. Press the CHANNEL FORMAT switch to display
VF for Voice Frequency.
4. Set the TEST switch to CONT.
5. Adjust the VOLUME slide switch to mid-range.
6. Press the CHANNEL switches for LINE 1 and LINE
2 to select the proper channel numbers carrying the voice traffic in question.
7. Press the RECEIVE INPUT switches for both
LINE 1 and LINE 2 to illuminate the LED next to the DSX MON label.
NOTE: The DSX MON input termination is for resistor-isolated jacks only. If the T-BERD 224 is bridged to the cir-cuit using alligator clips or con-nected via non-isolated monitor jacks, select BRIDGE.
8. Set the INSERT (TX) switch to NONE, and DROP
(RX) switch to both.
9. Press the AUX switch to enable the auxiliary
functions and use the MODE switch to display AUX 05. Verify that the LBO is set to 0 dB for both LINE 1 and LINE 2. If not, use the SOURCE CONFIGURATION II and RESULTS I category switches to set each LBO to 0 dB.
10. Connect the T-BERD 224 LINE 1 RECEIVE
input connector to the appropriate MON jack
on the patch bay as shown in Figure 17, Nos.
1 and 2.
NOTE: Figure 17 provides a step-by-step numbering scheme for connecting the T-BERD 224 to a T1 circuit for performing drop and insert testing.
WARNING: Do not connect the TRANS-MIT output jack to the line until Steps 1 through 12 are performed to avoid taking the line down.
11. Verify that the green SIGNAL and FRAME SYNC
LEDs are illuminated for the T1 input, and that the B8ZS LED indicator is illuminated if the circuit is using clear channel (B8ZS) line coding. If the SIGNAL LED is illuminated yet the FRAME SYNC LED is not, check the MODE display to verify proper selection of line format (e.g., T1-D4, T1-ESF, T1-SLC).
12. Press the CODE switch to select the line coding.
To select the proper code, observe the STATUS and ALARM LEDs for LINE 1. If the B8ZS LED is illuminated, select B8ZS; otherwise, select AMI.
13. Assuming that the T-BERD 224 has frame sync
as indicated by the FRAME SYNC LED, connect
a T1 cable first to the T-BERD 224’s LINE 1
TRANSMIT output jack, and then to the patch
bay jack as shown in Figure 17, Nos. 3 and 4.
WARNING: Connecting the cable into the patch bay jack before con-necting the other end into the T-BERD 224 will take down the T1 circuit.
14. Repeat Steps 10 through 13 for LINE 2.
15. Insert 100 ohm terminating plugs into the
patch bay jacks as shown in Figure 17, Nos.
Testing VF Cir
Rx T-BERD 224 Tx Line 1 Tx RxLine 2 DSX-1 Facility*
DSX-1 Equipment*
➀ ➁ ➆ ➇ ➈ ➂ ➃ ➄ ➅ ➉ * 100 Ohm Terminating Plug Figure 17Connecting the T-BERD 224 to a patch bay jack.
Results
A. Retrieving In-Service
Results of the T1 Circuit
While out-of-service analysis is performed on one of the 24 T1 channels, in-service analysis of the entire T1 circuit is performed simultaneously.
NOTE: All results, including the T1 results, are reset to 0 each time the TEST RESTART switch or a major switch such as SOURCE CONFIGURATION I or II, is pressed.
1a. Press the RESULTS I category switch to
illumi-nate the LED next to SUMMARY.
2a. If “RESULTS OK” is not shown in the RESULTS
I display, press the RESULTS I arrow switch to scroll through the key, non-zero results regard-ing the T1 circuit’s in-service performance.
B. Measuring Level, Frequency,
C-Notch Noise and S/N Ratio
The following procedure assumes that Steps 1 through 15 have been performed and that a 1004 Hz, -16 dBm test tone is being transmitted toward the T-BERD 224 from the far-end VF test set as shown in
Figure 13 on page 17.
NOTE: The following sequence of transmit-ting and measuring specific tones
and results must be performed at
the far-end test set simultaneously for proper circuit analysis.
1b. Press the SOURCE CONFIGURATION I switch to
display LEVEL. The SOURCE CONFIGURATION I display will then change to “LEV@xxxxHz” which indicates the frequency output where xxxx is the current frequency setting.
2b. Press the SOURCE CONFIGURATION II switch to
select the transmit level (typically -16 dBm).
3b. Press the SOURCE CONFIGURATION I switch to
display 3-TONE SLP.
4b. Press the SOURCE CONFIGURATION II switch to
display 1004 Hz. The T-BERD 224 is now config-ured to transmit a 1004 Hz tone at -16 dBm in the selected channel.
5b. To insert the 1004 Hz test tone into the channel
(selected in Step 6) toward the far-end test set, press the INSERT (TX) switch to either LINE 1 or LINE 2, depending on the far-end test set’s
location. For the example shown in Figure 13
on page 17, the INSERT selection should be set to
LINE 2 to transmit the VF test tone from the T-BERD 224 to the far-end test set.
Testing VF Cir
NOTE: An idle code of All Ones will be trans-mitted into the channel selected for
LINE 1 to prevent loop and test tones
from being transmitted throughout the rest of the circuit.
6b. Press the DROP (RX) switch to select the line
opposite of the INSERT selection. For the
ex-ample shown in Figure 13 on page 17, the
DROP selection should be set to LINE 1.
7b. Verify continuity by listening to the 1004 Hz test
tone using the internal loudspeaker’s VOLUME slide switch.
8b. Press the RESULTS I category switch to illuminate
the LED next to CHANNEL.
9b. Press the RESULTS I arrow switch to display the VF
frequency (N81 VF FREQ), where N equals the line number selected by the DROP (RX) switch (LINE 1). Verify the reception of a 1004 Hz tone from the far-end test set.
10b. Press the RESULTS II category switch to
illumi-nate the LED next to CHANNEL.
11b. Press the RESULTS II arrow switch to display the
VF level (N82 VF LVL) of the tone received by the T-BERD 224. Record the result.
12b. Using either the RESULTS I or the RESULTS II
arrow switch, display and record C-Notched Noise (N87 C-NOTCH), and Signal-to-Noise Ratio (N88 S/N) where N equals the line num-ber selected by the DROP (RX) switch.
C. Measuring 3-Tone Slope
The following procedure assumes that Steps 1 through 15 and 1b through 8b have been performed, and that a far-end test set capable of sending 404 Hz, 1004 Hz, and 2804 Hz tones is positioned as shown in
Figure 13 on page 17.The LEVEL result from Steps 1b through 8b will be used in conjunction with the follow-ing procedure to estimate the circuit’s frequency re-sponse or attenuation distortion.
NOTE: The following sequence of transmit-ting and measuring specific tones and
results must be performed at the
far-end test set simultaneously for pro-per circuit analysis. Or, pro-perform a far-end loopback of the far-far-end circuit
(see Section F).
1c. Press the SOURCE CONFIGURATION I switch to
display LEVEL (LEV@404 Hz).
2c. Press the SOURCE CONFIGURATION II switch to
select the transmit level (typically -16 dBm).
3c. Press the SOURCE CONFIGURATION I switch to
display 3-TONE SLP.
4c. Press the SOURCE CONFIGURATION II switch to
display 404 Hz.
5c. Press the RESULTS I category switch to illuminate
the LED next to CHANNEL.
6c. Press the RESULTS I arrow switch to display the
VF frequency (N81 VF FREQ), where N equals the line number selected by the DROP (RX) switch. Verify the reception of a 404 Hz tone from the far-end test set.
7c. Press the RESULTS II category switch to
illumi-nate the LED next to CHANNEL.
8c. Press the RESULTS II result switch to display
the VF level (N82 VF LVL), where N equals the line number selected by the DROP (RX) switch. Record the result and compare it with the mea-sured level of the 1004 Hz tone.
9c. Press the SOURCE CONFIGURATION II switch
to display 2804 Hz.
10c. Verify the reception of a 2804 Hz tone from
the far-end test set by observing the RESULTS I display (N81 VF FREQ).
Testing VF Cir
11c. Record the result (N82 VF LVL) now displayed
in the RESULTS II window and compare it with the measured level of the 1004 Hz tone.
D. Measuring C-Message Noise
The following procedure assumes that Steps 1 through 15 have been performed and that a quiet termi-nation (i.e., a 400, 600, or 1200 ohm terminating resistance) is being provided by the far-end test set as
shown in Figure 13 on page 17.
NOTE: The following sequence of transmit-ting and measuring specific tones and
results must be performed at the
far-end test set simultaneously for proper circuit analysis.
1d. Press the SOURCE CONFIGURATION I switch to
display QUIET.
2d. To insert the quiet termination into the channel
(selected in Step 6) toward the far-end test set, press the INSERT (TX) switch to either LINE 1 or LINE 2, depending on the far-end test set’s
loca-tion. For the example shown in Figure 13 on
page 17,the INSERT selection should be set to
LINE 2 to transmit the VF test tone from the T-BERD 224 to the far-end test set.
NOTE: An idle code of All Ones will be trans-mitted into the channel selected for
LINE 1 to prevent loop and test tones
from being transmitted throughout the rest of the circuit.
3d. Press the DROP (RX) switch to select the line
opposite of the INSERT selection. For the
ex-ample shown in Figure 13 on page 17, the
DROP selection should be set to LINE 1.
4d. Press the RESULTS I category switch to illuminate
the LED next to CHANNEL.
5d. Press the RESULTS I arrow switch to display the
VF frequency (N81 VF FREQ), where N equals the line number selected by the DROP (RX)
switch. Verify the reception of a 0 Hz tone (Quiet) from the far-end test set.
6d. Press the RESULTS II category switch to
illumi-nate the LED next to CHANNEL.
7d. Press the RESULTS II arrow switch to display the
C-Message Noise (N86 C-MSG), where N equals the line number selected by the DROP (RX) switch. Record the result.
E. Measuring Return Loss
The following procedure assumes that Steps 1 through 15 have been performed and that a quiet termi-nation is being provided by the far-end test set as
shown in Figure 13 on page 17.
NOTE: The following sequence of transmit-ting and measuring specific tones
and results must be performed at
the far-end test set simultaneously for proper circuit analysis. Perform-ing this test with anythPerform-ing other than a quiet termination at the far-end (such as a loopback) will provide errone-ous results.
1e. Press the SOURCE CONFIGURATION I switch to
display ERL.
NOTE: When this or any return loss function (e.g., ERL, SRL-HI, SRL-LO) is se-lected, the following message is dis-played: “SET BURST FREQ IN AUX 22”. Pressing the AUX switch changes the display immediately to the AUX 22 VF BURST display; the BURST fre-quency and level for echo canceller suppression can be easily selected. If the BURST is set to ON, the selected burst frequency is transmitted auto-matically before any return loss mea-surements are made so that echo cancellers are disabled during the test. Pressing the AUX switch one more time returns the display to normal operation.
Testing VF Cir
2e. To insert the return loss test tones into the
chan-nel (selected in Step 6) toward the far-end test set, press the INSERT (TX) switch to either LINE 1 or LINE 2, depending on the far-end test set’s
location. For the example shown in Figure 13
on page 17,the INSERT selection should be set
to LINE 2 to transmit the VF test tone from the T-BERD 224 to the far-end test set.
NOTE: An idle code of All Ones will be trans-mitted into the channel selected for
LINE 1 to prevent loop and test tones
from being transmitted throughout the rest of the circuit.
3e. Press the DROP (RX) switch to select the line
opposite of the INSERT selection. For the
ex-ample shown in Figure 13 on page 17, the
DROP selection should be set to LINE 1.
4e. Press the RESULTS I category switch to
illumi-nate the LED next to CHANNEL.
5e. The channel’s Echo Return Loss (N92 ERL),
where N equals the line number selected by the DROP (RX) switch, is displayed. Record the result.
6e. Press the SOURCE CONFIGURATION I switch
to display SRL-HI.
7e. The channels’s SRL-HI (N93 SRL-HI), where N
equals the line number selected by the DROP (RX) switch, is displayed. Record the result.
8e. Press the SOURCE CONFIGURATION I switch to
display SRL-LO.
9e. The channel’s SRL-LO (N94 SRL-LO), where N
equals the line number selected by the DROP (RX) switch, is displayed. Record the result.
Fault Isolation
When interpreting the results, it is important to first analyze the in-service T1 circuit results. Problems apparent within the T1 channels may be caused by BPVs, CRC errors, or timing slips on the T1 circuit. Before troubleshooting any VF circuit problem, find and repair any T1 circuit problems first.
To localize problems, break the T1 circuit into manageable sections one step at a time as shown in
Figure 18. In Stage 1, verify that errors are occurring somewhere in the circuit. In Stage 2, test a section of the circuit and “circle-in” on the source (or sources)
of errors. If errors still occur at Stage 2, at least one of
the error sources is between your location and the far-end. To make sure no sources of errors have been missed, test the circuit section between Stage 1 and Stage 2. In this manner, you can quickly and methodi-cally isolate faults within the circuit. Before determining that the circuit is good, test it one more time end-to-end for verification.
Results Interpretation
Once results are known, it is possible to isolate the cause of disrupted and degraded service. Since every T1/VF circuit is different, it is nearly impossible
to list all the causes. Table 1 shows various result
combinations and possible problem causes.
Application 2:
Testing Data-Grade
VF Circuits from a
T1 Access Point
The following application demonstrates how the
T-BERD 224 can be used to evaluate the overall
perfor-mance of a data-grade VF circuit from a T1 access
point. This application is most often used on T1
chan-nels carrying data traffic within interoffice trunks, DLC circuits (e.g., SLC-96 and SLC Series 5), and dedicated trunks between channel banks. It is useful:
Testing VF Cir
Table 1
Correlation of results and problem causes.
Figure 18
Sectionalizing problem sources.
DSX-1 Channel Bank Rx T-BERD 224 Tx Line 1 Tx RxLine 2 Test 2
* 100 Ohm Terminating Plug
* * DLC Loopback or Test 1 VF Test Set Stage 1 DSX-1 Rx T-BERD 224 Tx Line 1 Line 2Tx Rx * * Stage 2 Loopback or VF Test Set Test 3 Error Source T1 Network
Bipolar Violations BPVs Local T1 problem. Possibly faulty T1 repeater, span line noise, crosstalk, poor Audible Noise FRM ERR line cabling, bad cabling between test and circuit, corroded “dirty” cable plugs.
CRC ERR
Frame Errors FRM ERR Typically a far-end T1 span problem. Sectionalize further. Check cross-connect CRC Errors CRC ERR switches, multiplexers, and repeaters, as well as the cabling between these devices. Timing Slips TIM SLP T1 timing problem. Check channel bank and multiplexer timing settings. Verify Voice Dropouts one master, remainder slaves.
T1 Results OK SUMMARY RESULTS OK VF circuit problem. Check level and LBO settings on modems, line repeaters, VF Level Low VF LVL out-of-spec channel bank plug-ins, and multiplexer cards. Check VF local loop for shorts,
opens, grounds, etc.
T1 Results OK SUMMARY RESULTS OK 2-wire/4-wire hybrid converter impedance mismatch. Check impedance settings. Audible Echoes ERL, SRL-HI, or SRL-LO
Return Loss Low out-of-spec
T1 Results OK SUMMARY RESULTS OK VF circuits problem – attenuation distortion. Check VF line repeaters, and line Audible Distortion Slope out-of-spec cards containing digital/analog converters. May require reconditioning analog Sloped Tone Distortion local loop (remove load coils, etc.).
T1 Results OK SUMMARY RESULTS OK VF circuit problem. Crosstalk from adjacent cable pairs, 60 Hz induction from Idle Channel Noise C-Message Noise out-of-spec power lines, possible VF local loop problems (one side open, unbalanced line). T1 Results OK SUMMARY RESULTS OK VF circuit problem. Bad line card in the channel bank, multiplexer, or SLC Noise with Tone out-of-spec C-Notch and S/N out-of-spec terminal, bad VF repeater, 1004 Hz tone out-of-range.
Result Displayed by the T-BERD 224
Testing VF Cir
• When installing data-grade VF services through T1 circuits.
• When locating the source of data-grade im-pairments from a CO that provides T1 circuit access only.
• When testing data-grade VF circuits at a T1 ac-cess point via 3 kHz Flat Noise, 3 kHz Notched Noise, P/AR, and Frequency Sweep vs. Level tests.
NOTE: It is highly recommended that the tests described for voice-grade circuits, such as level, frequency, and return loss, be performed as well to fully analyze the VF circuit.
By placing the T-BERD 224 in-line with the T1 circuit so that the T1 circuit passes through the unit, users can overwrite any channel’s contents with test tones to perform straightaway or loopback tests without disrupting the remaining 23 channels.
NOTE: When the T-BERD 224 is inserting test tones in one direction, it transmits an idle code into the selected channel in the opposite direction to prevent loop and test tones from being transmitted throughout the rest of the circuit. While performing an out-of-service test on a specific channel, the T-BERD 224 is analyzing both T1 inputs for BPVs, frame errors, and signal impairments.
Consequently, this application covers both in-service
T1 testing as well as out-of-service VF testing. By compar-ing the T1 results with the channel results, technicians can determine if the problem source is in the analog or T1 portion of the transmission circuit.
There are two methods of performing VF circuit analysis: end-to-end testing and loopback testing. The T-BERD 224 configuration is similar for both types of testing. The two major differences addressed in the fol-lowing sections are:
• The equipment needed. • The establishment of a loopback.
End-to-End Testing
End-to-end testing is performed with two test sets such that analysis is performed in both directions
simultaneously, as shown in Figure 19. Since testing
with the T-BERD 224 is performed from a T1 access point, the other test set will be either another channel access set or a standard analog VF test set capable to transmitting and receiving various tones and waveforms. Even though end-to-end analysis requires coor-dinating two test sets, it provides more thorough testing
because the error sources direction, as well as location,
can be found more quickly.
Loopback Testing
Loopback testing is performed with one
T-BERD 224 as shown in Figure 20. For data-grade
VF circuits equipped with an 829 termination, a far-end loopback is established by sfar-ending a 2713 Hz tone toward the 829 termination for a specified time limit, which activates the loopback. The T-BERD 224’s trans-mitted test tones can then be received from the return path for analysis.
NOTE: Both transmission directions are tested, but results will indicate gen-eral error source location, but not direction. Since loopback testing is performed by one technician with only one test set, it is useful when quick fault isolation is desired. A de-scription of how to establish an 829 termination loopback using the
T-BERD 224 is described in Section
Testing VF Cir
Computer DSX-1 Channel Bank Rx T-BERD 224 Tx Line 1 Tx Rx Line 2* 100 Ohm Terminating Plug
* * VF Test Set DSX-1 Modem Channel Bank Modem T1 Network Figure 19 End-to-end testing. Computer DSX-1 Channel Bank Rx T-BERD 224 Tx Line 1 Tx Rx Line 2
* 100 Ohm Terminating Plug
* * 829 DSX-1 Modem Channel Bank Modem * * Loopback T1 Network Figure 20 Loopback testing.
Equipment
Since some data-grade circuit tests should not
be performed using loopbacks, this application will describe end-to-end testing requirements.
At the T1 access point, the following equipment is required:
1 – T-BERD 224 PCM Analyzer, including the VF Analysis Option (TTC Model No. 41502).
4 – Cables. To connect the T-BERD 224 to the
T1 circuit, use four cables from one of the
following types:
Bantam plug to bantam plug (TTC Model No. CB-10615) Bantam plug to WECO 310 plug
(TTC Model No. CB-10559)
NOTE: To ensure proper results, use the proper cable. Using a bantam plug to a WECO 310 adapter plug, as op-posed to an adapter cable, may cause BPVs, leading to erroneous results.
Testing VF Cir
At the remote, analog test location, the fol-lowing equipment is required:
1 – Analog test set capable of transmitting and receiv-ing the spectrum of frequency and P/AR tones. 1 – Set of necessary cables.
Configuring and Cabling
the T-BERD 224
The following steps configure the T-BERD 224 for basic operation.
1. Press the T-BERD 224’s side panel power switch
to the ON position.
2. Press the MODE switch to select the desired
T1 framing format (e.g., T1-D4). If the mode is unknown, select AUTO and let the T-BERD 224 determine the mode automatically once it is connected to the T1 circuit.
3. Press the CHANNEL FORMAT switch to display
VF for Voice Frequency.
4. Set the TEST switch to CONT.
5. Adjust the VOLUME slide switch to mid-range.
6. Press the CHANNEL switches for LINE 1 and
LINE 2 to select the proper channel numbers carrying the voice traffic in question.
7. Press the RECEIVE INPUT switches for both
LINE 1 and LINE 2 to illuminate the LED next to the DSX MON label.
NOTE: The DSX MON input termination is for resistor-isolated jacks only. If the T-BERD 224 is bridged to the circuit using alligator clips or connected via non-isolated monitor jacks, select BRIDGE.
8. Set the INSERT (TX) switch to NONE and drop
to both.
9. Press the AUX switch to enable the auxiliary
functions and use the MODE switch to display AUX 05. Verify that the LBO is set to 0 dB for both LINE 1 and LINE 2. If not, use the SOURCE CONFIGURATION II and RESULTS I category switches to set each LBO to 0 dB.
10. Connect the T-BERD 224 LINE 1 RECEIVE
input connector to the appropriate MON jack
on the patch bay as shown in Figure 21, Nos.
1 and 2.
NOTE: Figure 21 provides a step-by-step numbering scheme for connecting the T-BERD 224 to a T1 circuit for performing drop and insert testing.
Figure 21
Connecting the T-BERD 224 to a patch bay jack.
Rx T-BERD 224 Tx Line 1 Tx RxLine 2 DSX-1 Facility
*
DSX-1 Equipment*
➀ ➁ ➆ ➇ ➈ ➂ ➃ ➄ ➅ ➉ * 100 Ohm Terminating PlugTesting VF Cir
WARNING: Do not connect the TRANSMIToutput jack to the line until Steps 1 through 12 are per-formed to avoid taking the line down.
11. Verify that the green SIGNAL and FRAME SYNC
LEDs are illuminated for the T1 input, and that the B8ZS LED indicator is illuminated if the cir-cuit is using clear channel (B8ZS) line coding. If the SIGNAL LED is illuminated yet the FRAME SYNC LED is not, check the MODE display to verify proper selection of line format (e.g., T1-D4, T1-ESF, T1-SLC).
12. Press the CODE switch to select the line coding.
To select the proper code, observe the STATUS and ALARM LEDs for LINE 1. If the B8ZS LED is illuminated, select B8ZS; otherwise, select AMI.
13. Assuming that the T-BERD 224 has frame sync
as indicated by the FRAME SYNC LED, connect a
T1 cable first to the T-BERD 224’s LINE 1
TRANSMIT output jack, and then to the patch
bay jack as shown in Figure 21, Nos. 3 and 4.
WARNING: Connecting the cable into the patch bay jack before con-necting the other end into the T-BERD 224 will take down the T1 circuit.
14. Repeat Steps 10 through 13 for LINE 2.
15. Insert 100 ohm terminating plugs into the patch
bay jacks as shown in Figure 21, Nos. 9 and
10, to avoid line imbalances.
Results
A. Retrieving In-Service
Results of the T1 Circuit
While out-of-service analysis is performed on one of the 24 T1 channels, in-service analysis of the entire T1 circuit is performed simultaneously.
NOTE: All results, including the T1 results, are reset to 0 each time the TEST RESTART switch or a major switch such as SOURCE CONFIGURATION I or II, is pressed.
1a. Press the RESULTS I category switch to
illumi-nate the LED next to SUMMARY.
2a. If “RESULTS OK” is not shown in the RESULTS I
display, press the RESULTS I arrow switch to scroll through the key, non-zero results regard-ing the T1 circuit’s in-service performance.
B. Measuring 3 kHz
Notched Noise
The following procedure assumes that Steps 1 through 15 have been performed.
NOTE: The following sequence of transmit-ting and measuring specific tones and
results must be performed at the
far-end test set simultaneously for proper circuit analysis.
1b. Press the SOURCE CONFIGURATION I switch to
display LEVEL (LEV@1004Hz).
2b. Press the SOURCE CONFIGURATION II switch to
select the transmit level (typically -13 dBm).
3b. Press the SOURCE CONFIGURATION I switch to
display 3-TONE SLP.
4b. Press the SOURCE CONFIGURATION II switch to
display 1004 Hz.
5b. To insert the test tone into the channel (selected
in Step 6) toward the far-end test set, press the INSERT (TX) switch to either LINE 1 or LINE 2, depending on the far-end test set’s location. For
the example shown in Figure 19 on page 27,
the INSERT selection should be set to LINE 2 to transmit the VF test tone from the T-BERD 224 to the far-end test set.